Guest post by Steven Goddard
In past years, NSIDC has referred to “declining multi-year ice” as the problem which the Arctic faces. Mark Serreze at NSIDC forecast a possible “Ice Free North Pole” in 2008, based on the fact that it had only first year ice. This year, multi-year ice has increased and NSIDC is now referring to declining “2+ year old” ice as the problem. Note the missing age group (2 year old ice) in the paragraph below from their latest press release .
First-year ice in particular is thinner and more prone to melting away than thicker, older, multi-year ice. This year, ice older than two years accounted for less than 10% of the ice cover at the end of February. From 1981 through 2000, such older ice made up an average of 30% of the total sea ice cover at this time of the year.
Due to the record minimum in 2007, it goes without saying that there isn’t a lot of three year old ice in 2009. Maybe next year they can raise the bar to 3+ year old ice, as the multi-year ice ages one more year?
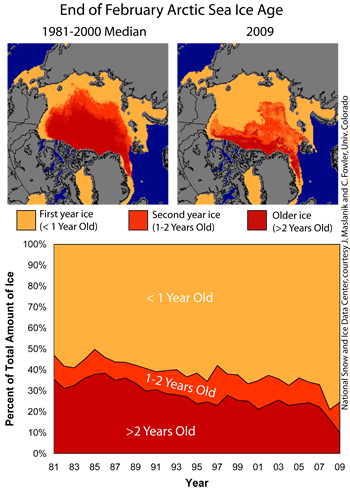
Multi-year ice has increased from 2008, up to nearly 25%. Compare multi-year ice vs. last year’s map below – upper right corner.
http://nsidc.org/arcticseaicenews/2008/040708.html
The press has picked up on the 10% figure, based on the new higher standard NSIDC has set.
Ice older than two years once accounted for some 30 to 40 percent of the Arctic’s wintertime cover and made up 25 percent as recently as 2007.
But last year it represented only 14 percent of the maximum. This year the figure fell to 10 percent.
Note too that ice extent is nearly back to normal and has not declined significantly from the winter maximum.
It’s possibly phased to the PDO. During a positive phase, one would expect ongoing decline of multiyear. Then, the the phase flips, multiyear may increase until the next flip. It will be interesting to track the above chart for a few more years, to get a feel for any potential phasing between ice characteristics and the PDO.
Adam from Kansas (14:14:26) :
Look at the maximum extent graph for the various suppliers in this post. Notice how CT “goes off the reservation” in 2006. Even though they come up with different amounts the deltas are consistent except for CT. I don’t trust their extent data anymore.
crosspatch,
So what caused the MWP?
OFF TOPIC
I dunno about arctic ice, but there is fresh snow tonight on my lawn in Montreal, QC, Canada… 🙂
The French have a saying:
“in April, you will not uncover yourself by one thread;
in May, do as you please;
in June, dress with almost nothing”
“En avril, ne te découvre pas d’un fil ; en mai, fais ce qu’il te plaît ; en juin, tu te vêtiras d’un rien”
For the most part of my adult life, I considered this some sort silly saying, because it rhymes in the French saying. April never required too warm clothes, winter was over. But for the two last years, the saying seems to be holding again.
I wonder when that expression was first coined.
Steven Goddard (16:44:55) :
“The Arctic always loses a lot of ice to wind blowing towards the North Atlantic – that is why there is never much ice more than five years old.”
I agree. So that leads me to the question of what if anything has changed. AGW implies the loss of ice is higher arctic temps. What I have seen recently would say that no – it’s more wind and/or currents that are affecting ice levels. I can’t imagine that reduced CO2 wouldn’t have any affect on that. So if it is wind/currents, are there patterns or cycles that can be tied to this that might help or worsen the ice loss?
Apparently ice retreat was so extensive during the MWP that it caused an entire race of highly cold-adapted people to disappear. Read up sometime on the Dorset people and their demise. These people hunted seals with spears and did not have boats or bow and arrow technology. The Inuit and Thule entered the territory as the ice retreated and the Dorset disappeared. It was probably all a result of Viking SUVs driving around Greenland.
Carsten Arnholm, Norway (14:48:09)
Here is an organization that is functioning properly.
International Conference on Climate Change
http://www.heartland.org/events/NewYork09/proceedings.html
crosspatch (16:47:05) : “. . . Or put another way, it appears that for the past 2000 years we don’t quite recover as much from each cooling period.”
Don Easterbrook claims “The climatic fluctuations over the past few hundred years suggest ~30 year climatic cycles of global warming and cooling, on a general rising trend from the Little Ice Age cool period. ”
http://www.ac.wwu.edu/~dbunny/research/global/geoev.pdf [ p. 23 ]
Note the “on a general rising trend”. He is working on a different time scale than your statement. Interesting!
I guess all this depends on how you define ice. Ice is frozen water. Old ice takes as much energy to melt as new ice.
This is perhaps a naive question, but…
…how exactly do you determine whether ice is 1 year old or 2 years old and what is the range of measurement error on that?
I love the psychological sleight-of-hand with the bright red and yellow colors. Its the equivalent of publishing a map of the Sahara in dark blue or purple.
Jack Green (18:00:54) : new versus old ice
The situation is more complicated than you state. Heck of a link below but I searched on “old ice” +”new ice” density melting
and took the second link “Descriptive Physical . . . “
http://books.google.com/books?id=94GNMv57uH8C&pg=PA229&lpg=PA229&dq=%22old+ice%22+%2B%22new+ice%22+density+melting&source=bl&ots=kWGL3Ek-wL&sig=u_E1k8oLoNqzQK3JnTvqyAjd8U8&hl=en&ei=XQbcSYe5CYnAMoOS_eIN&sa=X&oi=book_result&ct=result&resnum=2
Any reversal of previous trends are what, supposed to turn around overnight? Go back to normal within the blink of an eye, a white-gloved finger lightly tapped against of Ol’ St’ Nick’s nose? A jennie’s crossed arm head nod? Samantha’s magic (and charming) facial grimace? The wave of a wand? The media is clueless. And those scientists who blab to the media prematurely in order to get the next grant are to blame. May they all lose fingers and toes to frostbite. It will be a good and proper reminder of your job and how you screwed up.
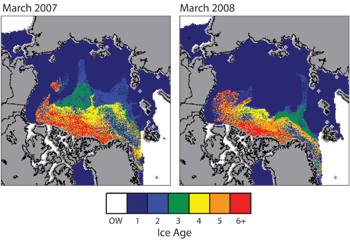
I guess their rationale is these two animations:
Covering 1981 to 2007.
http://nsidc.org/news/press/2007_seaiceminimum/images/20070822_oldice.gif
And then the updated one covering 2008-Feb2009.
http://nsidc.org/images/arcticseaicenews/20090406_animation.gif
The older sea ice keeps getting pushed out between Greenland and Iceland and then the general circulation also pushes older ice out into the western Arctic where it melts in the melt season now and, thus, there is little old ice left.
The NSIDC just seems like a closed organization to me and will not open their data for general public review. You have to be satisified with a computer-generated graphic or you should just go away.
Henry Phipps,
“I miss Everett Dirksen.” Me too, in spades! Examples:
“A
billiontrillion here, abilliontrillion there, and pretty soon you’re talking about real money.”And: “…the basic difficulty still remains: It is the expansion of Federal power, about which I wish to express my alarm. How easily we embrace such business.”
Another question.
1 climate time-step is widely accepted to be about 30 years in length. Hence, 60 years is 2 climate time-steps, 90 years 3 climate time-steps etc. The data in this article shows changes over a ~19 yr period (less than 1 climate time-step).
At best they are documenting the shape and characteristics of noise in the Artic ice cover over sub-climatic time scales.
and what are we supposed to conclude?
Walter Meir has his own website which posts his full 18 years fo experience, mostly as an aerospace engineer, now turned climate scientist.
I was disturbed in AGAIN opening my daily paper and seeing another alarmist headline from Reuters: “Arctic Sea Ice continues to shrink”.
So I wrote Walter Meir with a fairly respectful letter about how to present data as an optimist versus a pessimist as follows:
Mr. Meir,
I am sure you are a well meaning scientist. But just like the old saying about perception: one man will see a glass half empty, and another will see it half full.
I am an engineer who works with data and numbers. I have done so for 33 years professionally, and 40 years if you count the fact that I have been designing since I was 14 years old. So I know how to present data and skew results to present results with optimism or pessimism with simple “steering” of my presentation during peer review.
Last year, the NSIDC was claiming that Arctic ice was “very fragile” because of the summer of 2007 melt down and there was such a loss of “multi-year ice”. It surprised you all at the NSIDC, when in the following winter, the ice actually recovered, despite not much “multi-year” ice in many areas from the previous summer. This recent story from April 6th says the same thing, again, in sort of an alarmist fashion.
To me, an old ice cube in my freezer, if frozen completely, is pretty much the same as a new one. And indeed, in the winter of 2007/2008, there was a surprising recovery of sorts. And this winter (2008/2009) there was even more of a recovery than last year in the Arctic. The decline was listed as -11% per decade last year, and now MAGICALLY, it is now only -2.7% per decade on your trend charts. On the other side of the Earth, the Antarctic is now trending up at +4.7% according to your monthly charts, and just a month ago it was only +2.8%.
So what did we get from you in my newspaper today, Mr. Meir ? Headline: “Arctic Ice Continues to Shrink” (Reuters). If it were me, I would have foregone the few minutes of media attention you got and you might have said: “Trend Data Shows the Arctic is Making a Fragile Recovery the Past Couple Years”. Or perhaps “Global Ice Loss Lessens”.
Conclusion Equation: Walter Meir = “Half Empty” = Supporter of the IPCC conclusions = Not an unbiased scientist.
A few days ago, I used the published NSIDC data (despite some flawed and missing numbers), to calculate the GLOBAL sea ice trend. As of last week, global ice is above the 1979-2000 “average”. Global sea ice area for the past 30 years of satellite data is trending down by only -1.1% per decade based upon the NSIDC data tables. And who knows if the trend will reverse due to the low solar activity these past years as well as ocean current circulation patterns. But there are only 30 years of 350 satellite data points out of the thousands of years the past centuries of true history of the Arctic.
We have no real long term data about ice area…and we only have sketchy records of the USS Skeet coming up in 10 places near the Arctic pole starting in the late spring in the 1950s.
And, there is my constant gripe that you folks think 1979-2000 is some holy grail of average ice area and extent. What if “average” throughout the recent centuries is more like, um say, 1999-2009? Data is the data, but the NSIDC cherry-picked the “average” as 1979-2000, as if it was the holy grail of ice averages. If I may be so bold: that is very assumption-based science = bad reporting of data. The Arctic ROOS site does not throw away nearly 30% of the data as does the NSIDC.
So, can Walter Meir put on some optimist glasses for a while and say, maybe, just maybe, the Arctic is slowly recovering from a normal melt cycle ?
Mike Strong
Thanks john. It would nice to know the salinity values for sea ice by year to fully understand the implications of this subject. This subject must depend on how much ice gets to lower latitudes and subject to more heat resulting in more melting.
“It would nice to know the salinity values for sea ice by year to fully understand the implications of this subject. ”
That varies with year. The amount of salt that works out of the ice is pretty much a function of the amount of sunlight it gets. If you have an unusually cloudy summer, you get less salt worked out of the ice. Now there would be a general range of what is typical, but that will change depending on where the ice was when it aged and the conditions at that location. There is no set “2 year old ice contains X% salt” chart. It will also depend on the salinity of the water when the ice formed. The salinity of the Arctic Ocean itself varies from year to year.
“crosspatch (16:47:05) :
“So what was causing global warming 700 years ago?”
That would be the medieval warm period. Actually, it appears that climate has been in a general cooling trend with each warm period a little cooler than the preceding one. Roman warm period warmer than Medieval warm period, for example. Or put another way, it appears that for the past 2000 years we don’t quite recover as much from each cooling period.”
I look at the history & see one thing. We have a servo moving from one position to another. It is loosely controlled & there is ringing as it reaches stabilisation in the new position. That is why optima are less intense as are pessima.
Just an observation.
DaveE.
NBC was hyping the latest reduction in polar sea ice Monday evening. Imagine for a moment that they are miraculously right and the Arctic ocean completely cleared of ice this summer (or sometime soon).
What do you get?
Well, at such a small at such a sun angle (<23.5deg), there is not that much solar heating, but all that new open water (and a little solar heat) adds up to an increase in water vapor feeding into the atmosphere.
More moisture in the atmosphere means there will be more clouds which reflect sunlight and shade the surface. If that moisture is precipitated in the cooler northern parts of the Eurasian and North American land masses, it will likely be in the form of snow, which increases surface reflectivity. In both cases, the result is a cooling.
I think that is called a negative feedback.
If there is a danger from an ice-free Arctic Ocean, it is that this negative feedback is a precursor to our next (overdue) Ice Age…
In addition to “Quote of the Week”, how about “Comment of the Week”?
I nominate Mike Strong (18:24:21) : Letter to Walter Meir
The IPCC not functioning properly article refers to a police organization in England as far as I can tell and has nothing to do with the IPCC climate organization. I noticed this on Icecap yesterday. I assume the automatic retrieval system for that blog simply picked up the IPCC acronym.
Mike Strong (18:24:21) : “. . . that you folks think 1979-2000 is some holy grail of average ice area and extent.”
I think because of historical practices – before the computer age – climate “normals” were calculated on a 30 year data set ending in a “0” year, for example 1980, then 1990, then 2000. For your local weather normals these will be recalculated after 2010. I suspect the 1979-2000 ice data you are unhappy about because they throw away data is simply a throw-back to the pre-computer age. So I suspect eventually we will have 1981-2010, and lasting for 10 years. Then maybe 1991-2020?
This seems unnecessary with computers – at least to me – but maybe it is a psychological thing.
Well if they are going to use age as measure of anything, then I’m more worried about the age and maturity of the President of the United States of America, than the age of the sea ice 😉
Mildly OT:
A track-hoe operator in Alberta, Canada, whom I queried via e-mail told me the following things:
1. Water mains buried to the standard minimum engineered spec of 2.6 meters had a funny habit this winter of freezing/breaking.
2. The frost depth was unprecedented in his 35 years of work digging in the province.
The gentleman was loathe to go on the record, as he works for the provincial government with its own strong feelings regarding dangerous manmade global warming…