By Joseph D’Aleo, CCM, ICECAP

Map of US weather records for week ending 4/6/09 click image to enlarge or here for source. Map created by HAMWeather,
UPDATE: NOAA predicts the Red River Will Crest Again in Fargo-Moorhead in Late April here possibly again at records levels.
Just a week after the last major northern plains blizzard another significant snowfall occurred this weekend. Models did poorly with the location of the heaviest snow bands and generally overdid the magnitude. These models sometimes have difficult with the first 48 hours, but Susan Solomon and friends tell us you can depend on cruder models to predict the climate 100 years or even a thousand years in advance.
Several inches of snow fell in parts of Nebraska, South Dakota, Iowa, southern Minnesota into southern Wisconsin. This will include parts of the Red River Basin already in flood and with deep snowcover (click here to enlarge).
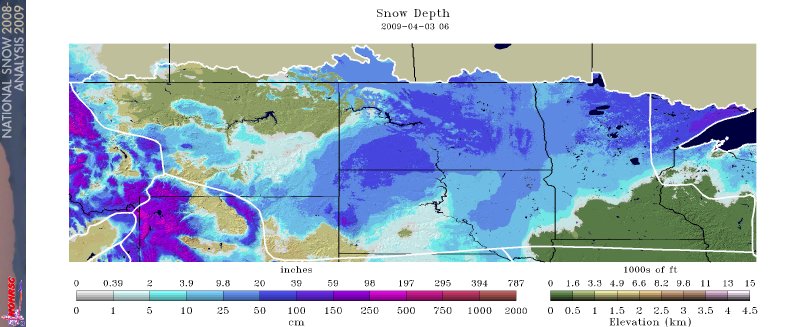

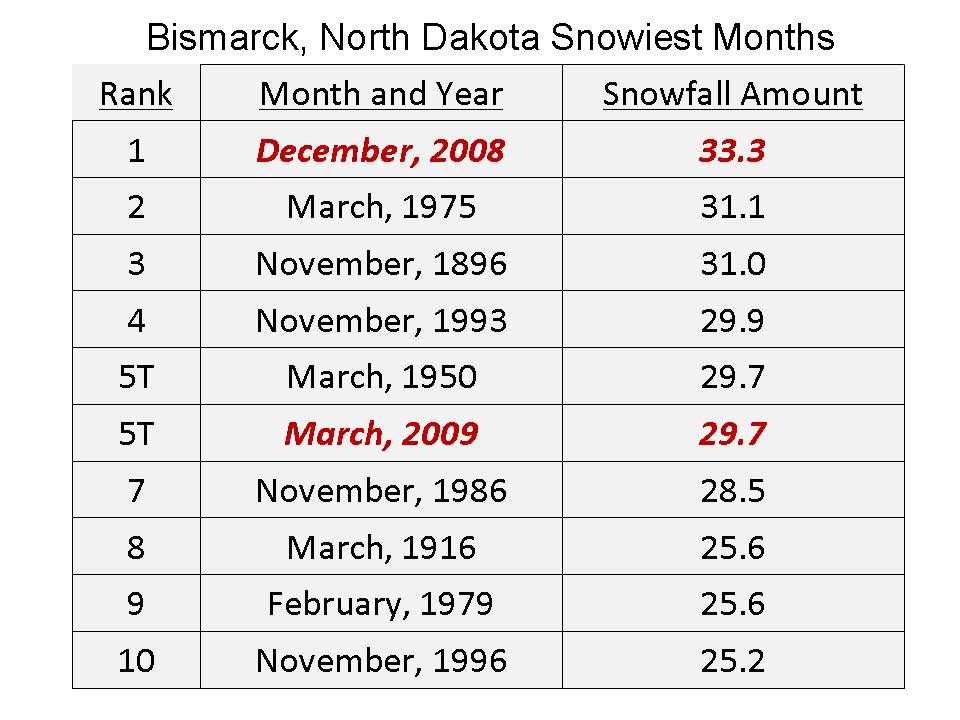
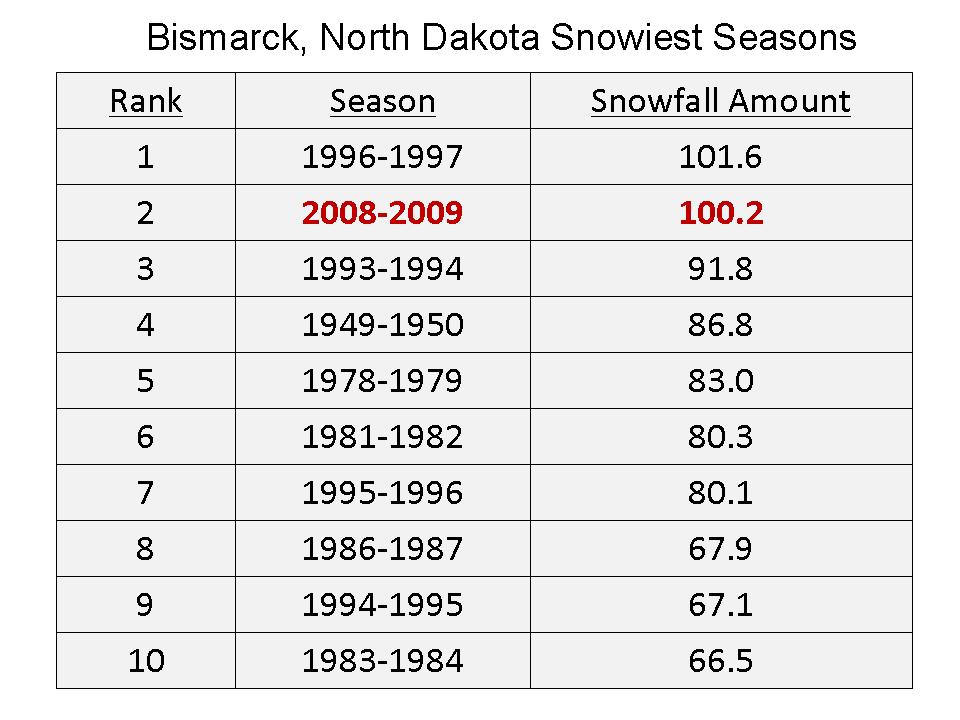
The northern plains has been hit hard this year. Fargo set a record for snowfall and precipitation for March, Bismarck also in North Dakota had record snowfall in December and the second snowiest March, the first year with with two monthly totals in the top ten enlarged here.

Bismarck is on the northern edge of this storm. If they get more than 1.4 inches of snow from this (or some later) storm, they will set an all-time snow record. See the enlarged listing shown below here as of April 1 after the big blizzard. See all the watches and warnings here.

The National Weather Service said International Falls, with the reputation as the nation’s icebox, recorded 124.2 inches of snow this winter. That tops the old record of 116 inches set in 1995-1996. The nearly 9-inch dump from this week’s snowstorm pushed International Falls over the edge. The Minnesota-Ontario border area has been pummeled with snowstorms this winter.
And from KOMO News Weary Spokane residents who are sick of snow can at least now be consoled by the fact that they were a part of history.
A snow storm on Sunday has made this the snowiest winter on record in Spokane. The National Weather Service said 93.6 inches of snow has been recorded at Spokane International Airport this winter, breaking the record set in 1949-50 by a tenth of an inch. It took snowfall of 3.9 inches of Sunday, a record for the date, to break the all-time record. This is the second-consecutive heavy winter in Spokane. Last year, more than 92 inches of snow fell on the Lilac City, third most since records started in 1893.
Spokane’s Top 5 Snow Years:
RANK WINTER SNOW TOTAL
1 2008-2009 93.6
2 1949-1950 93.5
3 2007-2008 92.6
4 1974-1975 89.0
5 1992-1993 87.3
Spokane is also mired in unseasonable cold. Normal high temperatures at the of March are in the low 50s, but this month has seen highs in the 30s and 40s.
See here how an amazing 358 lowest temperature records and 409 snowfall records were broken for the week ending Apr 2, 2009.
William Rice (15:38:56) :
“Meanwhile we have NatGeo, and your old buddy Dr. Meier, misrepresenting the trends of the arctic sea ice:
Instead of highlighting the large year over year increase, they state:
“This winter’s maximum Arctic sea ice extent was 5.85 million square miles (15,150,000 square kilometers)—about 278,000 square miles (720,000 square kilometers) less than the Arctic average between 1979 and 2000. ” ”
Over at CT the maximum ice area on record in 1979 and 1988 is 15 X 10^6 Km2. Since the Artic is bounded by land its area and extent has an upper limit.
Anthony,
You’re obviously a smart guy (I mean that), why then do you let misinformation propogate so freely from your ‘balanced’ website? This is an honest question, not at all a snipe. You surely know that the jump in sea ice from summer to winter varies hugely, the magnitude of which has been over double what it was this year in the recent past. You also know that a rebound to anywhere near average from a record depletion is going to necessarily be a big jump – a big jump but an UTTERLY irrelevant number. Why then would you let that sort of misinformation continue to spread if you are as open-minded as you say you are?
The LONG term trend is undoubtedly down (see below graph). I’m just intrigued as to why you would let that sort of distorted analysis through and snip at someone like me when I point it out. Why don’t you correct them, so your site maintains integrity?
http://scienceblogs.com/illconsidered/2008/09/arctic-sea-ice-recovered-in-2008.php
(Graph at top of page)
William Rice, the average is chosen over that period because that’s when the useful satellite data series begins, nothing sinister. Just like the standardised time period for global surface temps is often around 1960-1990. It has presumably been this way since a long enough data series was first established.
Why don’t you tell me, why would you suddenly CHANGE your reference point if it has been in use since long before denialists had anything to deny?
REPLY: I didn’t see an apology in there anywhere for your behaviour, only a shift in focus. And then there’s that word again. If you want debate, lose the ad homs and labels, otherwise find another blog to bother. – Anthony
CodeTech,
Oh you’re so generous.
Let’s have a peer-reviewed citation for your ‘incontravertible’ claim that climate moves in 70 year cycles and that this is all that recent warming has been caused by. My goodness, what has the IPCC been worrying about all this time?
And I’m sorry, but the arrogance lies firmly on the side that says they can safely dispense with decades of carefully gleaned knowledge from thousands of climate specialists, chemists and physicists and proudly claim that they know better “cos they’s read a blog”. Now THAT’S a special type of arrogance.
The final point to be noted about increases in sea ice over winter (besides the fact that they’re going to happen – duh) is that what’s forming is new thin ice, typically only a metre or so thick, if that. This is MUCH more susceptible to rapid remelting in the following summer, compared to the enormous amounts of multi-metre thick ice that was permanently lost in a winter like 07-08. The trend will continue to be down.
Does anyone here arguing this point actually genuinely believe that we will not sea an ice-free arctic in the coming summers (say in a decade or two) based on watching the satellite image changes from 1979?
Mr. Bennett, historically, climate has been determined by your address (seasonal axial tilt, longitude, latitude, and altitude, along with proximity to large bodies of water). Things that affect weather patterns within climate zones (your address) include pollutants, oceanic oscillations, land use practices, cloud cover, etc. Climate is stable, weather patterns are not. Can you tell me, based on your address and what climate zone you live in, how CO2 (with the assumption that it will cause the air to warm) will affect your weather patterns? If you live in an arid climate away from ocean breezes, you might green up under global warming. If, on the other hand, we have global cooling, you will turn into dust which will get blown into the air, caught in wind patterns, and probably land in an ocean somewhere.
There are two things that can affect climate zones: Continental drift and uplift/subduction to a different longitude/latitude/altitude, and the long-cycled axial wobble that creates a much greater slant to our seasonal axial tilt away from the Sun.
The question once again: What will warmer air do to the weather patterns in your area/climate zone?
Matt Bennett asks:
Do you genuinely not understand a sine wave and not realize that there is good evidence that the Arctic has been ice free in summer in the past, and yet, we have had Ice in the Arctic in summer, lo, these last hundred years or so.
Matt Bennett (20:00:17) : ” Why would a one year trend carry more importance than a consistent deviation from a defined longterm average? Do you understand this? ”
1979 – 2000 is not long term. Do you understand this?
“deviaton from a defined longterm average”. The “defined” part is carefully chosen to produce specific anomolies. Do you understand this?
[snip]
Matt Bennett,
Nothing sinister? So why cut off your “baseline period” at 2000? The answer is because this is when it started to trend down, so comparing the current value to a period when the ice extent was larger makes the current value seem smaller. You don’t see this as an attempt to manipulate?
What I find sinister and arrogant is you and your kind’s constant demands to shut off viewpoints and voices that don’t agree with yours. If your evidence was strong, you would not need to silence your critics.
This is not a steady process, nor is 1979-2000 a relevant period to determine such, so the statistic is clearly designed to manipulate. I am not saying that a one or two year trend says everything about the data either, but it certainly is more relevant to the claims of doom and gloom than a bogus comparison against an arbitrary baseline average.
Your sea ice thickness comments are repeating the same guesses of others. If you repeat it long enough, it becomes the truth, right? There is no hard data to prove this point. Please correct me if I’m wrong with references (no, computer models are not proof). Besides, the only portion of the ice for which this possibly could be relevant is the ice area that doesn’t melt during the summer. Since the ice extent grew summer over summer, and appears to be on it’s way to another year of recovery, this doesn’t appear to be a cause for catastrophic doom and gloom. So yes, I would wager that we will not see an ice free arctic in 2 decades.
Your faith in the UN and their IPCC is very heart warming. I prefer reason over faith. What has the IPCC been worried about? A better question would be: What has the UN ever accomplished in our lifetimes, besides spending more money and empowering dictators? The UN is simply after more power, and the global warming scare is simply a big power play and money grab, for which many special intersests are jumping in on.
There is no consensus, by the way (nor does it matter, truth is not up to a vote)…plenty of scientists disagree with your unproven theories, so please don’t bring that weak appeal to authority. Try bringing facts and evidence. If the knowledge was so “carefully gleaned”, then why did your boys fail to predict the last decade of cooling? And why is every new report titled “scientists say that XXXX worse than expected”? If the knowledge is so infallable (and if the science were settled), they would have expected it!
“Does anyone here arguing this point actually genuinely believe that we will not sea an ice-free arctic in the coming summers (say in a decade or two) based on watching the satellite image changes from 1979?”
Count me as one who does not genuinely believe…
Mike Bryant
Matt Bennet…
You’re funny, but you failed to enlighten anyone. All you did was deny. You denialist, you.
Their existence? How to keep the scientifically illiterate rubes stressed and worried over a non-issue? Fabricating… massaging… altering historical climate records? Who cares? The IPCC has demonstrated that they have little or nothing to do with Science and everything to do with politics.
You actually don’t see your extreme arrogance, do you?
No, we won’t see an ice-free Arctic in the coming summers. The Arctic has been here before, and that was documented by the Chicken Littles of the day. But hey, you go right on believing unsupportable predictions and thinking you’re better than everyone else. Let us know how that’s working out for you.
Matt Bennett:
I know there’s nothing “sinister” about the time line of 1979 to present. It’s simply all the satelite data we have. The issue with starting in 1979 is that is the end of a cooling period, and over all we are recovering from the Little Ice Age. Of course on the larger climate scale (hundreds of thousands of years) the current interglacial has been rather stable, as previous interglacials have spiked at higher temperatures. Based on previous interglacials and ice ages, we could be in for a shock when the next ice age starts.
is MUCH more susceptible to rapid remelting in the following summer, compared to the enormous amounts of multi-metre thick ice that was permanently lost in a winter like 07-08
So, once the ice starts melting, it can never recover?
Here is some evidence of problems at CT:
http://i165.photobucket.com/albums/u43/gplracerx/FallArcticIceExtent4-3-2009.jpg
http://i165.photobucket.com/albums/u43/gplracerx/SummerArcticIceExtent4-2-2009.jpg
http://i165.photobucket.com/albums/u43/gplracerx/SpringArcticIceExtent4-3-2009.jpg
DeWitt Payne gathered and presented this at CA
We will never see an ice free arctic if you mean no ice anywhere in the Arctic. If you mean the Northwest Passage, it has been open several times in history without icebreakers. The first known successful navigation by ship was in 1905. It was also open in the 1940’s but not at present even with icebreakers.
As for that thin new ice, a NASA study published in the peer-reviewed journal Geophysical Research Letters on October 4, 2007 found “unusual winds” in the Arctic blew “older thicker” ice to warmer southern waters. Despite the media’s hyping of global warming, Ignatius Rigor, a co-author of the NASA study, explained, “While the total Arctic area of ice cover in recent winters has remained about the same, during the past two years an increased amount of older, thicker perennial sea ice was swept by winds out of the Arctic Ocean into the Greenland Sea. What grew in its place in the winters between 2005 and 2007 was a thin veneer of first-year sea ice, which simply has less mass to survive the summer melt.” “Unusual atmospheric conditions set up wind patterns that compressed the sea ice, loaded it into the Transpolar Drift Stream and then sped its flow out of the Arctic,” said Son Nghiem of NASA’s Jet Propulsion Laboratory and leader of the study.
Matt,
I think you are wrong and I’d bet big money on it. Would you?
Have you seen the enormous increase in ice the last 16 months? Have you looked at the temperature records set in the North this winter? And the huge amounts of snow the last two winters? We’ve seen year over year increases the last two winters in snowfall and glacier growth. The rate of change is massively towards increasing ice in the next few years.
I’ve spent a lot of time going over the ice data as well as reading both Western explorers’ diaries and Ethnological anecdotes. I’ve also looked at proxies such as fire records and freeze records for the US.
Its pretty clear that the 1930s were much warmer than today for most of North America. Much of the Arctic was ice free at that time. There were enoromous fires across much of the Boreal forest during the 30s. The US from the 1900s to the 1950s did not see much in the way of Arctic outbreaks and the weather was unusually mild, allowing citrus farms to become established in Florida, California, and the Rio Grande Valley.
The late 70s and early 80s saw the return of severe cold across the Northern Hemisphere including McFarland events that pushed freezing weather all the way to the Darien Gap in central America that destroyed much of the citrus crop. Having high ice years is to be expected.
Furthermore, the Norse report ice free summers for much of the early middle ages. The Innuit and Tlingit oral histories paint much the same picture during the early middle ages. The rate and density of Innuit and Norse settlements at that time have yet to be rivalled even today. The bone isotope studies of fauna from middens on the Arctic from that period show a much warmer Arctic than today.
Going further back, there is something called “Arctic Hysteria” from 10000 to 4000 BC where mammoth hunters in Siberia saw an explosion in population in the high latititudes as well as an explosion in art and other cultural artifacts – hence the term “hysteria”. There are some preliminary sediment and treeline studies that hold that the Arctic was totally ice free during the climate optimum.
So, picking a high ice year then looking that the trends that culminate in a high wind summer, then ignoring the massive swing back the last two years, and ignoring the other swings in the past, places your assertion on very thin ice.
This is the funny part:
On September 14, 2007, the European Space Agency stated that, based on satellite images, ice loss had opened up the passage “for the first time since records began in 1978”. According to the Arctic Climate Impact Assessment, the latter part of the 20th century and the start of the 21st had seen marked shrinkage of ice cover. The extreme loss in 2007 rendered the passage “fully navigable”. However, the ESA study was based only on analysis of satellite images and could in practice not confirm anything about the actual navigation of the waters of the passage. The ESA suggested the passage would be navigable “during reduced ice cover by multi-year ice pack” (namely sea ice surviving one or more summers) where previously any traverse of the route had to be undertaken during favourable seasonable climatic conditions or by specialist vessels or expeditions. The agency’s report speculated that the conditions prevalent in 2007 had shown the passage may “open” sooner than expected. An expedition in May 2008 reported that the passage was not yet continuously navigable even by an icebreaker and not yet ice-free.
Matt Bennett (05:37:35) :
…decades of carefully gleaned knowledge from thousands of climate specialists, chemists and physicists
ROTFL! Way to try to sell the CAGW/CC product, Matt. You’ve not only guzzled the climate fruit punch, but you seem to have purchased shares in the factory cranking out that bilge.
Eve (07:44:45) :
We will never see an ice free arctic if you mean no ice anywhere in the Arctic. If you mean the Northwest Passage, it has been open several times in history without icebreakers. The first known successful navigation by ship was in 1905. It was also open in the 1940’s but not at present even with icebreakers.
Yet 6 yachts sailed through the passage last summer, without the aid of icebreakers!
yada, yada, yada.
If it is the tenth since 1950, it would also be consistent with, umm, let’s see, lots of ice being formed in the last 58 years or so and having to go somewhere. Wonder where all that ice came from?
Phil. (10:20:10)
Yet 6 yachts sailed through the passage last summer, without the aid of icebreakers!
links please?
It does not look to me that the passage was navigable last year, as the open leads do not appear to have ever completely opened up even on Sept 14 which was about the time of minimum ice in 2007.
http://igloo.atmos.uiuc.edu/cgi-bin/test/print.sh?fm=09&fd=14&fy=2007&sm=09&sd=14&sy=2008
Larry
hotrod (13:59:43) :
This article may also interest as it associates cold climes with severe storms. http://www.telegraph.co.uk/news/2496902/Lord-Nelson-and-Captain-Cooks-shiplogs-question-climate-change-theories.html most of the text included below.
Also this link speaks of a reduction in the predicted number of Atlantic Hurricanes this season, the Precautionary principle in action. 🙂
http://www.breitbart.com/article.php?id=CNG.89f94643ff57e11b42acfa11b92f8e26.d41&show_article=1
By Tom Peterkin
Last Updated: 11:56AM BST 04 Aug 2008
Lord Nelson and Captain Cook’s shiplogs question climate change theories
A paper by Dennis Wheeler, a geographer based at Sunderland University, recounts an increasing number of summer storms over Britain in the late 17th century Photo: AP
Scientists have uncovered a treasure trove of meteorological information contained in the detailed logs kept by those on board the vessels that established Britain’s great seafaring traditition including those on Nelsons’ Victory and Cook’s Endeavour.
Every Royal Naval ship kept a detailed record of climate including air pressure, wind strength, air and sea temperature and major meteorological disturbances.
A group of academics and Met Office scientists has unearthed the records dating from the 1600s and examined more than 6,000 logs, which have provided one of the world’s best sources for long-term weather data.
Their studies have raised questions about modern climate change theories. A paper by Dennis Wheeler, a geographer based at Sunderland University, recounts an increasing number of summer storms over Britain in the late 17th century.
Many scientists believe that storms are caused by global warming, but these were came during the so-called Little Ice Age that affected Europe from about 1600 to 1850.
The records also suggest that Europe saw a spell of rapid warming, similar to that experienced today, during the 1730s that must have been caused naturally.
“British archives contain more than 100,000 Royal Navy logbooks from around 1670 to 1850 alone,” Mr Wheeler said. “They are a stunning resource. Global warming is a reality, but our data shows climate science is complex. It is wrong to take particular events and link them to carbon dioxide emissions.
“These records will give us a much clearer picture of what is really happening.”
Well above average temps in the PNW the last couple of days…
Many low-temperature records established in the last couple of days across the plains, midwest, and south. Snow is falling again in the Sierras. Another massive cold front is bearing down on Washington state.
Mike Bryant (23:52:25) :
…
The type of breathless parsing you quoted is much worse than ignorance, it is advocacy.
Thanks Mike – I had never considered that advocacy was worse than ignorance.
Interesting.