By Joseph D’Aleo, CCM, ICECAP

Map of US weather records for week ending 4/6/09 click image to enlarge or here for source. Map created by HAMWeather,
UPDATE: NOAA predicts the Red River Will Crest Again in Fargo-Moorhead in Late April here possibly again at records levels.
Just a week after the last major northern plains blizzard another significant snowfall occurred this weekend. Models did poorly with the location of the heaviest snow bands and generally overdid the magnitude. These models sometimes have difficult with the first 48 hours, but Susan Solomon and friends tell us you can depend on cruder models to predict the climate 100 years or even a thousand years in advance.
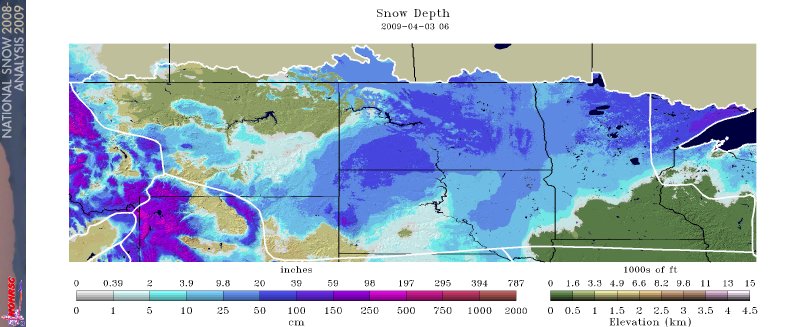
Several inches of snow fell in parts of Nebraska, South Dakota, Iowa, southern Minnesota into southern Wisconsin. This will include parts of the Red River Basin already in flood and with deep snowcover (click here to enlarge).

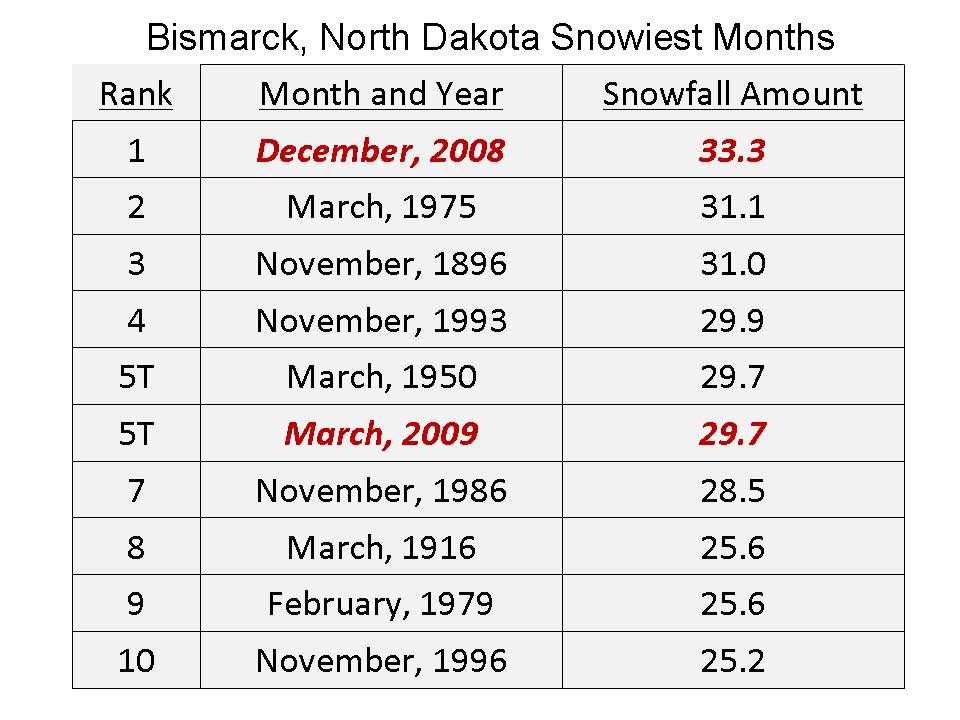
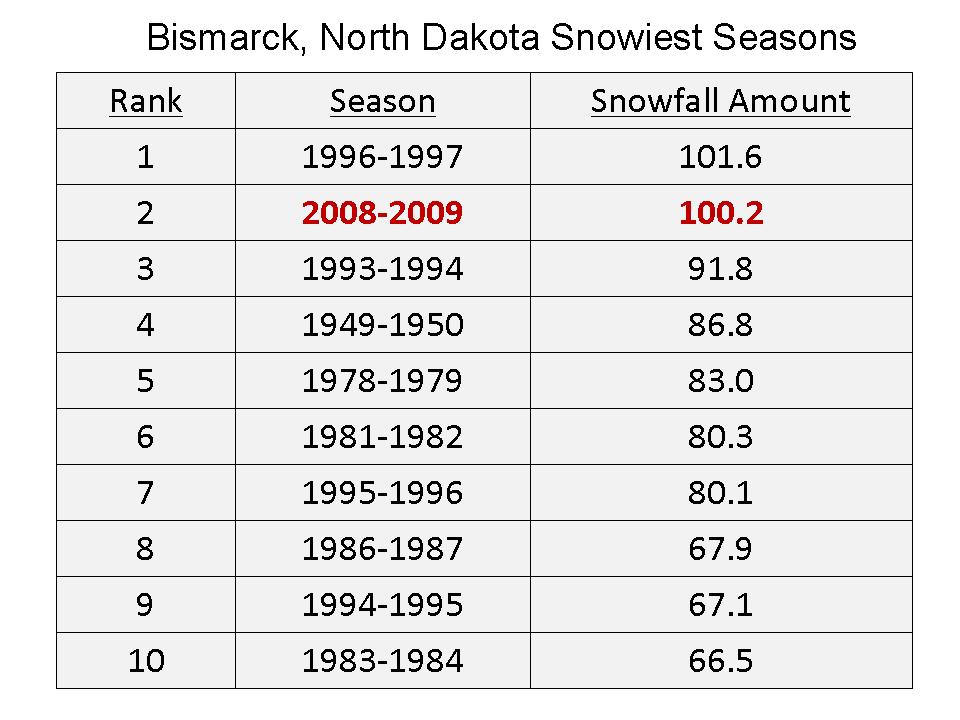
The northern plains has been hit hard this year. Fargo set a record for snowfall and precipitation for March, Bismarck also in North Dakota had record snowfall in December and the second snowiest March, the first year with with two monthly totals in the top ten enlarged here.

Bismarck is on the northern edge of this storm. If they get more than 1.4 inches of snow from this (or some later) storm, they will set an all-time snow record. See the enlarged listing shown below here as of April 1 after the big blizzard. See all the watches and warnings here.

The National Weather Service said International Falls, with the reputation as the nation’s icebox, recorded 124.2 inches of snow this winter. That tops the old record of 116 inches set in 1995-1996. The nearly 9-inch dump from this week’s snowstorm pushed International Falls over the edge. The Minnesota-Ontario border area has been pummeled with snowstorms this winter.
And from KOMO News Weary Spokane residents who are sick of snow can at least now be consoled by the fact that they were a part of history.
A snow storm on Sunday has made this the snowiest winter on record in Spokane. The National Weather Service said 93.6 inches of snow has been recorded at Spokane International Airport this winter, breaking the record set in 1949-50 by a tenth of an inch. It took snowfall of 3.9 inches of Sunday, a record for the date, to break the all-time record. This is the second-consecutive heavy winter in Spokane. Last year, more than 92 inches of snow fell on the Lilac City, third most since records started in 1893.
Spokane’s Top 5 Snow Years:
RANK WINTER SNOW TOTAL
1 2008-2009 93.6
2 1949-1950 93.5
3 2007-2008 92.6
4 1974-1975 89.0
5 1992-1993 87.3
Spokane is also mired in unseasonable cold. Normal high temperatures at the of March are in the low 50s, but this month has seen highs in the 30s and 40s.
See here how an amazing 358 lowest temperature records and 409 snowfall records were broken for the week ending Apr 2, 2009.
Still not spots on the sun today
It’s the same as the spots yesterday
Leif? Where is the ramp up?
It’s funny when man thinks he knows something….which of course is often nothing at all or the opposite
tax, tax and more tax, that’s something that man understands. This and “it’s no my fault” and “did I do that?”
Nice and warm in Perth, Western Australia at the moment, above average for this time of year?
Why no mention?
Regards
Andy
Is the single red dot in Ohio from UHI?
It looks like it’s in the vicinity of Dayton. I’m curious where this station is located. I wonder if there’s pictures of it.
Flanagan (22:54:14) :
Steven: Global warming means more snow at northern latitudes and less snow/more rain around the tropics. Please stop bringing forward half-truths like these ones.
B.S.
Yes and you have also told us it means more deserts and more rainfall and floods. Even you don’t believe anything this silly.
The description you gave here is in fact a standard prescription for the onset of an ice age. I suppose that would be global warming too.
Curious…
Either The Wayback Machine has been tampered with, or they never saved older versions of certain pages from wiki:
http://en.wikipedia.org/wiki/Little_Ice_Age
http://en.wikipedia.org/wiki/Medieval_Warm_Period
Have both been re-written to match the AGW Party Line and the wayback machine can not find older versions…
Also the roman age optimum finds nothing as does a search for the migration era pessimum, yet I found a copy in the Google cache (for the migration era pessimum) and the deletion notice for the Roman Warm Period page…
OK, I’ve pasted what seemed pertinent into comments in:
http://en.wikipedia.org/wiki/index.html?curid=17054538
If anyone has any related historical text per any of the optimums, pessimums, warm periods, or cold periods, feel free to past it into a comment there for preservation…
Still need a Roman Warm Period page ( MWP seems secure, probably due to close attention… but a copy of some MWP text might be nice too…)
GAK:
That url ought to have been:
http://chiefio.wordpress.com/2009/04/06/bond-event-zero
for anyone wanting to save climate history descriptions…
Weather pattern expected for the month of January happening in April?
http://www.accuweather.com/news-story.asp?partner=accuweather&traveler=0&article=5
E.M.Smith (10:02:43) :
If we’re at the peak of a cycle that is 1000 years long (Dark Ages 500 AD, MWP at 1000 AD, LIA at 1500), then we should be about to see the bottom drop out since we also appear to be at the peak of a 60 year cycle.
BTW loved the term Langoliers for the Wikipedia AGW vigilantes.
The rapid warming of the Antarctic Peninsula is well known to science – e.g., nsidc.org/news/events/IPY_APCV/IPY-APCV_booklet.pdf . This is driven by global warming amplified by changes in the polar westerlies.
The wetting of the high northern latitudes (outside of summer) is a well known consequence of global warming as the jet streams contract northward due to declining baroclinicity in middle latitudes, and is not sufficient to stop escalating summer drought driven by hotter summers. This shift also leads to a drying in the subtropics (take a look at the long long droughts now affecting the SW US, southern Europe, subtropical South America, southern Australia).
Leif Svalgaard (08:58:05) :
“OT: support SOHO at http://mission-madness.nasa.gov/mm/bracket.html
click on SOHO then submit vote !”
I have logged in and voted for SOHO with every computer in the office.
45% 10754 votes?
I think you need some more votes.
DJ:
Which begs the question: what drives global warming?
It can’t be due to increases in a tiny trace gas [click]. If CO2, at current concentrations, adds anything at all to global warming, that minuscule effect is overwhelmed by other effects. Its effect is too small to worry about, and it is demonstrably not the driver of global warming.
I keep harping about this since it is being proven by none other than planet Earth herself that CO2 does not matter. And since it doesn’t matter, then the central [and really the only] argument for Cap & Trade, and for labeling CO2 a pollutant, and for carbon credits, and for spending any money at all on CO2 mitigation is money completely wasted.
So when you say ‘driven by global warming’, either you are still — against all the evidence — dreaming that CO2 is the driver of global warming, in which case your credibility is completely shot, or you accept that all except for possibly the tiniest part of global warming is not caused by CO2 — in which case you need to join the skeptics’ side and demand that the government must immediately stop wasting our money on a pointless and futile crusade to control a tiny, beneficial and completely harmless trace gas.
Which is it?
DJ: Who drives you? Your most dear prophet perhaps?
There is now a very short page for the Roman Optimum (warming period)
http://en.wikipedia.org/wiki/Warm_period
======================
A warm period is an epoch or era, usually lasting a century or more, during which the earth’s average atmospheric temperature is higher than usual. As far back as geological proxy measurements go, each warm period has been followed by a cool period.
According to Dennis Avery, warm periods are associated with climate stability:
* The Earth’s climate is more stable during warm periods. The warming heats the polar regions more than the equatorial regions, reducing temperature differences and thus reducing the power of storms. For instance, Chinese court records indicate far fewer floods and droughts during the Roman Warming of the first century and the Medieval Warming of the 12th century than during the intervening cold Dark Ages and the recent Little Ice Age. [2]
Some scientists believe that warm periods increase the frequency or severity of hurricanes.[1]
[edit] Historical warm and cool periods
Main article: Paleoclimatology
* Holocene climatic optimum – 7,000 B.C. to 3,000 B.C.
* Roman Warm Period – 200 B.C. to A.D. 600
* Dark Ages Cold Period – A.D. 600 to 950
* Medieval Warming – A.D. 950 to 1300
* Little Ice Age – 1300 to 1850
[edit] Notes
1. ^ The 2007 report of the Intergovernmental Panel on Climate Change rates the probability of such a link as “more likely than not.” [1]
This science article is a stub. You can help Wikipedia by expanding it.
=======================
Larry
Adolfo Giurfa (11:16:03) :
E.M.Smith Kind of Deja-Vu with present times, don’ t you think?
“This period corresponds to the time following the Decline of the Roman Empire around 480 and the Plague of Justinian (541-542).”
Unfortunately, that is not the only parallel. There is a regular cycle of empires rising and culture flourishing during the Optimum warm periods and then the collapse of empire and destruction of culture during the following Pessimum or cold periods.
IFF we could learn from this and prepare, we could get off of this wheel of fortune… but we seem incapable as a species.
Younger Dryas – cold period. 11,100 years Before Present. Bond Event 8.
End of the Clovis People in North America. Disruptive cold globally.
Boreal – the following warm period when England and Ireland became islands and Eurasia began the march to civilization:
http://en.wikipedia.org/wiki/Boreal_(period)
“Those who stayed became hunter-gatherers of the forests and fishers of the numerous bays, inlets and shallow waters around the thousands of islands that now spangled the seas of Europe. They lived richly and were encouraged to enter the pre-productive phase that we call the Mesolithic. Those who moved east hunted out the last of wild big game and turned their best efforts into learning to herd what was left. In the Americas, humans had left the Paleoindian phase and were now in the Archaic.
Meanwhile humanity toward the south of the north temperate zone had already turned to food production in a number of widely separated locations and were on the brink of civilization. ”
Bond Event 7 – un-named about 10,400 BP.
Bond Event 6 – The Erdalen event in Norway and a cold China 9400 BP
Bond Event 5 – 8100 BP. The 8.2 Kiloyear Event. From:
http://en.wikipedia.org/wiki/8.2_kiloyear_event
“Cooler and drier conditions prevailed, as in the Younger Dryas though less extreme. Yet the changes may have been severe enough to impact one of the earliest settled human communities: the first phase of Catal Huyuk ended during the 8.2 kiloyear event. The site was abandoned and not re-occupied until about 5 centuries later, when climate conditions had improved markedly.
Drier conditions were notable in North Africa, while East Africa suffered five centuries of general drought. In West Asia and especially Mesopotamia, the 8.2ky event was a three-hundred year aridification and cooling episode, which provided the natural force for Mesopotamian irrigation agriculture and surplus production that were essential for the earliest class-formation and urban life. ”
Bond Event 4 – 5900 BP From:
http://en.wikipedia.org/wiki/5.9_kiloyear_event
“The 5.9 kiloyear event was one of the most intense aridification events during the Holocene. It ended the Neolithic Subpluvial and probably initiated the desiccation of the Sahara desert. Thus, it also triggered world-wide migration to river valleys, e.g. from central North Africa to the Nile valley, what eventually led to the emergence of first complex, highly organised, state-level societies in the 4th millennium BC.”
“In the Middle East the 5.9 kiloyear event led to the abrupt end of the Ubaid period.
The 5.9 kiloyear event was also recorded as a cold event in the Erhai Lake (China) sediments.”
Followed by the rise of the Egyptian empire and the birth of civilization.
Bond Event 3 – 4200 BP From:
http://en.wikipedia.org/wiki/4.2_kiloyear_event
“The 4.2 kiloyear BP aridification event was one of the most severe climatic events of the Holocene period in terms of impact on cultural upheaval. Starting in ≈2200 BC, it probably lasted the entire 22nd century BC. It is very likely to have caused the collapse of the Old Kingdom in Egypt as well as the Akkadian Empire in Mesopotamia. Also, the drought may have initiated southeastward habitat tracking within the Harappan cultural domain.”
“In the Persian Gulf region, there is a sudden change in settlement pattern, style of pottery and tombs at this time. The 22nd century BC drought marks the end of the Umm al-Nar period and the change to the Wadi Suq period.”
“China. The drought may have caused the collapse of Neolithic Cultures around Central China during the late third millennium BC.”
Followed by the rise of the New Kingdom in Egypt and several other cultures flourishing in the following warm period
Bond Event 2 – 2800 BP From:
http://en.wikipedia.org/wiki/Iron_Age_Cold_Epoch
“The Iron Age Cold Epoch (also referred to as Iron Age climate pessimum or Iron Age neoglaciation) was a period of unusually cold climate in the North Atlantic region, lasting from about 900 BC to about 300 BC, with an especially cold wave in 450 BC during the expansion of ancient Greece. It was followed by the Roman Age Optimum (200 BC – 300 AD).”
Notice that this was about the time that Egypt sliding into ruin and a lot of history of warfare was being written… This wiki page also has the link to the Roman Age Optimum that is now dead… Wouldn’t want to point out that the golden age of Rome was built on the bones of a cold period (and was followed by a cold period collapse) and that the golden age of Egypt was in a prior warm period… and so the cycle turns.
Bond Event 1 – 1400 BP (or about 450 to 900 AD) which used to link to the page: http://en.wikipedia.org/wiki/Migration_Period_Pessimum that has been eaten by the AGW Langoliers… but:
http://en.wikipedia.org/wiki/Migration_Period
Gives a PC version where the invasions of people escaping the cold frozen central Eurasian Steps is call “emigration” or “migration”. When I learned that history 40+ years ago we called it war and invasion… but what’s a few armies, swords, murder and mayhem among friends. Just notice that other than the folks in Carthage attacking Rome all the travel seems to be toward the more southern warmer places… wonder why…
It is also called the Dark Ages:
http://en.wikipedia.org/wiki/Dark_Ages
Which of course was followed by the Medieval Warm Period:
http://en.wikipedia.org/wiki/Medieval_Warm_Period
“The Medieval Warm Period was a time of warm weather around AD 800-1300 during the European Medieval period. Initial research on the MWP and the following Little Ice Age (LIA) was largely done in Europe, where the phenomenon was most obvious and clearly documented”
This period was also the lead-in to the Renaissnace
http://en.wikipedia.org/wiki/Renaissance
That most of us would admit was a pretty good time for culture and growth of humanity…
Now we have an anomaly. An anomaly to the cold side. We had the Little Ice Age. At about 1/2 the Bond Event cycle, it got cold. We don’t know if this was a 1/2 cycle sub oscillation or was the start of a drop into the next Bond Event and they onset with steps or waves, or just a continuation of the very long term drift to colder weather as we exit this interglacial. An anomaly to the cold side does not argue for warming happening (yet that is what the AGW folks do, but choosing a baseline at the bottom of the LIA).
The Little Ice Age that had a lot of trauma in the world (little things, like Napoleon discovering it was a bad time to invade Russia; and a wholesale emptying of Europe into the new world as they ran away from famine and cold; and the French Revolution when crops failed, and…) That was only a minor taste of what a Bond Event might be. The 178 ish year little brother cycle…
So what does all this mean to me?
This time is not different.
We are in a 10,000 year downward tilting slope into the next ice age.
We have a 1500 year climate cycle that can not be explained nor disappeared. It’s time to get cold. Very cold. And nobody knows why.
We had a preview of what’s to come in the LIA.
We are doing nothing to prepare.
The AGW folks are exactly backwards because they see too short a time frame. They are looking at a minor correction warmer from an unexpected cold interval in a longer term cold trend, and ignoring a proven 1500 year cycle and a 100,000 year glacial cycle.
So now we have the modern optimum. This time it will be different…
(BTW “It’s Different This Time!” is a standard stock traders sarchasm for the folly people regularly show in not learning from their history – It Is never different this time, ever.)
The only good news in all this is that it typically takes a while for empires to collapse and cultures to decay; and we have more technology with which to cope, when we finally realize we ought to be doing something other than watching entertainment and looking for a party. (Shades of Rome…)
So I am quietly hopeful that we can cope, given all the tools we have, and hopeful that the folly of AGW will be shown wrong rather soon; especially given all the snow that stacking up… I give it about 2 years minimum and 15 years maximum.
Then we can start building grain storage, expanding greenhouses, building more power plants, improving hydroponic infrastructure, putting desalination plants near deserts, etc. etc.
Climate is chaotic…..if we are to expect more snow in northern latitudes as some have been arguing today then the Arctic ice will remain and increase.
Polar bears will have plenty of places to play…….and Al Gore will finally be exposed.
It started as Global Warming…and as the temp leveled off and decreased became Climate Change…which is the norm.
Chaotic….
Flannagan please refer to Sun Cycles and have a long chat with a solar physicist like Piers Corbyn.
Flanagan (00:20:39) :
Graeme Rodaughan
Hotter polar regions means more melting AND more evaporation from the seas (even in the winter). So northern regions below the cloud level should undergo more precipitations (as opposed to very high mountains).
The situation is supposed to be different at the tropics and, for what I remember, some intertropical regions are supposed to become drier. Because of the wind patterns. This is all detailled in the IPCC assesment reports – which you should really read one day.
About the clouds: they play a double role. They can reflect part of the sun and altogether absorb IR coming from the surface. It all depends on their composition and/or color.
Flanagan.
[1] What would be the interpretation be “IF” the recent NH Winter had been mild with a light dusting of snow, and a bankrupt skiing industry in Europe and North America?
[2] What amount/coverage of NH Snow would constitute a “Natural” winter?
[3] I’m having trouble discovering the distinction between weather events that can be attributed to man made emissions of CO2 and those that are natural(?) – are you able to provide such a distinction based on measured events – and if not – how do you tell if man made emissions of CO2 are in fact impacting on the Planets Climate and Weather systems?
[4] Are you able to provide a “appropriate/desired” target level of NH Snow such that we can aim at reducing our CO2 emissions to create?
[5] What do you make of the fact that the last NH Summer melt (2008) of the Arctic was less (i.e. more ice left intact) than the previous big melt (2007) and yet both years had cold NH Summers with lots of snow. I.e. the arctic appears to be melting less – and yet there is more cold and snow. Yet you say more melting leads to more snow which contradicts the observations. – Could you please explain the discrepency?
Thanks. G
Pamela Gray sort of beat me to this but missed something.
The ice shelves are floating sea ice, attached at one end to land.
Simple mechanics says that as these shelves grow, the strains on the point of attachment will lead to breakage & therefore detachment. Where’s the problem? A piece of ice floating caused a stress fracture!
DaveE.
I had to laugh this morning, April 6th, when I awoke to find a foot of snow on the ground. I stopped laughing 3/4’s of an hour later when we lost power. It was restored 3 hours later for 15 min, then the second power out which has now just been fixed. I said I didn’t need any more Earth Hours. Trees are crashing all around the house, wet heavy snow will do that. I went out to shake off the forsythia which hasn’t bloomed yet, and I saw all the buds. There were buds, that is. I used to get a sunburn in April. Bring back global warming please.
Smokey (13:44:07) sez:
“DJ: ‘This is driven by global warming…’
Which begs the question: what drives global warming?”
Smokey, DJ said he saved $500 on his annual electric bill by changing to CFL’s. So maybe global warming is driven by the all the lightbulbs on the marquee at DJ’s Bijou Theater.
Meanwhile we have NatGeo, and your old buddy Dr. Meier, misrepresenting the trends of the arctic sea ice:
http://news.nationalgeographic.com/news/2009/04/090406-sea-ice-younger.html
Instead of highlighting the large year over year increase, they state:
“This winter’s maximum Arctic sea ice extent was 5.85 million square miles (15,150,000 square kilometers)—about 278,000 square miles (720,000 square kilometers) less than the Arctic average between 1979 and 2000. ”
On a related note: Good news! The Dow closed at 7976 today, which is 1743 over the average between 1979 and 2000!
More record cold is in the forecast for the middle of the USA tonight.
Steve (10:51:56) :
Couldn’t locate the comment you were responding to:
“Thicker ice, which survives two or more years, now comprises only 10 percent of wintertime arctic ice cover, down from 30 percent to 40 percent.”
Interesting application of AGW math. If I use the Roos ice data:
http://arctic-roos.org/observations/satellite-data/sea-ice/ice-area-and-extent-in-arctic
It shows winter high ice area at about 13 million sq. km peak and the summer low at 4 million sq. km. Now for all Warmists in the crowd, here’s where it get’s tough. To arrive at multi-year ice, divide the 4 million more than 1 year ice by the 13 million winter peak to arrive at your multi-year percentage. Enter your answer here _______. (Hint.. it’s not 10%)
AndrewWH (08:09:58) :
So where is the Wilkins Ice Sheet now?
Has it already melted and unleashed a wall of water to flatten coastal cities that is even now bearing down on us?
At his website, Jeff Id had some good photos from space over the recent past:
http://noconsensus.wordpress.com/2009/04/05/here-we-go-again/
We’d better get the entire US Navy down there to push this thing out to sea before the winter freeze up traps it and reattaches it to the ice shelf. DJ would be very disappointed.
Poor Flanagan has copped a bit of stick. Personally, I’d like to give my thanks to Flans: it was such an unexpected comment that it gave me a great laugh. Always a great way to start the day!
All I know is that winter is approaching in the Southern Hemisphere, and I’m looking forward to a good ski season. Since Global Warming causes more snow, I’ve voting for Global Warming. Can all you sceptics please keep quiet until summer starts up ‘cause I really want to give my new ski gear a run.
I’ve set my Model for snow this winter, and being a Model, it has to be right!
The official rate of sea level rise has just been downgraded from 3.3mm per year to 3.2mm per year.
http://sealevel.colorado.edu/current/sl_noib_ns_global.jpg
Must be all that rampant global warming that is accelerating faster than the models predicted.
Accelerated yes (i.e. changed) – but perhaps the sign of the acceleration (+ve/-ve) is in the wrong direction (once again…)