UPADATED AT 8:30AM PST Sept 2nd-
More on SIDC’s decision to count a sunspeck (technically a “pore”) days after the fact. NOAA has now followed SIDC in adding a 0.5 sunspot where there was none before. But as commenter Basil points out, SIDC’s own records are in contrast to their last minute decision to count the sunspeck or “pore” on August 21.
There is an archive of the daily SIDC “ursigrams” here:
http://sidc.oma.be/html/SWAPP/dailyreport/dailyreport.html
If you select the ursigrams for August 22 and 23, you get the reported data for the 21st and 22nd:
August 21:
TODAY’S ESTIMATED ISN : 000, BASED ON 07 STATIONS.
SOLAR INDICES FOR 21 Aug 2008
WOLF NUMBER CATANIA : 011
10CM SOLAR FLUX : 067
AK CHAMBON LA FORET : ///
AK WINGST : 004
ESTIMATED AP : 005
ESTIMATED ISN : 000, BASED ON 14 STATIONS.
August 22:
TODAY’S ESTIMATED ISN : 000, BASED ON 11 STATIONS.
SOLAR INDICES FOR 22 Aug 2008
WOLF NUMBER CATANIA : 013
10CM SOLAR FLUX : 068
AK CHAMBON LA FORET : ///
AK WINGST : 003
ESTIMATED AP : 003
ESTIMATED ISN : 000, BASED ON 11 STATIONS.
In both cases, the daily estimated “International Sunspot Number” based on multiple stations, not just the Catania Wolf Number, was 000. So how did SIDC end up with positive values in the monthly report?
UPDATED at 2:42 PM PST Sept 1st –
After going days without counting the August 21/22 “sunspeck” NOAA and SIDC Brussels now says it was NOT a spotless month! Both data sets below have been recently revised.
Here is the SIDC data:
http://www.sidc.be/products/ri_hemispheric/
Here is the NOAA data:
ftp://ftp.ngdc.noaa.gov/STP/SOLAR_DATA/SUNSPOT_NUMBERS/MONTHLY
The NOAA data shows July as 0.5 but they have not yet updated for August as SIDC has. SIDC reports 0.5 for August. It will be interesting to see what NOAA will do.
SIDC officially counted that sunspeck after all. It only took them a week to figure out if they were going to count it or not, since no number was assigned originally.
But there appears to be an error in the data from the one station that reported a spot, Catania, Italy. No other stations monitoring that day reported a spot. Here is the drawing from that Observatory:
ftp://ftp.ct.astro.it/sundraw/OAC_D_20080821_063500.jpg
ftp://ftp.ct.astro.it/sundraw/OAC_D_20080822_055000.jpg
But according to Leif Svalgaard, “SIDC reported a spot in the south, while the spot(s) Catania [reported] was in the north.” This is a puzzle. See his exchange below.
Also, other observatories show no spots at all. For example, at the 150 foot solar solar tower at the Mount Wilson Observatory, the drawings from those dates show no spots at all:
ftp://howard.astro.ucla.edu/pub/obs/drawings/dr080821.jpg
ftp://howard.astro.ucla.edu/pub/obs/drawings/dr080822.jpg
Inquires have been sent, stay tuned.
Here is an exchange in comments from Leif Svalgaard.
——-
REPLY: So What gives Leif….? You yourself said these sunspecks weren’t given a number. I trusted your assessment. Hence this article. Given the Brussels folks decided to change their minds later, what is the rationale ? – Anthony
The active region numbering is done by NOAA, not by Brussels. The Brussels folks occasionally disagree. In this case, they did. Rudolf Wolf would not have counted this spot. Nor would I. What puzzles me is this:
21 7 4 3
22 8 4 4
The 3rd column are ’spots’ in the Northern hemisphere, and the 4th column are ’spots’ in the Southern hemisphere [both weighted with the ‘k’-factor: SSN = k(10g+s)]. But there weren’t any in the south. The Catania spot was at 15 degrees north latitude, IIRC. Maybe the last word is not in on this.
——–
Hmm….apparently there’s some backstory to this. There is a debate raging in comments to this story, be sure to check them. – Anthony
# MONTHLY REPORT ON THE INTERNATIONAL SUNSPOT NUMBER #
# from the SIDC (RWC-Belgium) #
#——————————————————————–#
AUGUST 2008
PROVISIONAL INTERNATIONAL NORMALIZED HEMISPHERIC SUNSPOT NUMBERS
Date Ri Rn Rs
__________________________________________________________________
1 0 0 0
2 0 0 0
3 0 0 0
4 0 0 0
5 0 0 0
6 0 0 0
7 0 0 0
8 0 0 0
9 0 0 0
10 0 0 0
11 0 0 0
12 0 0 0
13 0 0 0
14 0 0 0
15 0 0 0
16 0 0 0
17 0 0 0
18 0 0 0
19 0 0 0
20 0 0 0
21 7 4 3
22 8 4 4
23 0 0 0
24 0 0 0
25 0 0 0
26 0 0 0
27 0 0 0
28 0 0 0
29 0 0 0
30 0 0 0
31 0 0 0
__________________________________________________________________
MONTHLY MEAN : 0.5 0.3 0.2
========================================================
ORIGINAL STORY FOLLOWS:
Many have been keeping a watchful eye on solar activity recently. The most popular thing to watch has been sunspots. While not a direct indication of solar activity, they are a proxy for the sun’s internal magnetic dynamo. There have been a number of indicators recently that it has been slowing down.
August 2008 has made solar history. As of 00 UTC (5PM PST) we just posted the first spotless calendar month since June 1913. Solar time is measured by Coordinated Universal Time (UTC) so it is now September 1st in UTC time. I’ve determined this to be the first spotless calendar month according to sunspot data from NOAA’s National Geophysical Data Center, which goes back to 1749. In the 95 years since 1913, we’ve had quite an active sun. But that has been changing in the last few years. The sun today is a nearly featureless sphere and has been for many days:

Image from SOHO
And there are other indicators. For example, some solar forecasts have been revised recently because the forecast models haven’t matched the observations. Australia’s space weather agency recently revised their solar cycle 24 forecast, pushing the expected date for a ramping up of cycle 24 sunspots into the future by six months.
The net effect of having no sunspots is about 0.1% drop in the TSI (Total Solar Irradiance). My view is that TSI alone isn’t the main factor in modulating Earth’s climate.
I think it’s solar magnetism modulating Galactic Cosmic Rays, and hence more cloud nuclei from GCR’s, per Svensmark’s theory. We’ve had indications since October 2005 that the sun’s dynamo is slowing down. It dropped significantly then, and has remained that way since. Seeing no sunpots now is another indicator of that idling dynamo.
Graph of solar Geomagnetic Index (Ap):

Click for a larger image
Earth of course is a big heat sink, so it takes awhile to catch up to any changes that originate on the sun, but temperature drops indicated by 4 global temperature metrics (UAH, RSS and to a lesser degree HadCrit and GISS) show a significant and sharp cooling in 2007 and 2008 that has not rebounded.In the 20 years since “global warming” started life as a public issue with Dr. James Hansen’s testimony before congress in June 1988, we are actually cooler.

Click for a larger image
Reference: UAH lower troposphere data
Coincidence? Possibly, but nature will be the final arbiter of climate change debate, and I think we would do well to listen to what it’s saying now.
Joe D’Aleo of ICECAP also wrote some interesting things which I’ll reprint here.
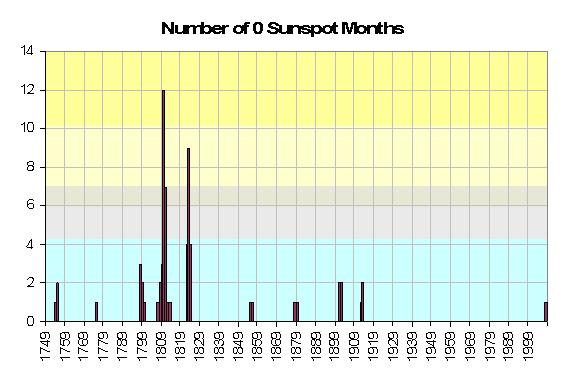
…we have had a 0 sunspot calendar month (there have been more 30 day intervals without sunspots as recent as 1954 but they have crossed months). Following is a plot of the number of months with 0 sunspots by year over the period of record – 23 cycles since 1749.
See larger image here.
Note that cluster of zero month years in the early 1800s (a very cold period called the Dalton minimum – at the time of Charles Dickens and snowy London town and including thanks to Tambora, the Year without a Summer 1816) and again to a lesser degree in the early 1900s. These correspond to the 106 and 213 year cycle minimums. This would suggest that the next cycle minimum around 2020 when both cycles are in phase at a minimum could be especially weak. Even David Hathaway of NASA who has been a believer in the cycle 24 peak being strong, thinks the next minimum and cycle 25 maximum could be the weakest in centuries based on slowdown of the plasma conveyor belt on the sun.
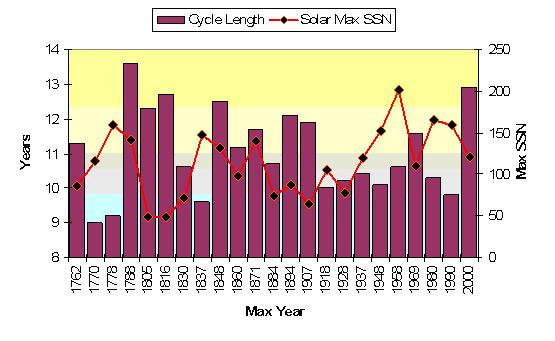
In this plot of the cycle lengths and sunspot number at peak of the cycles, assuming this upcoming cycle will begin in 2009 show the similarity of the recent cycles to cycle numbers 2- 4, two centuries ago preceding the Dalton Minimum. This cycle 23 could end up the longest since cycle 4, which had a similar size peak and also similarly, two prior short cycles.
See larger image here.


Will this mean anything for climate in our near future? Possibly. But we’ll have to wait to see how this experiment pans out.
I wanna see the sun
spotted up in the sky.
Not till the warmers are silenced.
BC, the main problem your ski resort will face in Florida isn’t lack of snow; it’s lack of mountains, hills, or even bumpy bits.
Robert, those deficiencies don’t stop them from skiing in Terre Haute, IN.
BC It never cease to amaze me how scientist types want the non-scientist types to carry their water for them. But as soon as the water turns to shit, they blame the water carrier for stinking up the place.
But if you want to abuse the water carrier, it is your prerogative.
I still like Al Gore though I now think that solar activity is the most likely cause of the warming of the 1900’s. I don’t think its Al’s fault that he trusted the wrong scientists or accepted the scientific “consensus.”
Or until the earth has been warm enough, and the sun quiet enough for long enough that the [snip] realise they have to find a new theory for why AGW is wrong.
David G. Mills says,
“I still like Al Gore though I now think that solar activity is the most likely cause of the warming of the 1900’s. I don’t think its Al’s fault that he trusted the wrong scientists or accepted the scientific “consensus.””
If it’s not Al Gore’s fault, whose is it? You or I didn’t jump to similar conclusions. He reached his level of incompetence long ago, and is apparently blissfully unaware of it. What’s more, he’s at the forefront of creating the “consensus” myth that you describe.
“statePoet1775 (19:28:30) :
Or how about Biden his time since he’s next in line?”
Okay, NOW you owe me a keyboard! (actually, you owe me a laptop. So much for drinking and reading this blog at the same time.) ::snort:: ROFL
” Bruce Cobb (19:34:29) :
Julie: I think “McOld” is hilarious. BTW, I voted for Gore in 2000. Now, I can’t stand him.”
Bruce, ME TOO. As late as 8 months ago I was wanting him (Gore) to run for Pres again and save the planet. Then I found WUWT, and that was THAT. Thank God for this blog!
What stops you people who defend Al Gore from noticing his massive level of “Do as I say, not as I do” hypocracy. His monthly electric bill for his Tenn. mansion would pay mine for 33 1/3 years. Plus his monster houseboat B.S. 1, plus his fleet of large vehicles, plus his private jet flights. He is the type specimen for: ‘I know he is lying, his lips are moving’.
evanjones (19:21:28) :
After all, when the carny sold you snake oil, you actually got the snake oil.
Amazingly apt criticism.
David G. Mills “I still like Al Gore though I now think that solar activity is the most likely cause of the warming of the 1900’s. I don’t think its Al’s fault that he trusted the wrong scientists or accepted the scientific “consensus.””
But please can I blame him for taking the Noble Peace Prize? Or at least not returning it now that he must know he was wrong?
[…] Read the story over at Watts Up With That… […]
All I can say from my deck on Vancouver Island is its been damned cold this summer. Right now its more like October than the end of August. But we were warned that global warming could cause global cooling, so I guess its still my fault. On the positive side, if this keeps up, we could be skiing much sooner. I drove up to the local ski resort today and it was a cool 10C. I’d like to say that this is not normal, but weather/climate is variable, at least here, so normal would seem to be whatever we have at the moment.
If the continuing lack of sun spots means cooler times ahead, then I’ll have to dig out that parka that I used to wear during Winnipeg winters.
Looking back to other “phase changes” its likely that the AGW crowd will just switch to AGCooling without skipping a beat. The media and their cast of supporting scientists have done it before.
For now, I’m reminded of a Beatles song, Here comes the sun.
Bruce, ME TOO. As late as 8 months ago I was wanting him (Gore) to run for Pres again and save the planet. Then I found WUWT, and that was THAT. Thank God for this blog!
Nobody beats the Rev!
I spotted both Gore and Clinton in 1984 as potentially good presidents. (But I had learned my lesson by the end of ’93.) By 2000 I had Pal Al sized up as a mouse studying to be a rat.
And I was highly prejudiced against global warming from the very getgo, what with being fresh off the resources debate, and the exact same damn dudes pushing GW that pushed the anti-growth movement.
Until recently, AGW believers and skeptics have been mostly aligned according to conservative/liberal affiliations. I think this is because most of the proponents have been liberal (certainly here in the US, the biggest proponent is a liberal) and conservatives are reacting to the solutions to AGW which generally are wealth redistribution schemes which go under various names such as Carbon Trading/Taxing/Caps.
In science, I am apolitical to AGW. Either it exists to a measurable/meaningful degree or it does not. I currently believe it does not exist in any meaningful manner.
I am sure it bothers many skeptics to be called ‘flat-earthers’ by the likes of John Kerry and other politicians who appear to lack even the most fundamental understanding of the science itself, but these are the slings and arrows of outrageous fortune.
We skeptics need to avoid being drawn into the politicization of climate change and stick to the science and the facts.
Joe D’Aleo wrote:
Even David Hathaway of NASA who has been a believer in the cycle 24 peak being strong, thinks the next minimum and cycle 25 maximum could be the weakest in centuries based on slowdown of the plasma conveyor belt on the sun.
Hathaway has shown a very poor [that is with low significance] correlation or relationship between observed cycle strength and conveyor belt speed [two cycles back]. The correlation is barely there and fails completely for cycle 19, the biggest of them all. Curiously, David has been an active supporter of the HAO dynamo model by Dikpati et al. This model and several similar models all predict [or actually use] just the opposite relationship, namely that a slow belt means a large cycle coming. The reason is obvious [even for people that are not dynamo experts], namely, that the longer the flux stays down below the tachocline [because of a slow circulation], the longer the dynamo process can operate on [i.e. amplify] the flux and the stronger will the cycle be. So, the dynamo models predicting a high cycle are consistent with the observed slow conveyor belt speed. So, a slowdown of the speed will signal a large cycle ahead according to these much heralded dynamo theories. It is, to me, strange that Hathaway thinks otherwise and yet actively promotes the Dikpati dynamo model. Wonders never cease.
Can someone please explain (in simple words that even I can understand) why the TSI varies only by very small amounts (did I read 0.2%) while individual wavelengths/bands like UV can vary by much more. I think I have seen reference to 5% or more.
The TSI seems to be a mechanism the AGW believers use to make it seem as if solar variation cannot be responsible for climate change.
John Riddell (22:58:33) :
Can someone please explain (in simple words that even I can understand) why the TSI varies only by very small amounts (did I read 0.2%) while individual wavelengths/bands like UV can vary by much more. I think I have seen reference to 5% or more.
This is because the UV is such a small part of the total. It is like the variation of the amount of loose change in your pocket compared to your net worth [or at least I hope so for you 🙂 ]
Anthony,
the year 1816, the year without summer: There occured a very big volcano eruption (Tambora in Indonesia) with about 100 km3 blown into the atmosphere, in 1815. This was on top of a low solar activity period.
Dr. Svalgaard,
in your post up above you say,
“Hathaway has shown a very poor [that is with low significance] correlation or relationship between observed cycle strength and conveyor belt speed [two cycles back]. The correlation is barely there and fails completely for cycle 19, the biggest of them all. Curiously, David has been an active supporter of the HAO dynamo model by Dikpati et al. This model and several similar models all predict [or actually use] just the opposite relationship, namely that a slow belt means a large cycle coming. The reason is obvious [even for people that are not dynamo experts], namely, that the longer the flux stays down below the tachocline [because of a slow circulation], the longer the dynamo process can operate on [i.e. amplify] the flux and the stronger will the cycle be. So, the dynamo models predicting a high cycle are consistent with the observed slow conveyor belt speed. So, a slowdown of the speed will signal a large cycle ahead according to these much heralded dynamo theories. It is, to me, strange that Hathaway thinks otherwise and yet actively promotes the Dikpati dynamo model. Wonders never cease.”
My question is, if cycle 24 is, as you think, a low activity cycle, will this completely negate the validity of the Dikpati dynamo model, or can it be tweaked somehow?
Kim
EvanJones “After all, when the carny sold you snake oil, you actually got the snake oil.”
They sure saw you coming! 😉
We mustn’t worry about the lack of sun spots. The weather in Boston is very fine.
Why do hotels in America only give you one tea bag? That is a much more worrying state of affairs than a lack of sunspots. It’s a good thing I brought over my own supply (tea bags, not sunspots).
A happy Labo(u)r Day to you all.
Weather anecdote:
Earliest ever recorded snowfall on Mt Fuji in Japan.
http://www.japantoday.com/category/national/view/snow-fell-on-mt-fuji-aug-9-at-earliest-time-ever
[Note: A single weather event is not an indication of climatic change]
Above link hat tip to:
http://klimakatastrophe.wordpress.com/
“Why do hotels in America only give you one tea bag?”
Boston? Tea?
‘Nuff said.
Leif Svalgaard (23:04:02) :
This is because the UV is such a small part of the total. It is like the variation of the amount of loose change in your pocket compared to your net worth [or at least I hope so for you 🙂
Hey isn’t loose change heavier than butterflies ! 🙂
UV may be small but it does have a significant effect in the stratosphere. the hard part is proving a link exists(or series of links).For a small force to have an impact it needs to act at a tipping point (gasp!) By this I’m talking about ball being balanced on a hill, with either side being a positive feedback, like for instance the neutral state of ENSO. Once the system gains inertia then the small forcing becomes irrelevant. Of course this smaller system can be part of a much larger system that undergoes stabilizing negative feedback. Like a hill in between two mountains. so how does the ball get back up the hill after it falls off? easy, all you need is some wobble at the right time, such as a man on a trapeze or a skateboarder in a bowl. Earth has at least two forms of wobble that can provide momentum, seasonal cycles and solar cycle oscillations.
Hey I have idea for a way to model for climate.
put a coin in bowl with an indentation in the middle and shake back and forwards! 🙂
I’m not sure that 0.1% is that insignificant in the long run (20 years).
Is my logic here somewhat correct?
The last I knew the earth was about 16 degrees Celsius or 289 Kelvin. Some of the heat comes from below ground but a boatload comes from the sun. The temperature of the Universe is about 3 degrees Kelvin. If the earth would be 3 degrees without the sun that means that a 0.1% variation would change the earth’s temperature by 0.286 degrees. If, without the sun the earth would be about 100 K a 0.1% variation would change the earth’s temperature by 0.189 degrees.
I know the continents, oceans and atmosphere has a tremendous amount of heat built in but in the long-term it shouldn’t matter.