UPADATED AT 8:30AM PST Sept 2nd-
More on SIDC’s decision to count a sunspeck (technically a “pore”) days after the fact. NOAA has now followed SIDC in adding a 0.5 sunspot where there was none before. But as commenter Basil points out, SIDC’s own records are in contrast to their last minute decision to count the sunspeck or “pore” on August 21.
There is an archive of the daily SIDC “ursigrams” here:
http://sidc.oma.be/html/SWAPP/dailyreport/dailyreport.html
If you select the ursigrams for August 22 and 23, you get the reported data for the 21st and 22nd:
August 21:
TODAY’S ESTIMATED ISN : 000, BASED ON 07 STATIONS.
SOLAR INDICES FOR 21 Aug 2008
WOLF NUMBER CATANIA : 011
10CM SOLAR FLUX : 067
AK CHAMBON LA FORET : ///
AK WINGST : 004
ESTIMATED AP : 005
ESTIMATED ISN : 000, BASED ON 14 STATIONS.
August 22:
TODAY’S ESTIMATED ISN : 000, BASED ON 11 STATIONS.
SOLAR INDICES FOR 22 Aug 2008
WOLF NUMBER CATANIA : 013
10CM SOLAR FLUX : 068
AK CHAMBON LA FORET : ///
AK WINGST : 003
ESTIMATED AP : 003
ESTIMATED ISN : 000, BASED ON 11 STATIONS.
In both cases, the daily estimated “International Sunspot Number” based on multiple stations, not just the Catania Wolf Number, was 000. So how did SIDC end up with positive values in the monthly report?
UPDATED at 2:42 PM PST Sept 1st –
After going days without counting the August 21/22 “sunspeck” NOAA and SIDC Brussels now says it was NOT a spotless month! Both data sets below have been recently revised.
Here is the SIDC data:
http://www.sidc.be/products/ri_hemispheric/
Here is the NOAA data:
ftp://ftp.ngdc.noaa.gov/STP/SOLAR_DATA/SUNSPOT_NUMBERS/MONTHLY
The NOAA data shows July as 0.5 but they have not yet updated for August as SIDC has. SIDC reports 0.5 for August. It will be interesting to see what NOAA will do.
SIDC officially counted that sunspeck after all. It only took them a week to figure out if they were going to count it or not, since no number was assigned originally.
But there appears to be an error in the data from the one station that reported a spot, Catania, Italy. No other stations monitoring that day reported a spot. Here is the drawing from that Observatory:
ftp://ftp.ct.astro.it/sundraw/OAC_D_20080821_063500.jpg
ftp://ftp.ct.astro.it/sundraw/OAC_D_20080822_055000.jpg
But according to Leif Svalgaard, “SIDC reported a spot in the south, while the spot(s) Catania [reported] was in the north.” This is a puzzle. See his exchange below.
Also, other observatories show no spots at all. For example, at the 150 foot solar solar tower at the Mount Wilson Observatory, the drawings from those dates show no spots at all:
ftp://howard.astro.ucla.edu/pub/obs/drawings/dr080821.jpg
ftp://howard.astro.ucla.edu/pub/obs/drawings/dr080822.jpg
Inquires have been sent, stay tuned.
Here is an exchange in comments from Leif Svalgaard.
——-
REPLY: So What gives Leif….? You yourself said these sunspecks weren’t given a number. I trusted your assessment. Hence this article. Given the Brussels folks decided to change their minds later, what is the rationale ? – Anthony
The active region numbering is done by NOAA, not by Brussels. The Brussels folks occasionally disagree. In this case, they did. Rudolf Wolf would not have counted this spot. Nor would I. What puzzles me is this:
21 7 4 3
22 8 4 4
The 3rd column are ’spots’ in the Northern hemisphere, and the 4th column are ’spots’ in the Southern hemisphere [both weighted with the ‘k’-factor: SSN = k(10g+s)]. But there weren’t any in the south. The Catania spot was at 15 degrees north latitude, IIRC. Maybe the last word is not in on this.
——–
Hmm….apparently there’s some backstory to this. There is a debate raging in comments to this story, be sure to check them. – Anthony
# MONTHLY REPORT ON THE INTERNATIONAL SUNSPOT NUMBER #
# from the SIDC (RWC-Belgium) #
#——————————————————————–#
AUGUST 2008
PROVISIONAL INTERNATIONAL NORMALIZED HEMISPHERIC SUNSPOT NUMBERS
Date Ri Rn Rs
__________________________________________________________________
1 0 0 0
2 0 0 0
3 0 0 0
4 0 0 0
5 0 0 0
6 0 0 0
7 0 0 0
8 0 0 0
9 0 0 0
10 0 0 0
11 0 0 0
12 0 0 0
13 0 0 0
14 0 0 0
15 0 0 0
16 0 0 0
17 0 0 0
18 0 0 0
19 0 0 0
20 0 0 0
21 7 4 3
22 8 4 4
23 0 0 0
24 0 0 0
25 0 0 0
26 0 0 0
27 0 0 0
28 0 0 0
29 0 0 0
30 0 0 0
31 0 0 0
__________________________________________________________________
MONTHLY MEAN : 0.5 0.3 0.2
========================================================
ORIGINAL STORY FOLLOWS:
Many have been keeping a watchful eye on solar activity recently. The most popular thing to watch has been sunspots. While not a direct indication of solar activity, they are a proxy for the sun’s internal magnetic dynamo. There have been a number of indicators recently that it has been slowing down.
August 2008 has made solar history. As of 00 UTC (5PM PST) we just posted the first spotless calendar month since June 1913. Solar time is measured by Coordinated Universal Time (UTC) so it is now September 1st in UTC time. I’ve determined this to be the first spotless calendar month according to sunspot data from NOAA’s National Geophysical Data Center, which goes back to 1749. In the 95 years since 1913, we’ve had quite an active sun. But that has been changing in the last few years. The sun today is a nearly featureless sphere and has been for many days:

Image from SOHO
And there are other indicators. For example, some solar forecasts have been revised recently because the forecast models haven’t matched the observations. Australia’s space weather agency recently revised their solar cycle 24 forecast, pushing the expected date for a ramping up of cycle 24 sunspots into the future by six months.
The net effect of having no sunspots is about 0.1% drop in the TSI (Total Solar Irradiance). My view is that TSI alone isn’t the main factor in modulating Earth’s climate.
I think it’s solar magnetism modulating Galactic Cosmic Rays, and hence more cloud nuclei from GCR’s, per Svensmark’s theory. We’ve had indications since October 2005 that the sun’s dynamo is slowing down. It dropped significantly then, and has remained that way since. Seeing no sunpots now is another indicator of that idling dynamo.
Graph of solar Geomagnetic Index (Ap):

Click for a larger image
Earth of course is a big heat sink, so it takes awhile to catch up to any changes that originate on the sun, but temperature drops indicated by 4 global temperature metrics (UAH, RSS and to a lesser degree HadCrit and GISS) show a significant and sharp cooling in 2007 and 2008 that has not rebounded.In the 20 years since “global warming” started life as a public issue with Dr. James Hansen’s testimony before congress in June 1988, we are actually cooler.

Click for a larger image
Reference: UAH lower troposphere data
Coincidence? Possibly, but nature will be the final arbiter of climate change debate, and I think we would do well to listen to what it’s saying now.
Joe D’Aleo of ICECAP also wrote some interesting things which I’ll reprint here.
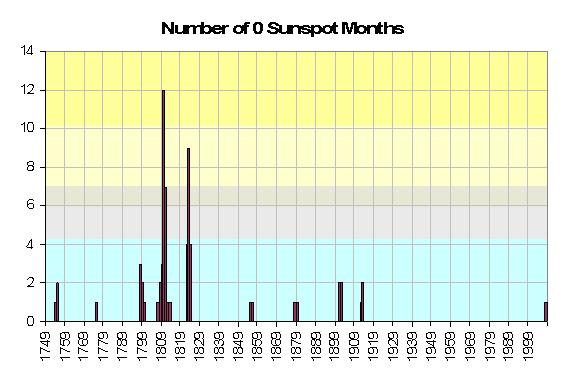
…we have had a 0 sunspot calendar month (there have been more 30 day intervals without sunspots as recent as 1954 but they have crossed months). Following is a plot of the number of months with 0 sunspots by year over the period of record – 23 cycles since 1749.
See larger image here.
Note that cluster of zero month years in the early 1800s (a very cold period called the Dalton minimum – at the time of Charles Dickens and snowy London town and including thanks to Tambora, the Year without a Summer 1816) and again to a lesser degree in the early 1900s. These correspond to the 106 and 213 year cycle minimums. This would suggest that the next cycle minimum around 2020 when both cycles are in phase at a minimum could be especially weak. Even David Hathaway of NASA who has been a believer in the cycle 24 peak being strong, thinks the next minimum and cycle 25 maximum could be the weakest in centuries based on slowdown of the plasma conveyor belt on the sun.
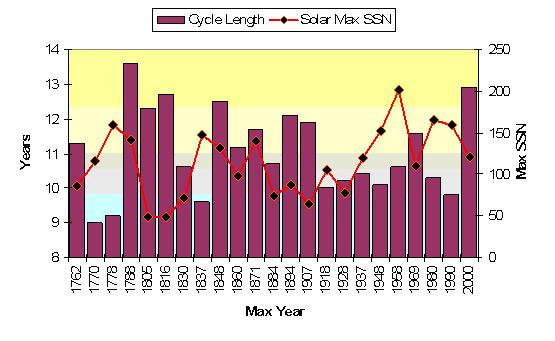
In this plot of the cycle lengths and sunspot number at peak of the cycles, assuming this upcoming cycle will begin in 2009 show the similarity of the recent cycles to cycle numbers 2- 4, two centuries ago preceding the Dalton Minimum. This cycle 23 could end up the longest since cycle 4, which had a similar size peak and also similarly, two prior short cycles.
See larger image here.


Will this mean anything for climate in our near future? Possibly. But we’ll have to wait to see how this experiment pans out.
Glen,
Here is another set of temp records that shows the SM warming:
http://www.climateaudit.org/wp-images/brif2034.gif
Compare the SM with the MWP that shows similar warming.
It is from http://www.climateaudit.org/?p=3608
[…] August, there were no sunspotgroups numbered by NOAA. However, on 21-22 August “something” was visible well enough to be seen by several observers and to prompt the SIDC to give a (preliminary) non-zero […]
What the hell?!
We pollute the earth and now we pollute the sun?
It has to be because the pollution we made here is going to space and to the sun. This is disastrous!
I think this is the begining of our ending.