UPADATED AT 8:30AM PST Sept 2nd-
More on SIDC’s decision to count a sunspeck (technically a “pore”) days after the fact. NOAA has now followed SIDC in adding a 0.5 sunspot where there was none before. But as commenter Basil points out, SIDC’s own records are in contrast to their last minute decision to count the sunspeck or “pore” on August 21.
There is an archive of the daily SIDC “ursigrams” here:
http://sidc.oma.be/html/SWAPP/dailyreport/dailyreport.html
If you select the ursigrams for August 22 and 23, you get the reported data for the 21st and 22nd:
August 21:
TODAY’S ESTIMATED ISN : 000, BASED ON 07 STATIONS.
SOLAR INDICES FOR 21 Aug 2008
WOLF NUMBER CATANIA : 011
10CM SOLAR FLUX : 067
AK CHAMBON LA FORET : ///
AK WINGST : 004
ESTIMATED AP : 005
ESTIMATED ISN : 000, BASED ON 14 STATIONS.
August 22:
TODAY’S ESTIMATED ISN : 000, BASED ON 11 STATIONS.
SOLAR INDICES FOR 22 Aug 2008
WOLF NUMBER CATANIA : 013
10CM SOLAR FLUX : 068
AK CHAMBON LA FORET : ///
AK WINGST : 003
ESTIMATED AP : 003
ESTIMATED ISN : 000, BASED ON 11 STATIONS.
In both cases, the daily estimated “International Sunspot Number” based on multiple stations, not just the Catania Wolf Number, was 000. So how did SIDC end up with positive values in the monthly report?
UPDATED at 2:42 PM PST Sept 1st –
After going days without counting the August 21/22 “sunspeck” NOAA and SIDC Brussels now says it was NOT a spotless month! Both data sets below have been recently revised.
Here is the SIDC data:
http://www.sidc.be/products/ri_hemispheric/
Here is the NOAA data:
ftp://ftp.ngdc.noaa.gov/STP/SOLAR_DATA/SUNSPOT_NUMBERS/MONTHLY
The NOAA data shows July as 0.5 but they have not yet updated for August as SIDC has. SIDC reports 0.5 for August. It will be interesting to see what NOAA will do.
SIDC officially counted that sunspeck after all. It only took them a week to figure out if they were going to count it or not, since no number was assigned originally.
But there appears to be an error in the data from the one station that reported a spot, Catania, Italy. No other stations monitoring that day reported a spot. Here is the drawing from that Observatory:
ftp://ftp.ct.astro.it/sundraw/OAC_D_20080821_063500.jpg
ftp://ftp.ct.astro.it/sundraw/OAC_D_20080822_055000.jpg
But according to Leif Svalgaard, “SIDC reported a spot in the south, while the spot(s) Catania [reported] was in the north.” This is a puzzle. See his exchange below.
Also, other observatories show no spots at all. For example, at the 150 foot solar solar tower at the Mount Wilson Observatory, the drawings from those dates show no spots at all:
ftp://howard.astro.ucla.edu/pub/obs/drawings/dr080821.jpg
ftp://howard.astro.ucla.edu/pub/obs/drawings/dr080822.jpg
Inquires have been sent, stay tuned.
Here is an exchange in comments from Leif Svalgaard.
——-
REPLY: So What gives Leif….? You yourself said these sunspecks weren’t given a number. I trusted your assessment. Hence this article. Given the Brussels folks decided to change their minds later, what is the rationale ? – Anthony
The active region numbering is done by NOAA, not by Brussels. The Brussels folks occasionally disagree. In this case, they did. Rudolf Wolf would not have counted this spot. Nor would I. What puzzles me is this:
21 7 4 3
22 8 4 4
The 3rd column are ’spots’ in the Northern hemisphere, and the 4th column are ’spots’ in the Southern hemisphere [both weighted with the ‘k’-factor: SSN = k(10g+s)]. But there weren’t any in the south. The Catania spot was at 15 degrees north latitude, IIRC. Maybe the last word is not in on this.
——–
Hmm….apparently there’s some backstory to this. There is a debate raging in comments to this story, be sure to check them. – Anthony
# MONTHLY REPORT ON THE INTERNATIONAL SUNSPOT NUMBER #
# from the SIDC (RWC-Belgium) #
#——————————————————————–#
AUGUST 2008
PROVISIONAL INTERNATIONAL NORMALIZED HEMISPHERIC SUNSPOT NUMBERS
Date Ri Rn Rs
__________________________________________________________________
1 0 0 0
2 0 0 0
3 0 0 0
4 0 0 0
5 0 0 0
6 0 0 0
7 0 0 0
8 0 0 0
9 0 0 0
10 0 0 0
11 0 0 0
12 0 0 0
13 0 0 0
14 0 0 0
15 0 0 0
16 0 0 0
17 0 0 0
18 0 0 0
19 0 0 0
20 0 0 0
21 7 4 3
22 8 4 4
23 0 0 0
24 0 0 0
25 0 0 0
26 0 0 0
27 0 0 0
28 0 0 0
29 0 0 0
30 0 0 0
31 0 0 0
__________________________________________________________________
MONTHLY MEAN : 0.5 0.3 0.2
========================================================
ORIGINAL STORY FOLLOWS:
Many have been keeping a watchful eye on solar activity recently. The most popular thing to watch has been sunspots. While not a direct indication of solar activity, they are a proxy for the sun’s internal magnetic dynamo. There have been a number of indicators recently that it has been slowing down.
August 2008 has made solar history. As of 00 UTC (5PM PST) we just posted the first spotless calendar month since June 1913. Solar time is measured by Coordinated Universal Time (UTC) so it is now September 1st in UTC time. I’ve determined this to be the first spotless calendar month according to sunspot data from NOAA’s National Geophysical Data Center, which goes back to 1749. In the 95 years since 1913, we’ve had quite an active sun. But that has been changing in the last few years. The sun today is a nearly featureless sphere and has been for many days:

Image from SOHO
And there are other indicators. For example, some solar forecasts have been revised recently because the forecast models haven’t matched the observations. Australia’s space weather agency recently revised their solar cycle 24 forecast, pushing the expected date for a ramping up of cycle 24 sunspots into the future by six months.
The net effect of having no sunspots is about 0.1% drop in the TSI (Total Solar Irradiance). My view is that TSI alone isn’t the main factor in modulating Earth’s climate.
I think it’s solar magnetism modulating Galactic Cosmic Rays, and hence more cloud nuclei from GCR’s, per Svensmark’s theory. We’ve had indications since October 2005 that the sun’s dynamo is slowing down. It dropped significantly then, and has remained that way since. Seeing no sunpots now is another indicator of that idling dynamo.
Graph of solar Geomagnetic Index (Ap):

Click for a larger image
Earth of course is a big heat sink, so it takes awhile to catch up to any changes that originate on the sun, but temperature drops indicated by 4 global temperature metrics (UAH, RSS and to a lesser degree HadCrit and GISS) show a significant and sharp cooling in 2007 and 2008 that has not rebounded.In the 20 years since “global warming” started life as a public issue with Dr. James Hansen’s testimony before congress in June 1988, we are actually cooler.

Click for a larger image
Reference: UAH lower troposphere data
Coincidence? Possibly, but nature will be the final arbiter of climate change debate, and I think we would do well to listen to what it’s saying now.
Joe D’Aleo of ICECAP also wrote some interesting things which I’ll reprint here.
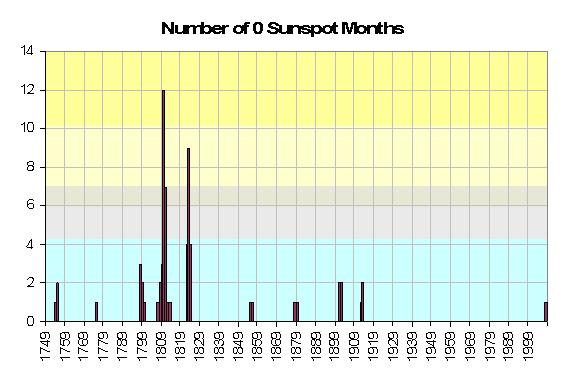
…we have had a 0 sunspot calendar month (there have been more 30 day intervals without sunspots as recent as 1954 but they have crossed months). Following is a plot of the number of months with 0 sunspots by year over the period of record – 23 cycles since 1749.
See larger image here.
Note that cluster of zero month years in the early 1800s (a very cold period called the Dalton minimum – at the time of Charles Dickens and snowy London town and including thanks to Tambora, the Year without a Summer 1816) and again to a lesser degree in the early 1900s. These correspond to the 106 and 213 year cycle minimums. This would suggest that the next cycle minimum around 2020 when both cycles are in phase at a minimum could be especially weak. Even David Hathaway of NASA who has been a believer in the cycle 24 peak being strong, thinks the next minimum and cycle 25 maximum could be the weakest in centuries based on slowdown of the plasma conveyor belt on the sun.
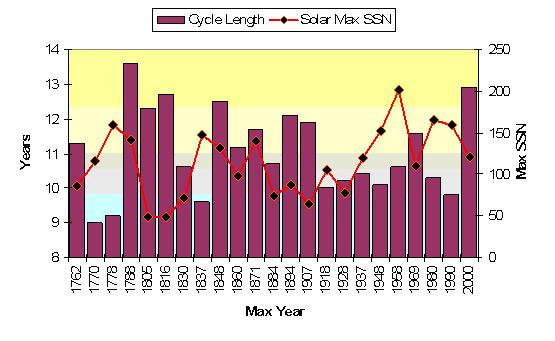
In this plot of the cycle lengths and sunspot number at peak of the cycles, assuming this upcoming cycle will begin in 2009 show the similarity of the recent cycles to cycle numbers 2- 4, two centuries ago preceding the Dalton Minimum. This cycle 23 could end up the longest since cycle 4, which had a similar size peak and also similarly, two prior short cycles.
See larger image here.


Will this mean anything for climate in our near future? Possibly. But we’ll have to wait to see how this experiment pans out.
not sure about the “historic proportions” but sure it does look like a different one than the previous 8 cycles…
http://users.telenet.be/j.janssens/Spotless/Spotlessevolution.png
http://users.telenet.be/j.janssens/Spotless/Spotlessallcycles.png
Historic? It certainly does looks like it. Climate-altering? May be, or may not.
There must be a middle way between absurdist claims of the world going to be shattered, and tut-tutting
omnologos (15:51:23) :
not sure about the “historic proportions” but sure it does look like a different one than the previous 8 cycles…
http://users.telenet.be/j.janssens/Spotless/Spotlessevolution.png
If you look closely, you can see the blue line having light blue, dashed lines on either side, and the red line having pink, dashed lines on either side. These are ‘uncertainty’ bands. The green curve is squarely inside both dashed bands and there is therefore no statistically significant ground for saying that the green belongs with the red or with the blue. Hence, the current situation is very much within the normal variation and is not unusual at all.
[…] the back-and-forth revelations about August 2008 being spotless for the whole of humanity apart from one observer in Ca…, whose keen eye has made both SIDC and NOAA change their mind, a friend pointed me in the direction […]
I knew such a comment would be coming and that’s why I posted the link to the second graph too.
I agree that there is nothing yet to shout about. But of cycles 16 to 23 the one most resembling 24 is 18, and higher than that there’s only 16 and 17.
Also look how the curves peaked at an ever lower level between 16 and 23 (I may be confused by the various colors there but the statement before is generally true if I am not mistaken).
Cycle 24 is “historic” in the sense that it has reversed the downward trend. By how much? And should we care? I do not know. Let’s see how it evolves.
When there will be more data, we will be able to claim if the variation is “normal” nor not. But for now, is silence the only option?
By the way: I just published a blog with links to two PSPT solar picture archives.
For that blog I have extracted the pictures from Aug 21-22 showing how activity was indeed visible, but not exactly to the human eye…
omnologos (16:51:25) :
Cycle 24 is “historic” in the sense that it has reversed the downward trend. By how much? And should we care? I do not know. Let’s see how it evolves.
Be sure not to conflate high and low. The graphs show days with no spots, hence going high means lower activity. You say that cycle 24 most resembles cycle 18. Cycle 18 was one of most active cycles observed, rivaling cycles 21 and 22. So, will cycle 24 be a high cycle or a low cycle?
Leif Svalgaard (14:52:37) :
“…Indeed, Dr. Phillips is right on.”
subject to “re-thinking,” as he says
“…If the sun remains blank for another year, it’s time to re-think our assurances, but for now, all is well.”
I wonder why Dr. Phillips would say this…
Surely, whether Cycle 23 is 12 years, 13 years, or umpteen years, all is well.
Surely if Cycle 24 never produces another spot, all is well.
What difference would it make, other than for purely academic and aesthetic interests?
Why would any assurances need to be re-thought?
Is he talking about assurances to satellite operators? To NASA astronauts? To ham radio operators? To astronomers? To whom?
Who is being assured of what, and what will they or we be assured of if the assurances are re-thought?
Does Dr. Phillips KNOW all is well, or does Dr. Phillips HOPE all is well?
Geez, I know I’m reading too much into this, but now I’m worried – what is it that is going to become – UNWELL –
“…If the sun remains blank for another year…”
?
JohnX,
Those are some really good questions. I hope Leif takes a shot at them.
John-X (19:13:59) :
Leif Svalgaard (14:52:37) : “…Indeed, Dr. Phillips is right on.”
subject to “re-thinking,” as he says
That is just CYA-stuff.
“…If the sun remains blank for another year…”
I would actually welcome a blank Sun for a couple of decades. that would allow us to test our understanding of solar physics by providing us with the ‘ground-state’ of the system Many nonsensical notions would be cleared away…
Don’t be afraid of another LIA. The Spoerer solar minimum was deeper than the Maunder minimum, and yet the temperature was high.
Leif Svalgaard (17:19:27) :
You say that cycle 24 most resembles cycle 18. Cycle 18 was one of most active cycles observed, rivaling cycles 21 and 22. So, will cycle 24 be a high cycle or a low cycle?
most interesting times indeed, we are living
Maurizio Morabito says.
Apologies if this has already been pointed out. Some sunspots appear to be much easier to identify if the “correct” filters are used during observation.
Could I ask if these same filters were used in the early 1800`s or before.
If modern observations are to be compared with historical ones should not historical equipment be used in tandem with modern equipment, this all reminds me of the increase in hurricanes in recent years, better equipment = more hurricanes.
Another question…if the G-band (C) filter is used to identify sunspots more easily:
then what should one make of the quite-low contrast feature visible on Aug 21? Or is that the definition of a “pore”?
just asking
Rob (06:03:14) :
omnologos (06:25:48) :
about newer technology for detection of spots
Solar physicists are [and have long been] keenly aware of the issues stemming from improved techniques, and have tried their best to correct for them such as to preserve the uniform calibration of the sunspot series. Much of the discussion about this centers on how good those corrections are. The effect of solar activity on the Earth’s ionosphere and the subsequent geomagnetic response is independent of our improving technology, as the response is of the order of 5-10 minutes of arc, which has been achievable since the 18th century. So there is a direct and technology-independent way of calibrating the solar observations.
NEWS
NOAA SWPC (Space Weather Prediction Center) Solar Cycle progression page (graphs) updated with data through August 31
http://www.swpc.noaa.gov/SolarCycle/
Leif Svalgaard (20:04:23) :
“…Don’t be afraid of another LIA…”
Hey, who’s afraid?
Without the Little Ice Age, ice skates may not have been invented.
No ice skates, no hockey.
No hockey, no hockey moms.
I say L.I.A. NOW!
“I’ll be glad to spread some light in the darkness.”
Oh, dear, me lead? Again toss questions into the abyss?
Ok, new queries only.
What does one hope to gain linearly regressing non-linear functions? Are the non-linear functions, in fact, colinear?
Why then cast about for the best fit for a slope coefficient?
Why is using smoothed data tenable? Does it have anything to do with the foregoing issues?
What kind of noise are you eradicating with the lost data, white, brown, red,…?
“Solar Cycle progression page (graphs)”
What an improbable turn the Sun is about to take! Surely it’ll black out from the excessive G-force.
Gary Gulrud (14:37:42) :
Oh, dear, me lead? Again toss questions into the abyss?
Ok, new queries only.
You will have to be specific [data, paper, equation, …], otherwise they are just going into the abyss.
Leif “The Spoerer solar minimum was deeper than the Maunder minimum, and yet the temperature was high.”
How do you figure that, and where was the temperature “high”?
The Spoerer Minimum is said to have occured 1415–1534 A.D.
From Wiki:
“Starting in the 13th century, pack ice began advancing southwards in the North Atlantic, as did glaciers in Greenland. The three years of torrential rains beginning in 1315 ushered in an era of unpredictable weather in Northern Europe which did not lift until the 19th century. There is anecdotal evidence of expanding glaciers almost worldwide. In contrast, a climate reconstruction based on glacial length[3] shows no great variation from 1600 to 1850, though it shows strong retreat thereafter.
For this reason, any of several dates ranging over 400 years may indicate the beginning of the Little Ice Age:
1250 for when Atlantic pack ice began to grow
1300 for when warm summers stopped being dependable in Northern Europe
1315 for the rains and Great Famine of 1315-1317
1550 for theorized beginning of worldwide glacial expansion
1650 for the first climatic minimum”
http://en.wikipedia.org/wiki/Little_Ice_Age
Leif “The Spoerer solar minimum was deeper than the Maunder minimum, and yet the temperature was high.”
How do you figure that, and where was the temperature “high”?
Now what has the Spoerer minimum to do with your ill-befitting high-brow previous lament:
What does one hope to gain linearly regressing non-linear functions? Are the non-linear functions, in fact, colinear?
Why then cast about for the best fit for a slope coefficient?
Why is using smoothed data tenable? Does it have anything to do with the foregoing issues?
What kind of noise are you eradicating with the lost data, white, brown, red,…?
But let that slide. Now for the Spoerer minimum.
If we assume that solar activity modulates GCRs, then we can use 10Be and 14C to gauge the depth of the minima, that’s how we know their relative depths. At http://www.leif.org/research/TSI%20From%20McCracken%20HMF.pdf page 2 you can see for your self. Please do not get distracted by the calibration error around 1950. It does not alter the relative depths of the Spoerer and Maunder minima.
You may assume, that when I make a statement that the Spoerer minimum was deeper, that in fact it was [to the best of the evidence].
Now about the temperature. Temperature reconstructions are difficult to get correct because of the determined effort of some to produce a hockey stick. An important series of data that has recently become available suggests the following reconstruction:
http://www.climateaudit.org/wp-content/uploads/2008/07/tornet78.gif
You can follow the long discussion of this on climateaudit.
Leif,
So the Spoerer minimum (1415–1534 A.D.) was “deep”. As to temperatures as you say being “high”, I find the unequivocal statement to be a little bold in light of the fact, as you say, reconstructions being “difficult”. Yet Mann’s Hockey stick shows a considerable drop around 1400 -1600 AD, and then there is the historical evidence of climate change to the colder and wetter at least in the northern hemisphere. It follows the medieval warm period: “Medieval Warm Period was a time of warm weather around 800-1300 AD during the European Medieval period. Initial research on the MWP and the following Little Ice Age (LIA) was largely done in Europe, where the phenomenon was most obvious and clearly documented.”
http://en.wikipedia.org/wiki/Medieval_Warm_Period
Funny that AGWers talk down regional changes as if they aren’t the result of global changes, yet when something happens regionally, as in the Arctic melt, it’s said to be part of global climate change.
But to get back on track, I’ll ask again, what makes you so sure that at the time of the Spoerer Minimum temperatures were “high”, and where were they “high”?
Glenn (16:08:58) :
then there is the historical evidence of climate change to the colder and wetter at least in the northern hemisphere.
The evidence you cited:
1250 for when Atlantic pack ice began to grow
1300 for when warm summers stopped being dependable in Northern Europe
1315 for the rains and Great Famine of 1315-1317
[…here is the Spoerer minimum…, no mention of cold…]
1550 for theorized beginning of worldwide glacial expansion
1650 for the first climatic minimum
notes cold periods before and after the SM, but not during, consistent with the Tornetraesk [Northern Europe] graph I referred you to [did you look at it?].
A global perspective [albeit with poorer time resolution] comes from analysis of 20,000 boreholes all over the world. You can read about it here “Huang, S. P., H. N. Pollack, and P.-Y. Shen
A late Quaternary climate reconstruction based on borehole heat flux data, borehole temperature data, and the instrumental recordGeophys. Res. Lett., 35, L13703, doi:10.1029/2008GL034187. 4 July 2008
or just look at their main Figure here: http://www.leif.org/research/T-Boreholes.png
It shows that the little Ice age did not start before 1500. You see, when I make statements they are backed by evidence from scientific papers that I have read carefully [not Wikipedia]. As with all reconstructions there are always uncertainties, but they work both ways. You might as well doubt that it was cold during the SM since [as you claim] the data is so poor.
Another reference:
Phenological data series of cherry tree flowering in Kyoto, Japan, and its application to reconstruction of springtime temperatures since the 9th century by Yasuyuki Aono *, Keiko Kazui
has this:
ABSTRACT
Changes in springtime temperature in Kyoto, Japan, since the 9th century were reconstructed, using the phenological data series for cherry tree (Prunus jamasakura), deduced from old diaries and chronicles. Phenological data for 732 years was made available by combining data from previous studies. The full-flowering date of cherry trees fluctuates in accordance with temperature conditions during February and March.[…] Calibration enabled accurate estimation of temperatures in the instrumental period, after 1880; the root mean square error (RMSE) of temperature estimates was determined to be within 0.1 °C, after smoothing by local linear regression over time spans of 31 years. The results suggested the existence of four cold periods, 1330-1350, [Spoerer minimum here], 1520-1550, 1670-1700, and 1825-1830, during which periods the estimated March mean temperature was 4-5 °C, about 3-4 °C lower than the present normal temperature[…].
Again showing that there was no dramatic cooling in Japan during the SM. It would seem that the notion that Grand Solar Minima’s connection with cold climate is not well founded.
—
As I have said, you may assume that I know what I’m talking about when I make statements. Of course, ‘know’ is a big word, so should always be interpreted as ‘as far as I can tell from the evidence’.
Leif, In your last post you have me confused with Gary Galrud, although I may be guilty as well of “ill-befitting high-brow previous lament”.
Glenn: I forgot the reference: “International Journal of Climatology, Volume 28 Issue 7, Pages 905 – 914, 1 Aug 2007, DOI: 10.1002/joc.1594. Do me the favor of reading it.
Hmm. I had thought the Greenland colonies were hulled in well before 1500. Am I mistaken?