UPADATED AT 8:30AM PST Sept 2nd-
More on SIDC’s decision to count a sunspeck (technically a “pore”) days after the fact. NOAA has now followed SIDC in adding a 0.5 sunspot where there was none before. But as commenter Basil points out, SIDC’s own records are in contrast to their last minute decision to count the sunspeck or “pore” on August 21.
There is an archive of the daily SIDC “ursigrams” here:
http://sidc.oma.be/html/SWAPP/dailyreport/dailyreport.html
If you select the ursigrams for August 22 and 23, you get the reported data for the 21st and 22nd:
August 21:
TODAY’S ESTIMATED ISN : 000, BASED ON 07 STATIONS.
SOLAR INDICES FOR 21 Aug 2008
WOLF NUMBER CATANIA : 011
10CM SOLAR FLUX : 067
AK CHAMBON LA FORET : ///
AK WINGST : 004
ESTIMATED AP : 005
ESTIMATED ISN : 000, BASED ON 14 STATIONS.
August 22:
TODAY’S ESTIMATED ISN : 000, BASED ON 11 STATIONS.
SOLAR INDICES FOR 22 Aug 2008
WOLF NUMBER CATANIA : 013
10CM SOLAR FLUX : 068
AK CHAMBON LA FORET : ///
AK WINGST : 003
ESTIMATED AP : 003
ESTIMATED ISN : 000, BASED ON 11 STATIONS.
In both cases, the daily estimated “International Sunspot Number” based on multiple stations, not just the Catania Wolf Number, was 000. So how did SIDC end up with positive values in the monthly report?
UPDATED at 2:42 PM PST Sept 1st –
After going days without counting the August 21/22 “sunspeck” NOAA and SIDC Brussels now says it was NOT a spotless month! Both data sets below have been recently revised.
Here is the SIDC data:
http://www.sidc.be/products/ri_hemispheric/
Here is the NOAA data:
ftp://ftp.ngdc.noaa.gov/STP/SOLAR_DATA/SUNSPOT_NUMBERS/MONTHLY
The NOAA data shows July as 0.5 but they have not yet updated for August as SIDC has. SIDC reports 0.5 for August. It will be interesting to see what NOAA will do.
SIDC officially counted that sunspeck after all. It only took them a week to figure out if they were going to count it or not, since no number was assigned originally.
But there appears to be an error in the data from the one station that reported a spot, Catania, Italy. No other stations monitoring that day reported a spot. Here is the drawing from that Observatory:
ftp://ftp.ct.astro.it/sundraw/OAC_D_20080821_063500.jpg
ftp://ftp.ct.astro.it/sundraw/OAC_D_20080822_055000.jpg
But according to Leif Svalgaard, “SIDC reported a spot in the south, while the spot(s) Catania [reported] was in the north.” This is a puzzle. See his exchange below.
Also, other observatories show no spots at all. For example, at the 150 foot solar solar tower at the Mount Wilson Observatory, the drawings from those dates show no spots at all:
ftp://howard.astro.ucla.edu/pub/obs/drawings/dr080821.jpg
ftp://howard.astro.ucla.edu/pub/obs/drawings/dr080822.jpg
Inquires have been sent, stay tuned.
Here is an exchange in comments from Leif Svalgaard.
——-
REPLY: So What gives Leif….? You yourself said these sunspecks weren’t given a number. I trusted your assessment. Hence this article. Given the Brussels folks decided to change their minds later, what is the rationale ? – Anthony
The active region numbering is done by NOAA, not by Brussels. The Brussels folks occasionally disagree. In this case, they did. Rudolf Wolf would not have counted this spot. Nor would I. What puzzles me is this:
21 7 4 3
22 8 4 4
The 3rd column are ’spots’ in the Northern hemisphere, and the 4th column are ’spots’ in the Southern hemisphere [both weighted with the ‘k’-factor: SSN = k(10g+s)]. But there weren’t any in the south. The Catania spot was at 15 degrees north latitude, IIRC. Maybe the last word is not in on this.
——–
Hmm….apparently there’s some backstory to this. There is a debate raging in comments to this story, be sure to check them. – Anthony
# MONTHLY REPORT ON THE INTERNATIONAL SUNSPOT NUMBER #
# from the SIDC (RWC-Belgium) #
#——————————————————————–#
AUGUST 2008
PROVISIONAL INTERNATIONAL NORMALIZED HEMISPHERIC SUNSPOT NUMBERS
Date Ri Rn Rs
__________________________________________________________________
1 0 0 0
2 0 0 0
3 0 0 0
4 0 0 0
5 0 0 0
6 0 0 0
7 0 0 0
8 0 0 0
9 0 0 0
10 0 0 0
11 0 0 0
12 0 0 0
13 0 0 0
14 0 0 0
15 0 0 0
16 0 0 0
17 0 0 0
18 0 0 0
19 0 0 0
20 0 0 0
21 7 4 3
22 8 4 4
23 0 0 0
24 0 0 0
25 0 0 0
26 0 0 0
27 0 0 0
28 0 0 0
29 0 0 0
30 0 0 0
31 0 0 0
__________________________________________________________________
MONTHLY MEAN : 0.5 0.3 0.2
========================================================
ORIGINAL STORY FOLLOWS:
Many have been keeping a watchful eye on solar activity recently. The most popular thing to watch has been sunspots. While not a direct indication of solar activity, they are a proxy for the sun’s internal magnetic dynamo. There have been a number of indicators recently that it has been slowing down.
August 2008 has made solar history. As of 00 UTC (5PM PST) we just posted the first spotless calendar month since June 1913. Solar time is measured by Coordinated Universal Time (UTC) so it is now September 1st in UTC time. I’ve determined this to be the first spotless calendar month according to sunspot data from NOAA’s National Geophysical Data Center, which goes back to 1749. In the 95 years since 1913, we’ve had quite an active sun. But that has been changing in the last few years. The sun today is a nearly featureless sphere and has been for many days:

Image from SOHO
And there are other indicators. For example, some solar forecasts have been revised recently because the forecast models haven’t matched the observations. Australia’s space weather agency recently revised their solar cycle 24 forecast, pushing the expected date for a ramping up of cycle 24 sunspots into the future by six months.
The net effect of having no sunspots is about 0.1% drop in the TSI (Total Solar Irradiance). My view is that TSI alone isn’t the main factor in modulating Earth’s climate.
I think it’s solar magnetism modulating Galactic Cosmic Rays, and hence more cloud nuclei from GCR’s, per Svensmark’s theory. We’ve had indications since October 2005 that the sun’s dynamo is slowing down. It dropped significantly then, and has remained that way since. Seeing no sunpots now is another indicator of that idling dynamo.
Graph of solar Geomagnetic Index (Ap):

Click for a larger image
Earth of course is a big heat sink, so it takes awhile to catch up to any changes that originate on the sun, but temperature drops indicated by 4 global temperature metrics (UAH, RSS and to a lesser degree HadCrit and GISS) show a significant and sharp cooling in 2007 and 2008 that has not rebounded.In the 20 years since “global warming” started life as a public issue with Dr. James Hansen’s testimony before congress in June 1988, we are actually cooler.

Click for a larger image
Reference: UAH lower troposphere data
Coincidence? Possibly, but nature will be the final arbiter of climate change debate, and I think we would do well to listen to what it’s saying now.
Joe D’Aleo of ICECAP also wrote some interesting things which I’ll reprint here.
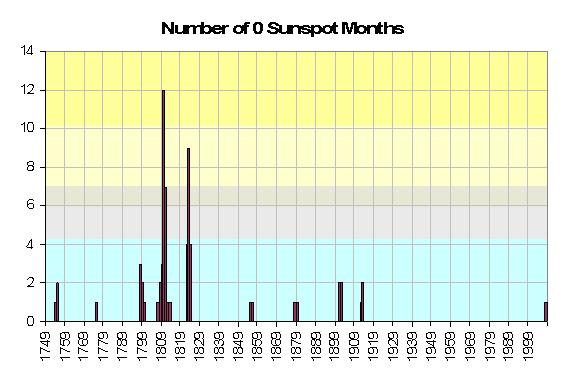
…we have had a 0 sunspot calendar month (there have been more 30 day intervals without sunspots as recent as 1954 but they have crossed months). Following is a plot of the number of months with 0 sunspots by year over the period of record – 23 cycles since 1749.
See larger image here.
Note that cluster of zero month years in the early 1800s (a very cold period called the Dalton minimum – at the time of Charles Dickens and snowy London town and including thanks to Tambora, the Year without a Summer 1816) and again to a lesser degree in the early 1900s. These correspond to the 106 and 213 year cycle minimums. This would suggest that the next cycle minimum around 2020 when both cycles are in phase at a minimum could be especially weak. Even David Hathaway of NASA who has been a believer in the cycle 24 peak being strong, thinks the next minimum and cycle 25 maximum could be the weakest in centuries based on slowdown of the plasma conveyor belt on the sun.
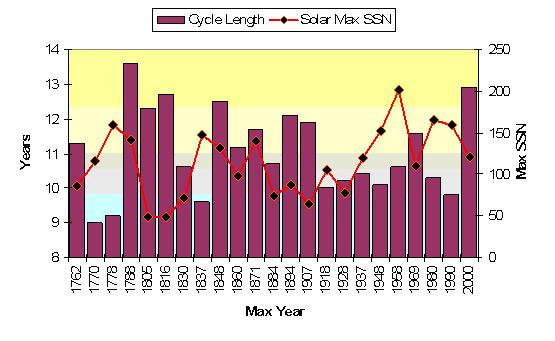
In this plot of the cycle lengths and sunspot number at peak of the cycles, assuming this upcoming cycle will begin in 2009 show the similarity of the recent cycles to cycle numbers 2- 4, two centuries ago preceding the Dalton Minimum. This cycle 23 could end up the longest since cycle 4, which had a similar size peak and also similarly, two prior short cycles.
See larger image here.


Will this mean anything for climate in our near future? Possibly. But we’ll have to wait to see how this experiment pans out.
IMO, this post’s gist centers on the significance of a “pore” spotted in Catania, and whether or not that “pore” should count as a “sunspot.” I did not notice any mention of a “sunspot pair” (allegedly?) observed in Slovakia on the same day — photo at http://www.universetoday.com/category/solar-astronomy/
What’s up with that?
Douglas Hoyt (10:04:59)
Svalgaard states: “For many [even most] of the other years and other observers it is the same story. This is clearly wrong as there must have been many days with overcast.”
This statement is clearly not true…
Well here are some others. If need be, I can show all of them, but I really don’t need to because you already know this.
NUMBER OF SUNSPOT GROUPS FOR THE YEAR: 1665
AS OBSERVED BY: FOGEL, M., HAMBURG
Day Jan Feb Mar Apr May Jun Jul Aug Sep Oct Nov Dec
—————————————————————
1 0 0 0 0 0 0 0 0 0 0 0 0
2 0 0 0 0 0 0 0 0 0 0 0 0
3 0 0 0 0 0 0 0 0 0 0 0 0
4 0 0 0 0 0 0 0 0 0 0 0 0
5 0 0 0 0 0 0 0 0 0 0 0 0
6 0 0 0 0 0 0 0 0 0 0 0 0
7 0 0 0 0 0 0 0 0 0 0 0 0
8 0 0 0 0 0 0 0 0 0 0 0 0
9 0 0 0 0 0 0 0 0 0 0 0 0
10 0 0 0 0 0 0 0 0 0 0 0 0
11 0 0 0 0 0 0 0 0 0 0 0 0
12 0 0 0 0 0 0 0 0 0 0 0 0
13 0 0 0 0 0 0 0 0 0 0 0 0
14 0 0 0 0 0 0 0 0 0 0 0 0
15 0 0 0 0 0 0 0 0 0 0 0 0
16 0 0 0 0 0 0 0 0 0 0 0 0
17 0 0 0 0 0 0 0 0 0 0 0 0
18 0 0 0 0 0 0 0 0 0 0 0 0
19 0 0 0 0 0 0 0 0 0 0 0 0
20 0 0 0 0 0 0 0 0 0 0 0 0
21 0 0 0 0 0 0 0 0 0 0 0 0
22 0 0 0 0 0 0 0 0 0 0 0 0
23 0 0 0 0 0 0 0 0 0 0 0 0
24 0 0 0 0 0 0 0 0 0 0 0 0
25 0 0 0 0 0 0 0 0 0 0 0 0
26 0 0 0 0 0 0 0 0 0 0 0 0
27 0 0 0 0 0 0 0 0 0 0 0 0
28 0 0 0 0 0 0 0 0 0 0 0 0
29 0 -99 0 0 0 0 0 0 0 0 0 0
30 0 -99 0 0 0 0 0 0 0 0 0 0
31 0 -99 0 -99 0 -99 0 0 -99 0 -99 0
means: 0.0 0.0 0.0 0.0 0.0 0.0 0.0 0.0 0.0 0.0 0.0 0.0
Fogel in Hamburg also had a perfect record. no clouds there either.
For 1664:
NUMBER OF SUNSPOT GROUPS FOR THE YEAR: 1664
AS OBSERVED BY: PICARD, J., PARIS
Day Jan Feb Mar Apr May Jun Jul Aug Sep Oct Nov Dec
—————————————————————
1 0 0 0 0 0 0 0 0 0 0 0 0
2 0 0 0 0 0 0 0 0 0 0 0 0
3 0 0 0 0 0 0 0 0 0 0 0 0
4 0 0 0 0 0 0 0 0 0 0 0 0
5 0 0 0 0 0 0 0 0 0 0 0 0
6 0 0 0 0 0 0 0 0 0 0 0 0
7 0 0 0 0 0 0 0 0 0 0 0 0
8 0 0 0 0 0 0 0 0 0 0 0 0
9 0 0 0 0 0 0 0 0 0 0 0 0
10 0 0 0 0 0 0 0 0 0 0 0 0
11 0 0 0 0 0 0 0 0 0 0 0 0
12 0 0 0 0 0 0 0 0 0 0 0 0
13 0 0 0 0 0 0 0 0 0 0 0 0
14 0 0 0 0 0 0 0 0 0 0 0 0
15 0 0 0 0 0 0 0 0 0 0 0 0
16 0 0 0 0 0 0 0 0 0 0 0 0
17 0 0 0 0 0 0 0 0 0 0 0 0
18 0 0 0 0 0 0 0 0 0 0 0 0
19 0 0 0 0 0 0 0 0 0 0 0 0
20 0 0 0 0 0 0 0 0 0 0 0 0
21 0 0 0 0 0 0 0 0 0 0 0 0
22 0 0 0 0 0 0 0 0 0 0 0 0
23 0 0 0 0 0 0 0 0 0 0 0 0
24 0 0 0 0 0 0 0 0 0 0 0 0
25 0 0 0 0 0 0 0 0 0 0 0 0
26 0 0 0 0 0 0 0 0 0 0 0 0
27 0 0 0 0 0 0 0 0 0 0 0 0
28 0 0 0 0 0 0 0 0 0 0 0 0
29 0 0 0 0 0 0 0 0 0 0 0 0
30 0 -99 0 0 0 0 0 0 0 0 0 0
31 0 -99 0 -99 0 -99 0 0 -99 0 -99 0
means: 0.0 0.0 0.0 0.0 0.0 0.0 0.0 0.0 0.0 0.0 0.0 0.0
Picard has perfect weather 1664
NUMBER OF SUNSPOT GROUPS FOR THE YEAR: 1664
AS OBSERVED BY: FOGEL, M., HAMBURG
Day Jan Feb Mar Apr May Jun Jul Aug Sep Oct Nov Dec
—————————————————————
1 0 0 0 0 0 0 0 0 0 0 0 0
2 0 0 0 0 0 0 0 0 0 0 0 0
3 0 0 0 0 0 0 0 0 0 0 0 0
4 0 0 0 0 0 0 0 0 0 0 0 0
5 0 0 0 0 0 0 0 0 0 0 0 0
6 0 0 0 0 0 0 0 0 0 0 0 0
7 0 0 0 0 0 0 0 0 0 0 0 0
8 0 0 0 0 0 0 0 0 0 0 0 0
9 0 0 0 0 0 0 0 0 0 0 0 0
10 0 0 0 0 0 0 0 0 0 0 0 0
11 0 0 0 0 0 0 0 0 0 0 0 0
12 0 0 0 0 0 0 0 0 0 0 0 0
13 0 0 0 0 0 0 0 0 0 0 0 0
14 0 0 0 0 0 0 0 0 0 0 0 0
15 0 0 0 0 0 0 0 0 0 0 0 0
16 0 0 0 0 0 0 0 0 0 0 0 0
17 0 0 0 0 0 0 0 0 0 0 0 0
18 0 0 0 0 0 0 0 0 0 0 0 0
19 0 0 0 0 0 0 0 0 0 0 0 0
20 0 0 0 0 0 0 0 0 0 0 0 0
21 0 0 0 0 0 0 0 0 0 0 0 0
22 0 0 0 0 0 0 0 0 0 0 0 0
23 0 0 0 0 0 0 0 0 0 0 0 0
24 0 0 0 0 0 0 0 0 0 0 0 0
25 0 0 0 0 0 0 0 0 0 0 0 0
26 0 0 0 0 0 0 0 0 0 0 0 0
27 0 0 0 0 0 0 0 0 0 0 0 0
28 0 0 0 0 0 0 0 0 0 0 0 0
29 0 0 0 0 0 0 0 0 0 0 0 0
30 0 -99 0 0 0 0 0 0 0 0 0 0
31 0 -99 0 -99 0 -99 0 0 -99 0 -99 0
means: 0.0 0.0 0.0 0.0 0.0 0.0 0.0 0.0 0.0 0.0 0.0 0.0
\
Fogel, too
NUMBER OF SUNSPOT GROUPS FOR THE YEAR: 1664
AS OBSERVED BY: WEIGEL, E., JENA
Day Jan Feb Mar Apr May Jun Jul Aug Sep Oct Nov Dec
—————————————————————
1 0 0 0 0 0 0 0 0 0 0 0 0
2 0 0 0 0 0 0 0 0 0 0 0 0
3 0 0 0 0 0 0 0 0 0 0 0 0
4 0 0 0 0 0 0 0 0 0 0 0 0
5 0 0 0 0 0 0 0 0 0 0 0 0
6 0 0 0 0 0 0 0 0 0 0 0 0
7 0 0 0 0 0 0 0 0 0 0 0 0
8 0 0 0 0 0 0 0 0 0 0 0 0
9 0 0 0 0 0 0 0 0 0 0 0 0
10 0 0 0 0 0 0 0 0 0 0 0 0
11 0 0 0 0 0 0 0 0 0 0 0 0
12 0 0 0 0 0 0 0 0 0 0 0 0
13 0 0 0 0 0 0 0 0 0 0 0 0
14 0 0 0 0 0 0 0 0 0 0 0 0
15 0 0 0 0 0 0 0 0 0 0 0 0
16 0 0 0 0 0 0 0 0 0 0 0 0
17 0 0 0 0 0 0 0 0 0 0 0 0
18 0 0 0 0 0 0 0 0 0 0 0 0
19 0 0 0 0 0 0 0 0 0 0 0 0
20 0 0 0 0 0 0 0 0 0 0 0 0
21 0 0 0 0 0 0 0 0 0 0 0 0
22 0 0 0 0 0 0 0 0 0 0 0 0
23 0 0 0 0 0 0 0 0 0 0 0 0
24 0 0 0 0 0 0 0 0 0 0 0 0
25 0 0 0 0 0 0 0 0 0 0 0 0
26 0 0 0 0 0 0 0 0 0 0 0 0
27 0 0 0 0 0 0 0 0 0 0 0 0
28 0 0 0 0 0 0 0 0 0 0 0 0
29 0 0 0 0 0 0 0 0 0 0 0 0
30 0 -99 0 0 0 0 0 0 0 0 0 0
31 0 -99 0 -99 0 -99 0 0 -99 0 -99 0
means: 0.0 0.0 0.0 0.0 0.0 0.0 0.0 0.0 0.0 0.0 0.0 0.0
And Weigel !
Hoyt, you represent these tables as observations. As raw data.
I have not [yet] studied all the original records, but is is not credible that there were no data gaps. Perhaps Picard said “in all of 1665 I didn’t see a single spot”. That is not the same as making up data that purports to document that he observed on every single day, missing missing one, never having a cloud to obscure his view all day long, in spite of the supposedly bad waether during the LIA.
The ratio Rz/Rg will be higher for periods when the sun is more active since it will pick up the complexity of sunspots through the count of individual spots in a group. Rz/Rg is a measure of complexity of sunspots.
There is some truth to that [as the ratio changes slightly within a cycle], but that is a second order effect, as you and the readers on this blog can verify by looking at page 11 of http://www.leif.org/research/AGU%20Spring%202008%20SP23A-07.pdf . I don’t think the complexity of the sunspots changes when the observer changes.
There were very few periods longer than a week when the sun was not observed
Yet your raw data shows none of those missing observations. You show a perfect record. And, of course, may have some reasons to make up the data, like “well, this is the Maunder minimum, after, all, so even when he didn’t observe for a week there probably weren’t any spots anyway”. But making up data like this is, in my book, not a thing to do.
Douglas Hoyt (10:04:59) :
If you drop the years where all days are labeled zero, you still get a Maunder Minimum.
Doug, your statement here reminds me of an occasion where Uri Geller [the spoon-bender] was debunked by showing that he had cheated and switched spoons. A true believer commented: “so what, he cheated this time, but there were many other times where his exploits were genuine…” 🙂
Svalgaard, you are getting very emotional. The years where all zero spots are used are based upon statements by observers that no spots were observed by them that year. The original observations recording the exact dates of observations are now lost. You have to go with the observations you have. Again this was covered in the paper I referred to above.
There are at least 14 statements giving beginning and end dates where people reported no sunspots. In my research, I uncovered some previously unknown observers who did give dates and in all cases it confirmed the 14 statements.
I have looked at the rY time series and I would say it has discontinuities in it at 1900 and 1950, not the 1893 and 1945 dates that you give. The dates 1900 and 1950 have nothing to do with changes in Rz observers.
The rY series would appear to be the inhomogeneous time series which doesn’t agree with direct observations of the sun.
Douglas Hoyt (10:04:59) :
The ratio Rz/Rg will be higher for periods when the sun is more active since it will pick up the complexity of sunspots through the count of individual spots in a group.
So, Rz/Rg is high when R [either one of them] is high, this, of course, means that the inverse is also true: Rg/Rz is low when R is low. I do not doubt this. It means that the sunspot number series measured by Rg is skewed towards even lower numbers at low activity [compared to Rz], enhancing any upward trend [cycles 18-22 were generally high] thus making it look like there is an even bigger long-term change.
Now, one can argue which one to use. Rg or Rz? Since you stopped producing Rg 13 years ago, there is a tendency for people to use Rz [or its modern equivalent Ri], except, of course, if they want to show that the sunspot number was much lower in the past – then they will use the lowest series they can find. Personally, I have no real preference, as long as one can get to a correctly calibrated series. My point being that we are not there yet.
I don’t know if anybody else is following this exchange [that may be a bit arcane] and a blog like this may not be the best place for it. Especially not when people begin to get hot under the collar.
I guess that I forgot a closing ‘italic’ token, here is what it should be:
Douglas Hoyt (10:04:59) :
The ratio Rz/Rg will be higher for periods when the sun is more active since it will pick up the complexity of sunspots through the count of individual spots in a group.
So, Rz/Rg is high when R [either one of them] is high, this, of course, means that the inverse is also true: Rg/Rz is low [… as in the previous post…]
Douglas Hoyt (11:09:33) :
I have looked at the rY time series and I would say it has discontinuities in it at 1900 and 1950, not the 1893 and 1945 dates that you give. The dates 1900 and 1950 have nothing to do with changes in Rz observers.
The discontinuities are not in rY. It doesn’t have any. !945 was a sunspot minimum year and any problems with the sunspot number would only begin to show a few years later.
The rY series would appear to be the inhomogeneous time series which doesn’t agree with direct observations of the sun.
rY since 1890 is based on continuous [objective] observations from the German station Potsdam-Seddin-Niemegk supported by several other long-term series Vieques-San Juan [1902-today], and Cheltenham-Fredricksburg [1901-today]. The ‘direct observations’ are subjective assessments of the rules to use, to wit the very debate in this blog.
Leif Svalgaard (11:16:34) :
“I don’t know if anybody else is following this exchange [that may be a bit arcane] and a blog like this may not be the best place for it.”
By all means, continue (as long as Anthony is ok with it).
What’s been exposed in the August pore controversy is a significant counting problem that needs a resolution somehow.
Do you agree that increased resolution of observations, including SDO (Solar Dynamics Observatory) satellite observations available perhaps as early as this winter – said to be much higher resolution than SOHO, STEREO, etc., – will aggravate this problem in the future?
How will such extremely high-resolution (spatial AND temporal) observations be reconciled with the lower resolution historical record?
REPLY: Carry on, all the conversation is relevant. – Anthony
John-X (11:40:51) :
What’s been exposed in the August pore controversy is a significant counting problem that needs a resolution somehow.
Do you agree that increased resolution of observations, including SDO (Solar Dynamics Observatory) satellite observations available perhaps as early as this winter – said to be much higher resolution than SOHO, STEREO, etc., – will aggravate this problem in the future?
There are three issues here:
1: the current discrepancy wrt Aug.21-22. This is just the result of slightly different rules and perhaps some sloppiness and lack of quality control. There is, perhaps, a slight chance of improvement and more transparency and that is always good.
2: The much higher resolution data is not needed for counting sunspots. What is needed is an index of solar activity or even several such indices as a single number does not cover the complexity of solar activity. There already better indices, e.g. F10.7 and MgII.
3: The real problem is accurate calibration of the historical record with the latest index or indices and that is an ongoing research topic [or should be – because I don’t think the record is correctly calibration. Doug may think that his Group Sunspot Number is the last word like when he said that “this has already been done” as response to my call for a better calibration.
The long-term calibration is extremely important in view of the worry about climate change on the Earth and in space [yes, there is something called ‘space climate’ – http://www.issc2.ro/ ]. Long-term planning requires long-term assessment of the ‘boundary condition’ under which all our actions take place. Both the trends and the extremes [the two parts of ‘climate’].
“Since you stopped producing Rg 13 years ago . . .” The reason it was not extended beyond that time is because my position did not allow it. Indeed my position did not allow any publications. Partly because of these restraints, I retired in 2000.
“The discontinuities are not in rY.” I should have said the discontinuities in the differences between Rz and rY appear to be around 1900 and 1950.
“rY since 1890 is based on continuous [objective] observations from the German station Potsdam-Seddin-Niemegk . . .” And Rg since 1874 is based largely upon continuous [objective photographs overlain with a grid that can detect spots larger than 1 millionth of the solar disk] observations of sunspot groups by the Royal Greenwich Observatory (RGO). RGO doesn’t have observing technique changes at 1893 and 1945 or at 1900 and 1950.
I am busy writing a book and have another book come in the mail today that I am obligated to read and review, so I will cease commenting on this thread.
Douglas Hoyt (12:29:18) :
I am busy writing a book and have another book come in the mail today that I am obligated to read and review, so I will cease commenting on this thread.
Doug, good luck with your book and thank you [and Ken] for the tremendous amount of wonderful detective work involved in digging up all those old sunspot observations. Work that rivals Wolf’s. Now it is up to the rest of us to make sense of it all and calibrate everything so future research can proceed confidently on a solid foundation.
Best,
Leif
Well, I wasn’t going to comment again, but I do have one question. Did any metal buildings go up around the Potsdam rY station in the 1890s and 1940s that could effect their measurements? Or changes within the buildings themselves?
Thanks for the compliment, Leif.
[…] Doch er ist ausgeblieben. Jetzt zeigt sich, dass der August der erste Monat seit 1913 war, in dem kein einziger Sonnenfleck beobachtet werden konnte. Nun gibt es einen Zusammenhang zwischen […]
Douglas Hoyt (13:09:16) :
Well, I wasn’t going to comment again, but I do have one question. Did any metal buildings go up around the Potsdam rY station in the 1890s and 1940s that could effect their measurements? Or changes within the buildings themselves?
Geomagnetic observatories are deliberately located in ‘remote’ areas and the measurements are made in specially constructed non-magnetic building in open field, far from anything else. The main problem is urban growth that makes once ‘remote’ areas less remove with time. Electric trams and trains also louse up the data. These environmental conditions are carefully monitored and the stations moved slightly to prevent disturbances from becoming problematic. The observatory moved from Potsdam to nearby Seddin in 1909 and from Seddin to nearby Niemegk in 1932. The old and new stations were run in parallel for several years to ensure that the data is homogeneous. In fact, even before a new site is selected, several sites are surveyed and tested, such as to ensure that conditions are as much as possible the same at the old and new stations. In any event, the disturbances that the observers fuss about when deciding to move are an order of magnitude or more smaller than the range (rY) if the daily variation. So are not a problem [that’s why they move the stations in the first place – to avoid having a problem].
Thanks for the compliment, Leif.
It is well deserved.
REPLY: Sounds like our surface thermometer problem, except climate scientists don’t seem to bother moving thermometers when they go askew, they simply say they can “correct” the measurment environment.
Lets call this one the Urban Magnetic Effect “UMI” – Anthony
Leif Svalgaard (14:02:48) :
REPLY: Sounds like our surface thermometer problem, except climate scientists don’t seem to bother moving thermometers when they go askew, they simply say they can “correct” the measurement environment.
Maybe they can correct if done ‘correctly’. So, just like with the sunspots it all comes down to how you calibrate old data. This calibration problem does not exist in the same sense for the geomagnetic data because it is dealt with explicitly and prevented from even occurring.
There is still the problem of the ‘thermometer’ itself changing with time: The Earth’s magnetic field is decreasing; that increases the conductivity in the ionosphere and hence the electric currents that flow there. These currents produce the magnetic effect [rY] that I [and Rudolf Wolf !] use to calibrate the SSN. To get a correct calibration, one must first remove the known drift of the instrument, hence the debate about the ‘detrending’.
Ric Werme (10:13:33) :
What puzzles me is how an equation like k(10g+s) can yield 4. Leif, can you explain that a bit better?
If g=1 and s=1, the SSN would be 10*1+1=11 without the k-factor. Let’s say that a certain observatory has a bigger telescope than our standard observatory so that they see three times as many spots, then its SSN would be 10*1+3 = 13. To be able to compare the two numbers, one sets k=11/13 for the observatory with the bigger telescope. Of course, k is not determined from just one case, so many years of data go into determination of k. Ideally, since each observer has his own k, all sunspot number series should agree [they don’t, of course, but close enough].
“emotions have taken hold of your critical sense”
Hume dispensed with the illusion of Dispassionate Reason some time back.
“By all means, continue”
And when the discussion of whether something needs doing is finished, lets hear re: the very many issues with what was done by Svalgaard and Cliver, please.
Gary Gulrud (16:02:51) :
lets hear re: the very many issues with what was done by Svalgaard and Cliver, please.
If you are really interested, please lay out what particular subjects [but stay on topic] have you special interest and attention. What keeps you awake at night that we can help alleviate. With Anthony’s concurrence I’ll be glad to spread some light in the darkness.
Wow. I guess Anthony needs to buy a ticket on the Shuttle. Next stop, GOES. But I think he will need a bit more support to survey THESE stations.
Apologies if this has already been pointed out. Some sunspots appear to be much easier to identify if the “correct” filters are used during observation.
Therefore a better definition of “sunspot” is needed, such as “it appears in at least 3 filters” or “it can be seen in the SOHO MDI channel” or whatever else. Otherwise when the Sun wakes up, the count is going to be truly enormous, and comparisons with the past impossible.
I want a free trip in the space ! i would love that, to see the earth , the sun like in that film… “Sunshine” !
Dr. Tony Phillips at the excellent website
http://spaceweather.com
has weighed in on the August sunspot controversy.
You should read his remarks in their entirety. Here is a brief excerpt
“…There has been much speculation in the solar “blogosphere” about the length of the ongoing solar minimum. The sun has been mostly blank for a long time and people are wondering when the next solar cycle is going to begin. Some observers claim we’re entering a climate-altering minimum of historic proportions.
“There’s no evidence to back up these claims…
“…If the sun remains blank for another year, it’s time to re-think our assurances, but for now, all is well.”
[…] post, my interested was piqued when I found out that the sun is extremely quiet currently, with one or perhaps zero sunspots in a month for the first time since 1913 (see […]
John-X (14:32:00) :
“…There has been much speculation in the solar “blogosphere” about the length of the ongoing solar minimum. The sun has been mostly blank for a long time and people are wondering when the next solar cycle is going to begin. Some observers claim we’re entering a climate-altering minimum of historic proportions.
“There’s no evidence to back up these claims…
Indeed, Dr. Phillips is right on.