UPADATED AT 8:30AM PST Sept 2nd-
More on SIDC’s decision to count a sunspeck (technically a “pore”) days after the fact. NOAA has now followed SIDC in adding a 0.5 sunspot where there was none before. But as commenter Basil points out, SIDC’s own records are in contrast to their last minute decision to count the sunspeck or “pore” on August 21.
There is an archive of the daily SIDC “ursigrams” here:
http://sidc.oma.be/html/SWAPP/dailyreport/dailyreport.html
If you select the ursigrams for August 22 and 23, you get the reported data for the 21st and 22nd:
August 21:
TODAY’S ESTIMATED ISN : 000, BASED ON 07 STATIONS.
SOLAR INDICES FOR 21 Aug 2008
WOLF NUMBER CATANIA : 011
10CM SOLAR FLUX : 067
AK CHAMBON LA FORET : ///
AK WINGST : 004
ESTIMATED AP : 005
ESTIMATED ISN : 000, BASED ON 14 STATIONS.
August 22:
TODAY’S ESTIMATED ISN : 000, BASED ON 11 STATIONS.
SOLAR INDICES FOR 22 Aug 2008
WOLF NUMBER CATANIA : 013
10CM SOLAR FLUX : 068
AK CHAMBON LA FORET : ///
AK WINGST : 003
ESTIMATED AP : 003
ESTIMATED ISN : 000, BASED ON 11 STATIONS.
In both cases, the daily estimated “International Sunspot Number” based on multiple stations, not just the Catania Wolf Number, was 000. So how did SIDC end up with positive values in the monthly report?
UPDATED at 2:42 PM PST Sept 1st –
After going days without counting the August 21/22 “sunspeck” NOAA and SIDC Brussels now says it was NOT a spotless month! Both data sets below have been recently revised.
Here is the SIDC data:
http://www.sidc.be/products/ri_hemispheric/
Here is the NOAA data:
ftp://ftp.ngdc.noaa.gov/STP/SOLAR_DATA/SUNSPOT_NUMBERS/MONTHLY
The NOAA data shows July as 0.5 but they have not yet updated for August as SIDC has. SIDC reports 0.5 for August. It will be interesting to see what NOAA will do.
SIDC officially counted that sunspeck after all. It only took them a week to figure out if they were going to count it or not, since no number was assigned originally.
But there appears to be an error in the data from the one station that reported a spot, Catania, Italy. No other stations monitoring that day reported a spot. Here is the drawing from that Observatory:
ftp://ftp.ct.astro.it/sundraw/OAC_D_20080821_063500.jpg
ftp://ftp.ct.astro.it/sundraw/OAC_D_20080822_055000.jpg
But according to Leif Svalgaard, “SIDC reported a spot in the south, while the spot(s) Catania [reported] was in the north.” This is a puzzle. See his exchange below.
Also, other observatories show no spots at all. For example, at the 150 foot solar solar tower at the Mount Wilson Observatory, the drawings from those dates show no spots at all:
ftp://howard.astro.ucla.edu/pub/obs/drawings/dr080821.jpg
ftp://howard.astro.ucla.edu/pub/obs/drawings/dr080822.jpg
Inquires have been sent, stay tuned.
Here is an exchange in comments from Leif Svalgaard.
——-
REPLY: So What gives Leif….? You yourself said these sunspecks weren’t given a number. I trusted your assessment. Hence this article. Given the Brussels folks decided to change their minds later, what is the rationale ? – Anthony
The active region numbering is done by NOAA, not by Brussels. The Brussels folks occasionally disagree. In this case, they did. Rudolf Wolf would not have counted this spot. Nor would I. What puzzles me is this:
21 7 4 3
22 8 4 4
The 3rd column are ’spots’ in the Northern hemisphere, and the 4th column are ’spots’ in the Southern hemisphere [both weighted with the ‘k’-factor: SSN = k(10g+s)]. But there weren’t any in the south. The Catania spot was at 15 degrees north latitude, IIRC. Maybe the last word is not in on this.
——–
Hmm….apparently there’s some backstory to this. There is a debate raging in comments to this story, be sure to check them. – Anthony
# MONTHLY REPORT ON THE INTERNATIONAL SUNSPOT NUMBER #
# from the SIDC (RWC-Belgium) #
#——————————————————————–#
AUGUST 2008
PROVISIONAL INTERNATIONAL NORMALIZED HEMISPHERIC SUNSPOT NUMBERS
Date Ri Rn Rs
__________________________________________________________________
1 0 0 0
2 0 0 0
3 0 0 0
4 0 0 0
5 0 0 0
6 0 0 0
7 0 0 0
8 0 0 0
9 0 0 0
10 0 0 0
11 0 0 0
12 0 0 0
13 0 0 0
14 0 0 0
15 0 0 0
16 0 0 0
17 0 0 0
18 0 0 0
19 0 0 0
20 0 0 0
21 7 4 3
22 8 4 4
23 0 0 0
24 0 0 0
25 0 0 0
26 0 0 0
27 0 0 0
28 0 0 0
29 0 0 0
30 0 0 0
31 0 0 0
__________________________________________________________________
MONTHLY MEAN : 0.5 0.3 0.2
========================================================
ORIGINAL STORY FOLLOWS:
Many have been keeping a watchful eye on solar activity recently. The most popular thing to watch has been sunspots. While not a direct indication of solar activity, they are a proxy for the sun’s internal magnetic dynamo. There have been a number of indicators recently that it has been slowing down.
August 2008 has made solar history. As of 00 UTC (5PM PST) we just posted the first spotless calendar month since June 1913. Solar time is measured by Coordinated Universal Time (UTC) so it is now September 1st in UTC time. I’ve determined this to be the first spotless calendar month according to sunspot data from NOAA’s National Geophysical Data Center, which goes back to 1749. In the 95 years since 1913, we’ve had quite an active sun. But that has been changing in the last few years. The sun today is a nearly featureless sphere and has been for many days:

Image from SOHO
And there are other indicators. For example, some solar forecasts have been revised recently because the forecast models haven’t matched the observations. Australia’s space weather agency recently revised their solar cycle 24 forecast, pushing the expected date for a ramping up of cycle 24 sunspots into the future by six months.
The net effect of having no sunspots is about 0.1% drop in the TSI (Total Solar Irradiance). My view is that TSI alone isn’t the main factor in modulating Earth’s climate.
I think it’s solar magnetism modulating Galactic Cosmic Rays, and hence more cloud nuclei from GCR’s, per Svensmark’s theory. We’ve had indications since October 2005 that the sun’s dynamo is slowing down. It dropped significantly then, and has remained that way since. Seeing no sunpots now is another indicator of that idling dynamo.
Graph of solar Geomagnetic Index (Ap):

Click for a larger image
Earth of course is a big heat sink, so it takes awhile to catch up to any changes that originate on the sun, but temperature drops indicated by 4 global temperature metrics (UAH, RSS and to a lesser degree HadCrit and GISS) show a significant and sharp cooling in 2007 and 2008 that has not rebounded.In the 20 years since “global warming” started life as a public issue with Dr. James Hansen’s testimony before congress in June 1988, we are actually cooler.

Click for a larger image
Reference: UAH lower troposphere data
Coincidence? Possibly, but nature will be the final arbiter of climate change debate, and I think we would do well to listen to what it’s saying now.
Joe D’Aleo of ICECAP also wrote some interesting things which I’ll reprint here.
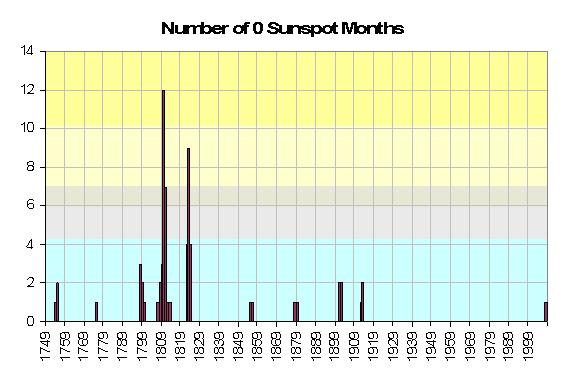
…we have had a 0 sunspot calendar month (there have been more 30 day intervals without sunspots as recent as 1954 but they have crossed months). Following is a plot of the number of months with 0 sunspots by year over the period of record – 23 cycles since 1749.
See larger image here.
Note that cluster of zero month years in the early 1800s (a very cold period called the Dalton minimum – at the time of Charles Dickens and snowy London town and including thanks to Tambora, the Year without a Summer 1816) and again to a lesser degree in the early 1900s. These correspond to the 106 and 213 year cycle minimums. This would suggest that the next cycle minimum around 2020 when both cycles are in phase at a minimum could be especially weak. Even David Hathaway of NASA who has been a believer in the cycle 24 peak being strong, thinks the next minimum and cycle 25 maximum could be the weakest in centuries based on slowdown of the plasma conveyor belt on the sun.
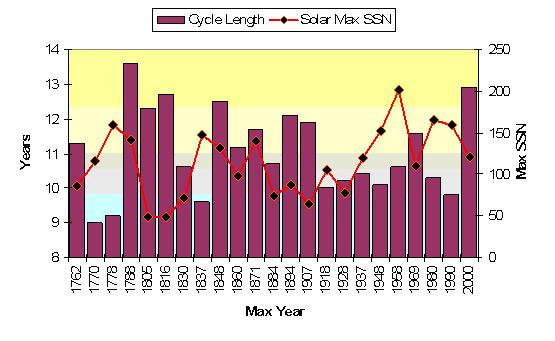
In this plot of the cycle lengths and sunspot number at peak of the cycles, assuming this upcoming cycle will begin in 2009 show the similarity of the recent cycles to cycle numbers 2- 4, two centuries ago preceding the Dalton Minimum. This cycle 23 could end up the longest since cycle 4, which had a similar size peak and also similarly, two prior short cycles.
See larger image here.


Will this mean anything for climate in our near future? Possibly. But we’ll have to wait to see how this experiment pans out.
March 10, 2006: … This week researchers announced that a storm is coming–the most intense solar maximum in fifty years. … “The next sunspot cycle will be 30% to 50% stronger than the previous one,” she says. If correct, the years ahead could produce a burst of solar activity second only to the historic Solar Max of 1958…..Dikpati’s forecast puts Solar Max at 2012. Hathaway believes it will arrive sooner, in 2010 or 2011. “History shows that big sunspot cycles ‘ramp up’ faster than small ones,” he says. “I expect to see the first sunspots of the next cycle appear in late 2006 or 2007—and Solar Max to be underway by 2010 or 2011.”
http://science.nasa.gov/headlines/y2006/10mar_stormwarning.htm
*was = wasn’t. Sorry. Sometimes even double-checking doesn’t catch everything. (Just ask SIDC!)
@ur momisugly Leif Svalgaard (20:12:05) :
Thanks for taking the time (& for your patience) in explicating the processes involved and the differences between SWPC & SIDC. It’s like comparing apples and oranges – they’re similar but not the same. The thing for an outsider to remember {raising hand} is that there is no nefarious conspiracy.
“The suggested “correction” method makes an a priori detrending of the rY series and then extends the linear regression between rY and sunspot numbers established for the last 25 years to earlier times.”
This is called circular reasoning, assuming what one purports to prove.
“at least a minimal understanding of the science (eg. to have read and understood at least some of the wikipedia article on, say, global warming).”
This is rather like showing up for lecture and discussion half-way thru the semester and ripping your fellow student for not having read Cliff Notes.
Daz, thanks for your comments. However, you say:
Of the 23 models relied upon by the IPCC, the total number of models that use solar cycles for the IPCC forecasts (as opposed to the hindcasts) is exactly two (really one, because the “two” are the GISS ER and EH variations). [See FAR Table 10.1)
So no, they are not factored into the models as you so blithely claim. In fact, the models use very few forcings for their forecasts, viz:
Variables Used for Forecasts in FAR GHCMs100% used CO2 as a variable.
100% used CH4 as a variable.
100% used N2O as a variable.
100% used SO4 as a variable.
96% used CFCS as a variable.
61% used STRAT OZONE as a variable.
57% used TROP OZONE as a variable.
35% used BLACK CARBON as a variable.
30% used 1ST INDIRECT as a variable.
22% used 2ND INDIRECT as a variable.
22% used SEA SALT as a variable.
17% used VOLCANIC as a variable.
13% used DUST as a variable.
13% used LAND USE as a variable.
9% used NITRATE as a variable.
9% used SOLAR as a variable.
Given that, your claims about how the “vast, vast majority” of sceptics have no professional background rings a bit hollow … pot, meet kettle. Do your research and homework first, general comments will get eaten alive here if they are not true.
Best of luck,
w.
Gary Gulrud (21:52:40) :
“The suggested “correction” method makes an a priori detrending of the rY series and then extends the linear regression between rY and sunspot numbers established for the last 25 years to earlier times.”
This is called circular reasoning, assuming what one purports to prove.
You would benefit from actually reading my paper http://www.leif.org/research/AGU%20Spring%202008%20SP23A-07.pdf on this, rather than citing second-hand misconceptions of the issue.
The trend is well-understood (due to the secular decrease of the Earth’s magnetic field) and should be removed to be scientifically honest [if you know that the response function of your instrument (the Earth itself) has changed, you should not ignore that]. Second, the trend is small, so is a second-order effect anyway. Third, the ‘error’ in the sunspot number does not just accumulate linearly with time [as you would get if removed a linear trend], but discontinuously, coinciding with changes of observers].
B.C. (21:12:31) :
*was = wasn’t. Sorry. Sometimes even double-checking doesn’t catch everything. (Just ask SIDC!)
Except that I don’t think they even check once…
Daz Rees (20:31:56) :
Hi Daz,
Could you please supply references to the following.
1. A published science paper that clearly demonstrates the causal link between rising CO2 levels and rising global temperatures – such that rising CO2 must cause rising global temperatures.
2. A published science paper that clearly outlines the falsification criteria for Anthopomorhic Global Warming. I.e. what are the specific, measurable criteria that – if found would refute AGW. For example a measured cooling period in the presence of ever increasing CO2 would have to last for how long before AGW was proven to be false.
For the record, my agenda is the promotion of open, transparent, and non-politicised science.
I am also concerned about the diversion of resources away from solving real environmental and human problems such as water quality and water availability, by politicians who seem to believe the AGW is the cause of all adverse environmental phenomena. While they believe the cause is AGW (which seems like a myth to me) the real root causes of problems will not be addressed.
Also to Daz,
Note that “demonstration” means an empirical, hard data, demonstration.
Computer Generated models do not qualify as a demonstration of anything except the abilities of the programmers involved.
Also to Daz,
A causal link – must be causal – not a correlation.
have fun :-).
Gary Gulrud (21:52:40) :
“The suggested “correction” method makes an a priori detrending of the rY series and then extends the linear regression between rY and sunspot numbers established for the last 25 years to earlier times.”
“This is called circular reasoning, assuming what one purports to prove.”
Gulrud is exactly right. It is clear from Svalgaard’s responses that he has not read Mursula’s paper. Mursula shows that Svalgaard’s method of detrending is wrong. He is throwing out the signal and then claiming that there is no signal.
Perhaps Svalgaard would be better off by assuming the variations in rY from minimum to minimum represent real differences between solar minima.
Svalgaard claims that in the 1880s that only 60% of the sunspot groups were observed and 40% were missed. There are two photgraphic runs during that period and both of them agree with each other to better than 10%. The Royal Greenwich Observatory photographs measured sunspot areas to 1 millionth of the area of the solar disk. The other other program was equally good. There is no way that these careful observers was missing 40% of the spot groups. Svalgaard’s claims are just ridiculous.
The Solar Influences Data Analysis Center in Brussels, Belgium, will soon be able to identify sunspots that are a mere one hundreth the size of the controversial August “sunspecks”. “There will never again be a spotless month if we can help it”, a spokesman said.
The Solar Influences Data Analysis Center, Protecting Mankind From Solar Minima
Not Really
Leif Svalgaard (20:12:05) :
“And also unfortunate that they reported a [preliminary] SSN of 000 on the two days where Catania actually had data.”
I believe you’ve said that the process is relatively automatic. Do you know how they handle a situation where some stations report a spot, and others do not? I think knowing that is important to resolving questions about the integrity of the process. It seems to me that “averaging” the reports would be very misleading, so I doubt that is what they do. I mean, either a spot is there, or it is not. It is not “half a spot” if half the stations report it, and half of them do not. I don’t know what the threshold should be, since I don’t the issues underlying the measurements taken here, but it seems to me the only way for the process to work would be to report the spot if “X number” of stations report it. In this case, it seems that only Catania reported it. Surely the threshold should be higher than if “1 station” reports it.
You mention that the daily numbers are preliminary. So also is the monthly report at this time. (As you no doubt know, but for the benefit of others, a formal monthly report comes out about mid-month.) So what is the process by which preliminary numbers are made final? Knowing that, too, would seem important to understanding the integrity of the process.
Finally, you mention that there are ~60 stations that report sunspots. But from the few SIDC reports I’ve viewed, it would appear as if only a fraction of those stations are counted in the daily SIDC “ursigram.” I know stations fail to report on a given day from time to time, but surely not this many, this often. Is it a situation where SIDC is dependent on the individual stations reporting to them, and they go with what they’ve got, and that the small number of reporting stations is not an indication that observations were not actually taken at the non-reporting stations? Assuming that is the case, shouldn’t the monthly number be based on a more concerted effort to get what reports actually exist from all ~60 stations?
Is there a list of the stations anywhere?
Basil
After the explanations that Leif has provided, including his communication with SIDC specifically about this issue, I am satisfied that both NOAA and SIDC followed their own procedures.
No conspiracies or political influence need be invoked to explain what happened.
I found documentation on the NOAA SWPC website that adequately explained their procedures.
I didn’t find such documentation on the SIDC website, but the explanation Leif received and posted above cleared it up.
In that explanation, SIDC clearly seems to realize that their automated counting process is flawed, which raises serious concern about why they continue to use it, especially as Leif points out, without manual quality control – when NOAA and the NGDC database depend entirely on the SIDC count as the “official” number.
Mt. Wilson’s daily sunspot drawing yesterday contained the remark, “45 days without sunspots,” so at least unofficially, the streak goes on.
As a side note, the “Spotless August” story continues to circulate, on the web and in the popular press – no mention of the SIDC non-zero count or any of what we’ve been talking about.
I think that’s unfortunate, especially if we also have a “Spotless September,” as the total – unofficial – streak, however long it ends up, will take on something of an “Urban Legend” character.
Once again, Anthony provides THE place to get the truth and the whole story.
Leif wrote:
Thanks Leif for explicating the differences further. Such competitiveness in science! Reminds me of Kissinger’s comments about disputes in academia, but in this case the stakes have suddenly become big.
This discussion about sun”specks” is neither here nor there. The crucial question is whether the Sun was scrutinised to the same level of detail in the years under comparison. This is almost certainly not the case: 90 years ago there was no reason to find the last tiny “speck”, now apparently even a miniscule feature qualifies. The result of such a comparison is nonsensical. The data to me are totally convincing in that they show that the Sun is now is as little, or even less, “specked” than during a similar period about a century ago. Given that in many places a cooling trent is observed, ignoring the possibility that the Sun has something to do with it will only be defended by the religious, the true believers of the GW brigade.
Mauna Loa numbers out, looks like trend reestablished.
Tony:
Now really! How offtopical of you!
Just so we don’t get all groovy too quickly, Saddam retained 20 – 50 kilos of bomb-grade uranium permitted by the UN IAEA since 1991. Worse yet plutonium refinement efforts started anew in 1998 at al Tuwaitha.
Just to put this into perspective, the Hiroshima bomb was made using 25 kilos.
Ed Zuiderwijk:
The salient points should stand that this minimum is unique in its steep drop in sunspot activity in conjunction with much lower magnetic output. Leif rightly cites other deep minima that preceded strong solar cycles, so sunspot counts and TSI aren’t enough, even facular UV may not vary sufficiently in the long term to explain the statistical trend relationship between climate and sunspots.
That leaves us with solar magnetic output and cosmic rays. Historical C14 & Be10 data representing cosmic ray flux still fall all over the place despite the historical correlations (read: statistical trends) between long-term drops in sunspots and cooler climate.
So the science is incomplete, but are the historical trend correlations sufficient to make for good science? I surmise from Livingston’s and Janssens’ statements we might concede “No.” Whether the solar science community keeps a higher litmus for science than does the climate science community speaks better of solar science.
This leaves us with what seem salient but are still functionally anecdotal points of lowered solar output and a contemporaneous slight cooling trend with science lacking a solid causal link (not to denigrate Svensmark). In this case patience will prove a virtue and may prove a good nostrum for alarmism within the next few years.
To our benefit Leif has been willing to enter the fray and has been candid about his view on alarmist statements from either global cooling or warming blocs. This current heated debate about a solar pore will prove a minor blip in the overall outcome, the 10.7 cm magnetic flux appears to be gaining ground against the other metrics.
And purely speculative on my part, but AFAIK one climate factor that hasn’t been investigated is changes in marine thermomagnetic convection. Could flux in solar magnetism & wind interact sufficiently with the Earth’s magnetic field so to yield any effect in the seas?
Ed Zuiderwijk (06:49:13) :
“This discussion about sun”specks” is neither here nor there. The crucial question is whether the Sun was scrutinised to the same level of detail in the years under comparison. This is almost certainly not the case: 90 years ago there was no reason to find the last tiny “speck”…”
The speck or pore of August may well have been observed in 1913. The question is would it have been counted in 1913, and SHOULD it have been counted for August 2008.
It’s an important question as observing capabilities increase. Have a look at this image from 2002
http://antwrp.gsfc.nasa.gov/apod/ap021114.html
claimed to be one of the sharpest views of the sun ever.
Now the question is not merely what is a sunspot and what is not, but what is a penumbra and what is not.
If we can now resolve small penumbrae around very small spots that would have previously been considered pores without penumbrae, that confuses the situation even further.
“…Given that in many places a cooling trent is observed, ignoring the possibility that the Sun has something to do with it will only be defended by the religious, the true believers of the GW brigade.”
It’s going to be more difficult than that. As recently as Monday, cold climate was blamed on global warming.
http://news.smh.com.au/national/big-chill-a-symptom-of-climate-chaos-20080901-46yx.html
The “logic” seems to be, “if it’s this COLD, it must be even WARMER than we thought!”
I’ve been [casually] looking into the weather of 1913 – not serious research yet, mind you – looking for anecdotal similarities with this year.
One similarity is the dismal weather in Europe. It was funny to read the news archives about American tourists in Europe, “thoroughly disgusted,” and impatiently waiting for the next boat home.
The spring US tornado outbreaks were similar, as was the flooding (Indiana and Ohio with record floods).
The devastating Great Lakes Storm – 250 killed, 19 ships lost, 19 others stranded – well, that remains to be seen. I for one will not be planning a Great Lakes cruise this November.
In Denver, Colorado, Greatest Snowfall From One Storm (all-time): 45.7 inches December 1-6, 1913.
Another feature of 1913 weather was a warm Christmas, in many places in the US and in Europe. A warm Christmas this year would tend to deflate any popular notion of global cooling.
My point is, amongst the religious, yes, you are correct. And as the article from Sydney shows, colder weather merely PROVES global warming, for the true believers.
Amongst the vast majority of people, a cold winter this year will subject “AGW” to increasing mockery, and make political moves such as this year’s US Carbon Tax bill less and less likely, no matter who wins the election.
My prediction is for a cold winter, with frequent outbreaks of Arctic air across the US east of the Rockies, a predominant northwesterly wind flow in the upper Midwest and across the Great Lakes (a typical feature of an NAO (North Atlantic Oscillation) cold phase), leading to huge totals of lake-effect snow in the US “snow belt; frequent episodes of atmospheric “blocking” over the eastern North Atlantic (also typical of cold NAO), which cause Scandinavian and even Siberian Arctic air to stagnate over the UK and northern Europe, so this winter’s temperatures will average well below normal for the UK, Russia, and all of Europe north of the Alps.
Patterns which favor frequent US lake-effect snow also favor mild weather in the west (trough in the east, ridge in the west), so not as frigid west of the Rockies, but there will be significant snowfall in the Pacific Northwest, including Portland and Seattle metro areas.
News stories to watch for this cold winter:
Lake effect snow – cities in the “snow belt” buried under several feet of snow each big event;
another big Great Lakes Storm, with hurricane force winds;
substantial losses in the Florida citrus crop, AND in the Texas citrus crop (e.g. Lower Rio Grande valley grapefruit), due to penetration of Arctic air to low latitudes, which also means we will also see at least one “Tehuantepecer”
http://en.wikipedia.org/wiki/Tehuantepecer
news stories about the cold winter in the UK, Europe and Russia, including temperature records and snowfall records;
Some (DEFINITELY not a majority) of the “consensus” scientists cashing in their “AGW” chips and accepting that at the very least, the relationship between CO2 and temperature is not linear, and that the real climate does not behave according to the “AGW” hypothesis
One of the Biggest weather stories of winter 2008-2009 will of course be the price of heating oil. Especially for many people in the US northeast, this may be the least affordable winter ever.
Ironically, those of us electrically heated (especially with hydro), usually considered expensive and inefficient heating, may see very little change in our heating bills.
Good job at providing a story line to this event Anthony….. Far as I am concerned, they wouldn’t have spotted this 90 years ago or considered it relevant. Therefore it isn’t a spot for the purpose of our definition….. But of course it still is a noted feature.
Douglas Hoyt (04:41:16) :
Svalgaard claims that in the 1880s that only 60% of the sunspot groups were observed and 40% were missed. There are two photographic runs during that period and both of them agree with each other to better than 10%. The Royal Greenwich Observatory photographs measured sunspot areas to 1 millionth of the area of the solar disk. The other program was equally good. There is no way that these careful observers was missing 40% of the spot groups. Svalgaard’s claims are just ridiculous.
Once you begin to use words like ‘ridiculous’ about other people’s work it shows that emotions have taken hold of your critical sense. I am not saying that anybody’s measurements are wrong or careless. When splicing together a long time series from data taken by different observers there is always the issue of constancy of calibration and my claim is that the various calibrations employed for the splice(s) are not correct, and that therefore the time series are not homogeneous and their long-term trends suspect. Instead of going far back in time where it is very hard to reconstruct what went on, we can take one of the recent discontinuities and examine that. Between solar cycles 17 and 18 Max Waldmeier took over as ‘producer’ of the Zurich sunspot number, Rz. He introduced an artificial ‘jump’ in Rz of ~20%, in the sense that the Zurich sunspot number [and hence also the SIDC number, since it is spliced to the end of Rz trying to maintain a correct calibration across the change in 1979] since 1945 is too high by 20%. Similar jumps happened in the 1890s and in 1849 coincident with end and start of Wolf’s tenure.
But let us examine the most recent jump where we probably have the best data. To eliminate the issue of detrending we’ll only consider a relatively short interval on either side of the jump.
Since Rg is much less influenced by the jump caused by Waldmeier we shall assume that Rg was homogeneous across the jump [Doug can tell us if it was not]. We shall also assume that the sunspot areas measured at Greenwich were OK across the jump. So, [and everybody can do this quickly from publicly available data] let us simply compute the average Rz for solar cycles 16 and 17 [1923-1945] before the jump and for solar cycles 18 and 19 [1946-1964] after the jump and compare with:
1: averages of Rg [we find Rz to be 21% higher than Rg]
2: averages of sunspot areas [we find Rz to be 18% higher than the areas converted to equivalent sunspot numbers using the same formula throughout]
3: averages of geomagnetic variation rY [we find Rz to be 23% higher than rY converted to equivalent sunspot numbers using the same formula throughout]
So, these three independent methods all show the same jump. In particular, on might note that if rY also finds the same jump contrary to the claim by Mursula et al. that rY is too inaccurate for this.
So, it is possible to check on the calibrations, to discover that they are deficient, and to correct them. The last word on this is not in yet as there is a lot more 19th century geomagnetic data that can be used to corroborate the correction – and work is in progress to recover that data.
One might [as Hoyt does] automatically assume that the Group Sunspot number is by definition superior to anything else. Rg has, for example’ been used to ‘show’ that the Maunder Minimum was very well observed [even better than the sunspot number in the 19th century]. I show here [from Hoyt’s data] the purported observations by Picard in 1665:
NUMBER OF SUNSPOT GROUPS FOR THE YEAR: 1665
AS OBSERVED BY: PICARD, J., PARIS
Day Jan Feb Mar Apr May Jun Jul Aug Sep Oct Nov Dec
—————————————————————
1 0 0 0 0 0 0 0 0 0 0 0 0
2 0 0 0 0 0 0 0 0 0 0 0 0
3 0 0 0 0 0 0 0 0 0 0 0 0
4 0 0 0 0 0 0 0 0 0 0 0 0
5 0 0 0 0 0 0 0 0 0 0 0 0
6 0 0 0 0 0 0 0 0 0 0 0 0
7 0 0 0 0 0 0 0 0 0 0 0 0
8 0 0 0 0 0 0 0 0 0 0 0 0
9 0 0 0 0 0 0 0 0 0 0 0 0
10 0 0 0 0 0 0 0 0 0 0 0 0
11 0 0 0 0 0 0 0 0 0 0 0 0
12 0 0 0 0 0 0 0 0 0 0 0 0
13 0 0 0 0 0 0 0 0 0 0 0 0
14 0 0 0 0 0 0 0 0 0 0 0 0
15 0 0 0 0 0 0 0 0 0 0 0 0
16 0 0 0 0 0 0 0 0 0 0 0 0
17 0 0 0 0 0 0 0 0 0 0 0 0
18 0 0 0 0 0 0 0 0 0 0 0 0
19 0 0 0 0 0 0 0 0 0 0 0 0
20 0 0 0 0 0 0 0 0 0 0 0 0
21 0 0 0 0 0 0 0 0 0 0 0 0
22 0 0 0 0 0 0 0 0 0 0 0 0
23 0 0 0 0 0 0 0 0 0 0 0 0
24 0 0 0 0 0 0 0 0 0 0 0 0
25 0 0 0 0 0 0 0 0 0 0 0 0
26 0 0 0 0 0 0 0 0 0 0 0 0
27 0 0 0 0 0 0 0 0 0 0 0 0
28 0 0 0 0 0 0 0 0 0 0 0 0
29 0 -99 0 0 0 0 0 0 0 0 0 0
30 0 -99 0 0 0 0 0 0 0 0 0 0
31 0 -99 0 -99 0 -99 0 0 -99 0 -99 0
means: 0.0 0.0 0.0 0.0 0.0 0.0 0.0 0.0 0.0 0.0 0.0 0.0
[The -99 are days that do not exist, like February 31st]. From this tabulation one may see that Hoyt claims that Picard observed on every single day [in spite of the louse weather at the height of the LIA] and found not a single spot in 365 days of observations, giving a yearly sunspot [group] number of zero. For many [even most] of the other years and other observers it is the same story. This is clearly wrong as there must have been many days with overcast. Yet, this kind of ‘data’ is used to bolster Hoyt’s claim that the Maunder Minimum is very well established and that the Group Sunspot Number is on solid ground.
So, in closing, there are good reasons to believe that our various sunspot numbers series are not on firm ground and that conclusions based on them about long-term trends [e.g. as shown is some reconstructions of TSI] are shaky as well.
There is nothing ‘ridiculous’ in taking a good hard look at [sacrosanct] data and finding deficiencies.
Svalgaard states: “For many [even most] of the other years and other observers it is the same story. This is clearly wrong as there must have been many days with overcast.”
This statement is clearly not true and was treated by me in the paper
Hoyt, D.V., and K. H. Schatten, 1996. How well was the Maunder Minimum observed? Solar Physics, 165, 181-192.
There were very few periods longer than a week when the sun was not observed. Picard did observe actively in 1665 and there were zero spots during that year are based upon two independent statements. If you drop the years where all days are labeled zero, you still get a Maunder Minimum.
I did not say that Svalgaard’s re-examination was ridiculous. I said his conclusions for the 1880s that 40% of the sunspots were missed is ridiculous and I stand by that. The observers were not as bad as that.
The ratio Rz/Rg will be higher for periods when the sun is more active since it will pick up the complexity of sunspots through the count of individual spots in a group. Rz/Rg is a measure of complexity of sunspots.