A Guest Post By Steve Goddard
In my most recent article in The Register, and also posted here on WUWT, I incorrectly speculated that NSIDC graphs appeared to show less growth in Arctic ice extent than had actually occurred. My calculations were based on counting ice pixels from Cryosphere Today maps. Since then, I have had further discussions with Dr. Walt Meier at NSIDC and William Chapman at Cryosphere Today, to try to understand the source of the problem. Dr. Meier has confirmed that counting pixels provides a “good rough estimate” and that NSIDC teaches pixel counting to CU students as a way to estimate ice extent. William Chapman has confirmed that the projection used in CT maps is very close to what it appears and to what I had assumed it to be. It is an astronaut’s view from about 5,000 miles above the north pole.
What I have learned
In 2008, CT and NSIDC maps show excellent agreement – as can be seen in this video which overlays an August 14 NSIDC map on top of the August 14 CT map. The borders of ice extent are nearly identical in the two maps. (The videos show overlays of the two maps.)
The discrepancy occurred in August, 2007, when agreement between NSIDC and CT was not so good. The equivalent video from August 15, 2007 shows that the CT map was missing a significant amount of low concentration ice on the Canada/Alaska side. I have since confirmed from AMSR maps and NASA satellite photos that the NSIDC map is probably more accurate than the CT map.
The reason that CT provides their side-by-side image viewer is apparently to encourage visitors to make a visual comparison of two dates, which is exactly what myself and others here did when we observed the discrepancy vs. NSIDC graphs. The human brain is quite good at making estimates of relative areas from images, and pixel counting is nothing more than a way to quantify what has already been observed. Since writing The Register piece I have made adjustments to the CT pixel counts for map distortion, and as I expected that makes the discrepancy slightly larger.
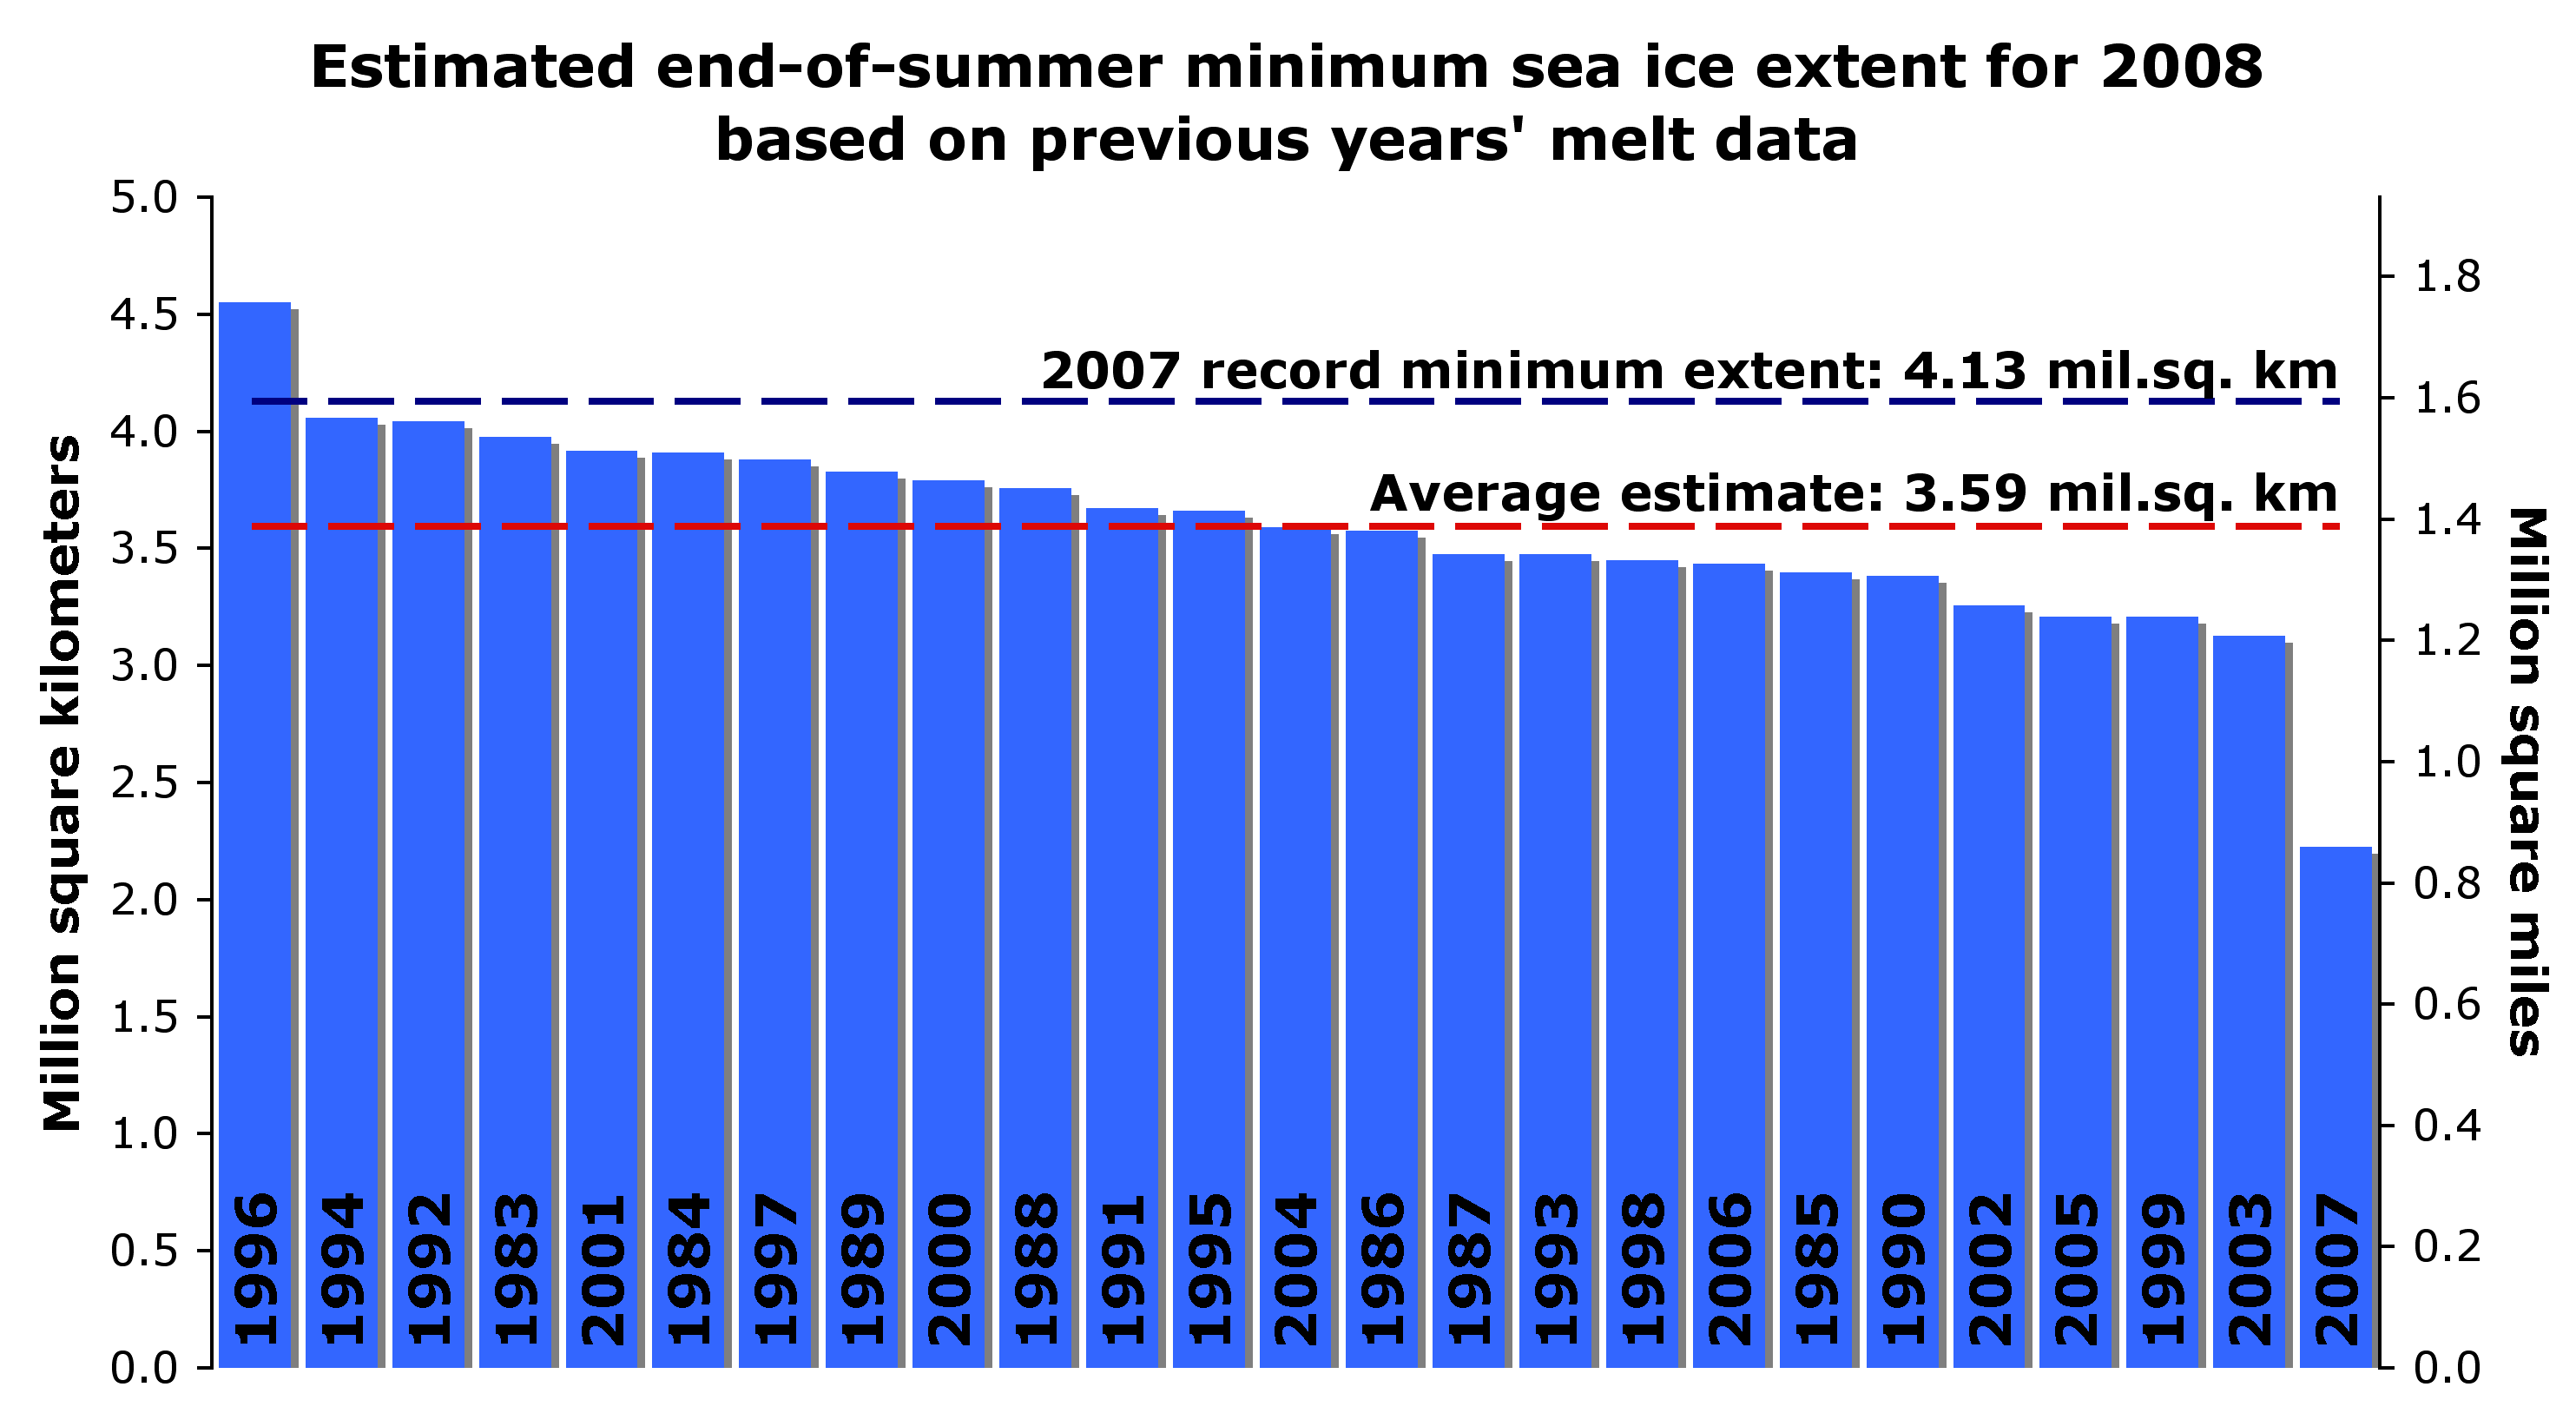
Because CT maps showed less ice in 2007, the increase in 2008 ice extent appears to be much greater. There is little doubt now that the NSIDC reported ice growth is absolutely correct. But wasn’t the ice supposed to shrink this year due to an excess of “thin first-year ice?” In May, NSIDC’s mean forecast (based on previous year’s melt) was that Arctic ice extent would be 13% lower than last year. (NSIDC has more recently posted on their web site some reasons why they believe the May estimates didn’t work out.)

Click for a larger image

Click for a larger image
Secondly, while Arctic ice is well below the 30 year mean, it is above expectations and nowhere near gone. NSIDC graphs show Arctic ice extent at greater than 70% of normal – hardly a six sigma event. As of August 1, NSIDC was even considering a possible return to normal extent this summer. If not for a few weeks of stormy Siberian weather, the map (and story) would be quite different today.


Click for a larger image
Is it possible that the 30 year satellite record coincidentally represents only one leg of a waveform? Greenland temperature records would hint at that. If you examine only one leg of a waveform, you will absolutely come to the wrong conclusion about the long term behaviour – just as some did during the 1970s ice age panic.

Click for a larger image – original source image from NASA GISS
Is there cause for concern? Perhaps. But unfortunately much of the press coverage has been little more than science fiction so far. How do we separate the science from the fiction? Dr. Meier has graciously agreed to answer that question (and others) in my next article.
One thing we can state with a degree of certainty, is that there likely will be more multi-year ice in 2009 than there was in 2008. This is because the 2008 melt season is ending with more ice area than 2007. Barring asteroid impact, after the winter freeze there will be (by definition) more multi-year ice than what we started with this year. Any ice which survives the summer will be classified as multi-year ice in 2009. If next year is cool like this year, is it unreasonable to hypothesise that ice extent will again increase? Or are we on a non-linear trend which will lead to ice-free summers and a collapsing Greenland ice sheet? Hopefully Dr. Meier can help sort this out for us.
“One thing we can state with a degree of certainty, is that there likely will be more multi-year ice in 2009 than there was in 2008. This is because the 2008 melt season is ending with more ice area than 2007. ” – Steve Goddard in the main article.
1) The season hasn’t ended yet.
2) More, but only by about 0.1million kmsq or so.
3) Since 2002 every year has shown a drop in perennial extent on the preceding year, yet both overall ice area and extent do not show that behaviour. i.e. while some years had more ice than others every year had a reduction in perennial ice area as measured by Quikscat.
See Nghiem 2007 “Rapid reduction of Arctic perennial sea ice.”
1.68Mb pdf, here. Check out figure 3, March 2008 down another 1 million sqkm from March 2007.
By the way Steve Goddard also says:
“Dr. Meier has confirmed that counting pixels provides a “good rough estimate” and that NSIDC teaches pixel counting to CU students as a way to estimate ice extent. ”
From Walt Meier at RealClimate:
http://www.realclimate.org/index.php/archives/2008/08/north-pole-notes-continued/#comment-96329
Sod,/ Mike Bryant
[Snip – be nice] … as a naval design engineer any vessel (including figments of your imagination ) with a 300 hp engine would need an additional 1,000 hp plus to keep moving in slush ice, but as you rightly pointed out you require satellite photos to believe, but in 1937, 1944, the photos were under the control of Buck Rodgers and are not yet off the secrets list.
there is evidence, that is NOT satellite data. Hadley for example provides data back to 1870.
http://hadobs.metoffice.com/hadisst/data/download.html
but it doesn t show anything that is similar to what we see today.
again: that a single ship can slip through, does NOT prove, that we have similar open water to 2007. you need to provide a lot more information, to show that.
Sod,
The voyage of the St. Roch is well documented. Read the “Big Ship”‘ by Henry Larsen. Of course that would require some effort on your part.
Shawn Whelan (15:40:22) :
Sod
The St. Roch with it’s little 300 HP motor and top speed of 6 miles per hour went from Halifax to Vancouver in 86 days in 1944 through the NW Passage. That is a fact. I gave an example of other boats navigating the passage in 1937 in a single year. Also a fact.
Regrettably not, what you gave an example of was an icebreaker forcing its way through to meet another ship part way through which had come from the other side, not quite the same thing!
Compare that with the Polarstern’s transit a week or so ago:
“Contrary to Roald Amundsen, who was the first to sail the sea way, we needed only 4 days instead of 3 years.”
“Only few small ice fields forced the ship to reduce its speed.”
“Fortunately, the sea ice has retreated far to the north along our track, and only small ice fields in the Canada Basin force the ship to slow down.”
http://www.awi.de/en/infrastructure/ships/polarstern/weekly_reports/all_expeditions/ark_xxiii/ark_xxiii3/24_august_2008/
Obviously the ice was at a low level similar to today.(pre SUV)
Obviously not since Larsen reported having ‘to battle against the ice along the Alaskan coast’ whereas now unreinforced yachts are sailing through there.
http://www.tyhina.com/Images/Progress-Map.gif
Here’s a photo from another yacht on the same route, note the ice!
http://baloumgwen.canalblog.com/albums/resolute_tuktoyaktuk/photos/29568516-tuktoyaktuk.html
Here’s a photo of three of the yachts in transit earlier this year in Gjoa Havn (where Amundsen spent the summer marooned in ice).
http://www.tyhina.com/Images/2008/1-8boatsGjoa.jpg
When Larsen made his transits it was an extremely dangerous and difficult journey in conditions much different than today’s. By suggesting that the conditions were such that the journey could have been made by an unreinforced fiberglass yacht as can be done today I think you’re demeaning the memory of some very brave men. Which is not to say that it’s not a dangerous adventure now but the two aren’t in the same league.
If every bit of sea ice melted in the Arctic, there is not one shred of evidence that it would be catastrophic for life on this planet.
Ok here is some really wild speculation. It seems to me that the warming of the last century has, if anything, moderated earth’s climate. Looking through some old books on google books, “warm arctic” search term, it seems that the arctic has had moderate temperatures as recently as 3,000 years ago. The fossils and remains in the region testify to this. Also, it seems that there have been no continental high temperature records set in many years. I think that it is likely that runaway global warming, would in fact be a global tempering, so that the temperatures would be more even worldwide. Imagine Hawaii all over the earth. This seems as likely to me as any catastrophic outcome.
http://www.ecoenquirer.com/Frosty-Cove-Alaska.htm
Northwest Passage August 15, 2008
The Amodino is stuck in the ice. They are much larger and can hopefully push their way around. Good luck to them. The Berri is too small and under powered to help, if there was a prayer to get close enough to help. I saw a small oil tanker with a bent propeller and shaft from the ice. The shaft was designed for the arctic and was several feet (1Meter) diameter. This is scary stuff.
http://awberrimilla.blogspot.com/2008/08/almost-out.html
Did Amundsen have GPS, satellite, phone and Internet to plot out his route real-time?
I have also written code to do a pixel count on Cryosphere Today image. It uses the ice density scale that appears in the top left corner of the side-by-side images.
It applies a mask to all land areas, so snow on land is not considered. I calibrated for the projection by identifying the latitudes of about a dozen points on the image and their corresponding radial distance from the North Pole on the image. These latitudes vs. radial distances were then fit to a function, so the latitude of each colored pixel and its cosine projection could be calculated.
The most difficult problem has been matching the color scale to the actual pixel colors. There is not a one to one correspondence between the color pixels in the image and the pixels in the color scale (which is at the upper left corner of the image). Consequently, some color interpolation must be done.
I have run my code for every day in 2007 and 2008 so far.
What I have achieved so far is a “compressed” version of Cryosphere Today’s “Current Northern Hemisphere Sea Ice Area” graph. By compressed I mean that if I normalize my data to give the same result at the winter maximum, then the summer minimum I derive is greater than Cryosphere Today’s. (Or alternatively, if I normalize my data to give the same result at the summer minimum, then the winter maximum is lower than Cryosphere Today’s.) That is, the yearly change comes out several percent less than Cryosphere Today’s yearly change. I am still working on this issue.
My code is written in LabView (v7.1) using the IMAQ image handling and analysis package. Please contact me if you are interested in more details of the code or have some suggestions concerning algorithms.
Best Regards
Tom Moriarty
ClimateSanity
“Did Amundsen have GPS, satellite, phone and Internet to plot out his route real-time?”
No, but since he couldn’t get out of Gjoa Havn it doesn’t make much difference! Amodino and Berrimilla were trying to get through as soon as possible, a week later the passage was ice free.
Ice chart when A & B went through:
http://ice-glaces.ec.gc.ca/prods/WIS38CT/20080815180000_WIS38CT_0003916928.gif
Today:
http://ice-glaces.ec.gc.ca/prods/WIS38CT/20080901180000_WIS38CT_0003947216.gif
Phil
The Polar Stern is an powerful icebreaker with 20,000hp. About 20,000 more HP than the St. Roch. The St. Roch went through uncharted waters never before travelled in 1944. And they encountered little ice. It was late September when the St. Roch went past Barrow. Might be the same come the end of September this year.
http://ice-glaces.ec.gc.ca/prods/WIS40CT/20080901180000_WIS40CT_0003947354.gif
This boat went through and back again in 1937.
“After the stop at Gjoa Haven, the Akluvik headed up along Boothia Peninsula. Once it reached Bellot Strait, Gall remembers that “the ice was piled up on the reefs and along the shore, and the current was running pretty fast.” At that point he saw an opening and “went for it!” The easterly run through the strait was successful, and the night was spent on the northeast end of the strait, at a location then known as Kennedy Harbour. They returned west through the Bellot Strait the following day, 2 September. Gall admits a certain amount of luck was involved, because their success depended largely on the nature of the ice and the accuracy of their dead reckoning. Nevertheless, the trip remains quite a tribute to their daring.
The Akluvik was 60 feet (20 metres) in length and drew 6 feet (2 metres) of water. It was powered by a 35 hp Fairbanks-Morse engine.”
http://iain-cameron.blogspot.com/2007/07/test.html
Small boats travelled every year to Gjoa Haven in the 30’s.
http://www.kitikmeotheritage.ca/Angulalk/hudsons/hudsons.htm
The Polarstern is a 20,000hp icebreaker. About 20,000 more hp than the St. Roch. The St. Roch easily navigated the northern route of the NW Passage in 1944 and encountered little ice in the passage. It was late September when they went past barrow. Could Barrow be blocked again this year? Looks likely.
http://ice-glaces.ec.gc.ca/prods/WIS40CT/20080901180000_WIS40CT_0003947354.gif
Here is Gjoa Haven in 1930. Look similar? Lots of pictures from the earlier part of the century showing no ice similar to today.
This boat went through from Cambridge Bay past Gjoa Haven then through the Bellot Strait and back.
“The Akluvik was 60 feet (20 metres) in length and drew 6 feet (2 metres) of water. It was powered by a 35 hp Fairbanks-Morse engine. ”
http://iain-cameron.blogspot.com/2007/07/test.html
The Polarstern is a 20,000hp icebreaker. About 20,000 more hp than the St. Roch. The St. Roch easily navigated the northern route of the NW Passage in 1944 and encountered little ice in the passage. It was late September when they went past barrow. Could Barrow be blocked again this year? Looks likely.
http://ice-glaces.ec.gc.ca/prods/WIS40CT/20080901180000_WIS40CT_0003947354.gif
Here is Gjoa Haven in 1930. Look similar? Lots of pictures from the earlier part of the century showing ice conditions similar to today.
This boat went through from Cambridge Bay past Gjoa Haven then through the Bellot Strait and back.
“The trip of the Akluvik required a great deal of preparation at its home port of Cambridge Bay. The crew had to be prepared, for example, to spend the winter away from home if caught in the ice. The big drop of trading goods on this trip in late 1937 was to be at Gjoa Haven on King William Island, and then the target was to transit the Northwest Passage – Bellot Strait, on this occasion – by 1 September, before freeze-up.
After the stop at Gjoa Haven, the Akluvik headed up along Boothia Peninsula. Once it reached Bellot Strait, Gall remembers that “the ice was piled up on the reefs and along the shore, and the current was running pretty fast.” At that point he saw an opening and “went for it!” The easterly run through the strait was successful, and the night was spent on the northeast end of the strait, at a location then known as Kennedy Harbour. They returned west through the Bellot Strait the following day, 2 September. Gall admits a certain amount of luck was involved, because their success depended largely on the nature of the ice and the accuracy of their dead reckoning. Nevertheless, the trip remains quite a tribute to their daring.
The Akluvik was 60 feet (20 metres) in length and drew 6 feet (2 metres) of water. It was powered by a 35 hp Fairbanks-Morse engine. ”
http://iain-cameron.blogspot.com/2007/07/test.html
Phil,
So what you are saying is that after 105 years of catastrophic global warming, with the help of satellites, GPS and modern communications, a carefully timed trip through the Northwest passage can be easier – if you get luckier than this oil tanker did two weeks ago?
I saw a small oil tanker with a bent propeller and shaft from the ice. The shaft was designed for the arctic and was several feet (1Meter) diameter. This is scary stuff.
I’m guessing that slush won’t bend a 3 foot thick rotor.
I’m sure that was a pretty awesome run, in the Akluvik, but was that really a *transit* of the Northwest Passage?
For one thing, Cambridge Bay is in the southern route, not the Parry Channel which is what they have been talking about last year and this year, the only commercially-significant NWP.
For another, it’s in the middle of the southern route – if that’s their starting and ending point, at best they transited about half of the southern route.
As for Barrow, of course it could be blocked again this year – isn’t it blocked every year? The point is, is the entire NWP (Parry Channel) navigable for commercial shipping, long enough and clear enough for a transit without an icebreaker escort? AFAIK that is generally what is referred to as an ‘open Northwest Passage’.
Last year it was ‘open’, although the Northeast Passage was blocked. This year, both the Northwest Passage (Parry Channel) and Northeast Passage (aka Northern Sea Route) are ‘open’. Can you say that for 1930, or 1937, or 1944 or any of those other years?
Patrick Henry:
Yes, that is definitely amazing – but it’s even worse than you thought – he didn’t say a 3ft diameter rotor, he said it was a 3ft diameter *shaft*!!
And that’s a pretty big tanker, I would think, do they normally run in the southern channel?
Which tanker was that anyway?
I saw the Queen Mary once, it had an even larger prop shaft (but not
Patrick Henry (14:36:48) :
Phil,
So what you are saying is that after 105 years of catastrophic global warming, with the help of satellites, GPS and modern communications, a carefully timed trip through the Northwest passage can be easier – if you get luckier than this oil tanker did two weeks ago?
What makes you think that tanker bent its shaft two weeks ago?
I saw a small oil tanker with a bent propeller and shaft from the ice. The shaft was designed for the arctic and was several feet (1Meter) diameter. This is scary stuff.
“I’m guessing that slush won’t bend a 3 foot thick rotor.”
I’m guessing it won’t either, of course that oil tanker wasn’t anywhere near the NW Passage either, somewhere in Alaska perhaps Nome and who knows when?
This boat went through from Cambridge Bay past Gjoa Haven then through the Bellot Strait and back.
“The trip of the Akluvik required a great deal of preparation at its home port of Cambridge Bay. The crew had to be prepared, for example, to spend the winter away from home if caught in the ice. The big drop of trading goods on this trip in late 1937 was to be at Gjoa Haven on King William Island, and then the target was to transit the Northwest Passage – Bellot Strait, on this occasion – by 1 September, before freeze-up.
That isn’t a transit of the NW Passage, check it out on Tyhina’s chart, they sailed that part of the Passage in late Aug this year in a few days.
http://www.tyhina.com/Images/Progress-Map.gif
In a trip of just that length in 1937 at this time of year they ran the risk of being frozen in for the winter that tells you the difference between then and now, this year no ice!
Gary Ramos sailed Arctic Wanderer single-handed through Bellot Strait about a week ago (from CB) and is now heading for Greenland.
After the stop at Gjoa Haven, the Akluvik headed up along Boothia Peninsula. Once it reached Bellot Strait, Gall remembers that “the ice was piled up on the reefs and along the shore, and the current was running pretty fast.” At that point he saw an opening and “went for it!” The easterly run through the strait was successful, and the night was spent on the northeast end of the strait, at a location then known as Kennedy Harbour. They returned west through the Bellot Strait the following day, 2 September. Gall admits a certain amount of luck was involved, because their success depended largely on the nature of the ice and the accuracy of their dead reckoning. Nevertheless, the trip remains quite a tribute to their daring.
It does indeed.
Phil,
Look at the picture of Gjoa Haven from 1930 on this link. There was many of these boats motoring around.
http://www.kitikmeotheritage.ca/Angulalk/hudsons/hudsons.htm
Through the Bellot Strait is the route Larsen took on his West to East passage of the NW Passage. Do you know where the Bellot Strait is? The Tyhina did not invent the NW Passage in 2008.
Then they merrily motored back to Cambridge Bay. Also in photos on the link with no ice. There was many boats like this motoring around the NW Passage in the Thirties. Obviously the ice was at a low level at the times of these voyages. Similar to this year. Then in the late 40’s and 50’s several of the Hudson Bay stations were abandoned due to to much ice.
JP Rourke
The Parry Channell route is not open to non icebreaker boats. The route of the St. Roch in 1944 is blocked this year. It was less ice in 1944? Appears so.
The Parry Channell route is not open to non icebreaker boats. The route of the St. Roch in 1944 is blocked this year. It was less ice in 1944? Appears so.
floating sea ice is blown around by the wind.
that one small sub-route is blocked this year, does NOT prove, that there was less ice in 1944.
that one ship came through, does not prove that the passage was open.
i don t think that this is very difficult to understand. when you want evidence, that compares to what we see today, you need much much more!
Shawn:
Yes, Larsen did take the Bellot Strait (which separates Somerset Island from the mainland) on the east->west route – but that’s not the commercially significant route, it doesn’t have the deep water of the Parry Channel route… see:
http://www.athropolis.com/map9.htm
The yellow route is Larsen’s 1944 trip, from west to east, but he did not take the Bellot Strait – instead he took the Parry Channel, which is the first known transit of the deep-water route that could become commercially significant – that is the route that first opened up to non-icebreaker ships on Aug 21, 2007, and was reported to be open on Aug 27th of this year. (The St. Roch, while not exactly an icebreaker ship we think of today, was ‘ice-fortified’, modified, and fitted with a steel icebreaking ‘shoe’ over the bow of the ship)
Note: I’ve only seen one mention from NSIDC, on Aug 25th, that the Parry Channel was ‘nearly open’ for non-icebreakers and would be within a few days; a sketchy article in Scientific American confirmed this on the 27th. The maps seem to agree also (http://www.iup.uni-bremen.de:8084/amsr/arctic_AMSRE_visual.png) but since I haven’t read it anywhere else, and since the AMSRE map seems to show the ice gone one day and a few spots back the next, back and forth over the last two weeks, it’s probably not 100% open – yet.
I have no way of knowing if there is more or less ice than in 1944; however, given that they took 86 days even in an ice-fortified ship, I expect they encountered considerable ice at various points. Do you have information that they did not?
Lewis Pugh is starting to face reality. Water temperatures dropped 4C overnight Monday and he is suffering. No mention of his location of course, which is probably at least 500 miles from the pole.
http://polardefenseproject.org/blog/?p=144
The story is full of irrational and contradictory statements, but what is new about that?
Military buoys are showing air temperatures in almost the entire Arctic Basin well below the freezing point of seawater. Look for widespread ice to start forming soon. The area around Hans Island has frozen over very quickly during the last 5 days.
Military buoys are showing air temperatures in almost the entire Arctic Basin well below the freezing point of seawater. Look for widespread ice to start forming soon. The area around Hans Island has frozen over very quickly during the last 5 days.
[snip] sea ice area is LOW. extremely LOW, actually.
http://arctic.atmos.uiuc.edu/cryosphere/IMAGES/current.365.jpg
why is there not a single word about this in your posts?
Argh*.
I wrote it backwards… Larsen’s 1940-42 trip was WEST to EAST, and 1944 was EAST to WEST… I thought I had it the wrong way, so I corrected it… but I was right the first time! (I shouldn’t be posting at 4 a.m.)
*TLAPD (‘Talk Like a Pirate Day’ is coming up soon… Sep 19th!)
JP Rourke
This is a better map of Larsen’s route. Larsen spent twenty years running the St. Roch around the Arctic. And there were probably a hundred other boats motoring around the Arctic. This evidence is for some reason totally ignored by the scientific community.
http://www.ucalgary.ca/arcticexpedition/larsenexpeditions
Larsen intended to take the Northern route through the NW Passage on the East West journey and headed that way. He was called back on business and then had to take the southern route. Without the late start likely he would have made it right through in 1941. (at least on the southern route since the Nascopie travelled the Eastern part of the passage ahead of Larsen.)
The voyage is well recorded in Larsen’s autobiography, “The Big Ship”. They ran into little ice on the East to West trip in the non-icebreaker St. Roch. Obviously, 2007 wasn’t the first time the passage was open to
non-icebreakers.
The St. Roch took 86 days to go from Halifax to Vancouver(7,295 miles), not 86 days to traverse the Passage. And through uncharted waters where they would sound the bottom with a lead weight and string 24 hours a day.
I have seen nothing to indicate the Perry Channel route opened to non-ice breakers in 2008 and now it is starting to freeze.
Good luck to that kayaker.
Temps in Alert are well below freezing and have been consistently colder than 2007. He will be kayaking on hard water.
http://www.climate.weatheroffice.ec.gc.ca/climateData/hourlydata_e.html?timeframe=1&Prov=CA&StationID=42463&Year=2008&Month=9&Day=1
Shawn:
Thanks for the link. I haven’t read any books about Larsen, but I will – hopefully the stories aren’t as dire as the Shackleton story, for instance!
Although I still question whether the east-to-west route, using the Prince of Wales Strait instead of the McClure Strait can be considered a commercially navigable route (can today’s supertankers or, at least, bulk carriers make it through the Prince of William Strait?), I think it’s close enough that I’ll agree that 2007 is probably *not* the first time the NWP has been ‘open’.
Without reading the book I obviously can’t say I know any better than you about the ‘ice quality’ in the 1944 transit, but from the quote in the article you cited:
“In September the ship was nearly destroyed by hurricane force winds while at Tuktoyaktuk, yet the ice had been lighter than the previous summer. As a result, Larsen decided to try to complete the passage without having to winter in the Arctic. Traveling west along the coast of Alaska, the St. Roch found itself in a battle against the ice as it tried to reach Bering Strait before it was locked in for the winter. By September 27th however, the St. Roch had reached the strait and passed into the Pacific.”
It doesn’t sound like it was ice-free, or that they really had an easy time against the ice… so no, it does not sound like they had less ice in 1944 than last year, or this year. In fact, I strongly suspect that an equivalent ship would have it much easier last year or this year, WRT ice, than in 1944.
However, it is pretty clear that the transit of the NWP itself was much less than 86 days… in fact it has to be less than 45 days, from the Aug 12th resupply date at Pond Inlet to the Bering Strait on September 27th. I’m sure that was an amazing feat, probably as much so as Amundsen’s original transit through the southern route, for the conditions back then.