A Guest Post By Steve Goddard
In my most recent article in The Register, and also posted here on WUWT, I incorrectly speculated that NSIDC graphs appeared to show less growth in Arctic ice extent than had actually occurred. My calculations were based on counting ice pixels from Cryosphere Today maps. Since then, I have had further discussions with Dr. Walt Meier at NSIDC and William Chapman at Cryosphere Today, to try to understand the source of the problem. Dr. Meier has confirmed that counting pixels provides a “good rough estimate” and that NSIDC teaches pixel counting to CU students as a way to estimate ice extent. William Chapman has confirmed that the projection used in CT maps is very close to what it appears and to what I had assumed it to be. It is an astronaut’s view from about 5,000 miles above the north pole.
What I have learned
In 2008, CT and NSIDC maps show excellent agreement – as can be seen in this video which overlays an August 14 NSIDC map on top of the August 14 CT map. The borders of ice extent are nearly identical in the two maps. (The videos show overlays of the two maps.)
The discrepancy occurred in August, 2007, when agreement between NSIDC and CT was not so good. The equivalent video from August 15, 2007 shows that the CT map was missing a significant amount of low concentration ice on the Canada/Alaska side. I have since confirmed from AMSR maps and NASA satellite photos that the NSIDC map is probably more accurate than the CT map.
The reason that CT provides their side-by-side image viewer is apparently to encourage visitors to make a visual comparison of two dates, which is exactly what myself and others here did when we observed the discrepancy vs. NSIDC graphs. The human brain is quite good at making estimates of relative areas from images, and pixel counting is nothing more than a way to quantify what has already been observed. Since writing The Register piece I have made adjustments to the CT pixel counts for map distortion, and as I expected that makes the discrepancy slightly larger.
Because CT maps showed less ice in 2007, the increase in 2008 ice extent appears to be much greater. There is little doubt now that the NSIDC reported ice growth is absolutely correct. But wasn’t the ice supposed to shrink this year due to an excess of “thin first-year ice?” In May, NSIDC’s mean forecast (based on previous year’s melt) was that Arctic ice extent would be 13% lower than last year. (NSIDC has more recently posted on their web site some reasons why they believe the May estimates didn’t work out.)

Click for a larger image

Click for a larger image
Secondly, while Arctic ice is well below the 30 year mean, it is above expectations and nowhere near gone. NSIDC graphs show Arctic ice extent at greater than 70% of normal – hardly a six sigma event. As of August 1, NSIDC was even considering a possible return to normal extent this summer. If not for a few weeks of stormy Siberian weather, the map (and story) would be quite different today.


Click for a larger image
Is it possible that the 30 year satellite record coincidentally represents only one leg of a waveform? Greenland temperature records would hint at that. If you examine only one leg of a waveform, you will absolutely come to the wrong conclusion about the long term behaviour – just as some did during the 1970s ice age panic.

Click for a larger image – original source image from NASA GISS
Is there cause for concern? Perhaps. But unfortunately much of the press coverage has been little more than science fiction so far. How do we separate the science from the fiction? Dr. Meier has graciously agreed to answer that question (and others) in my next article.
One thing we can state with a degree of certainty, is that there likely will be more multi-year ice in 2009 than there was in 2008. This is because the 2008 melt season is ending with more ice area than 2007. Barring asteroid impact, after the winter freeze there will be (by definition) more multi-year ice than what we started with this year. Any ice which survives the summer will be classified as multi-year ice in 2009. If next year is cool like this year, is it unreasonable to hypothesise that ice extent will again increase? Or are we on a non-linear trend which will lead to ice-free summers and a collapsing Greenland ice sheet? Hopefully Dr. Meier can help sort this out for us.
Mike: Good to see we can both have a sense of humor!
Steven: I only have monitored NSIDC, and today’s chart (8/30 data) was the only one that was ‘flat’ (yesterday’s chart, 8/29 was still ‘melting’)… if you’ve got another, I’d like the reference. (and it’s actually ‘John’)
Robert: I wouldn’t call Pugh a fraud. If you read the article, he states pretty clearly he doesn’t expect to make it to the Pole *this* year, but wants to see how far he can get. I suspect he’ll keep trying and comparing (that may be in the article also, I forget). He also states pretty clearly that whether or not he makes it to the pole, he is doing this to raise awareness of the issue – so in essence, he’s saying it’s mostly for the p.r. If he was a fraud, he wouldn’t be admitting all that.
I just don’t think his story is all that significant (for that matter, if he really wanted to reach the Pole, it looks like he’d have much better luck from the Alaska side, probably have it a bit warmer and with the wind perhaps).
Lyman:
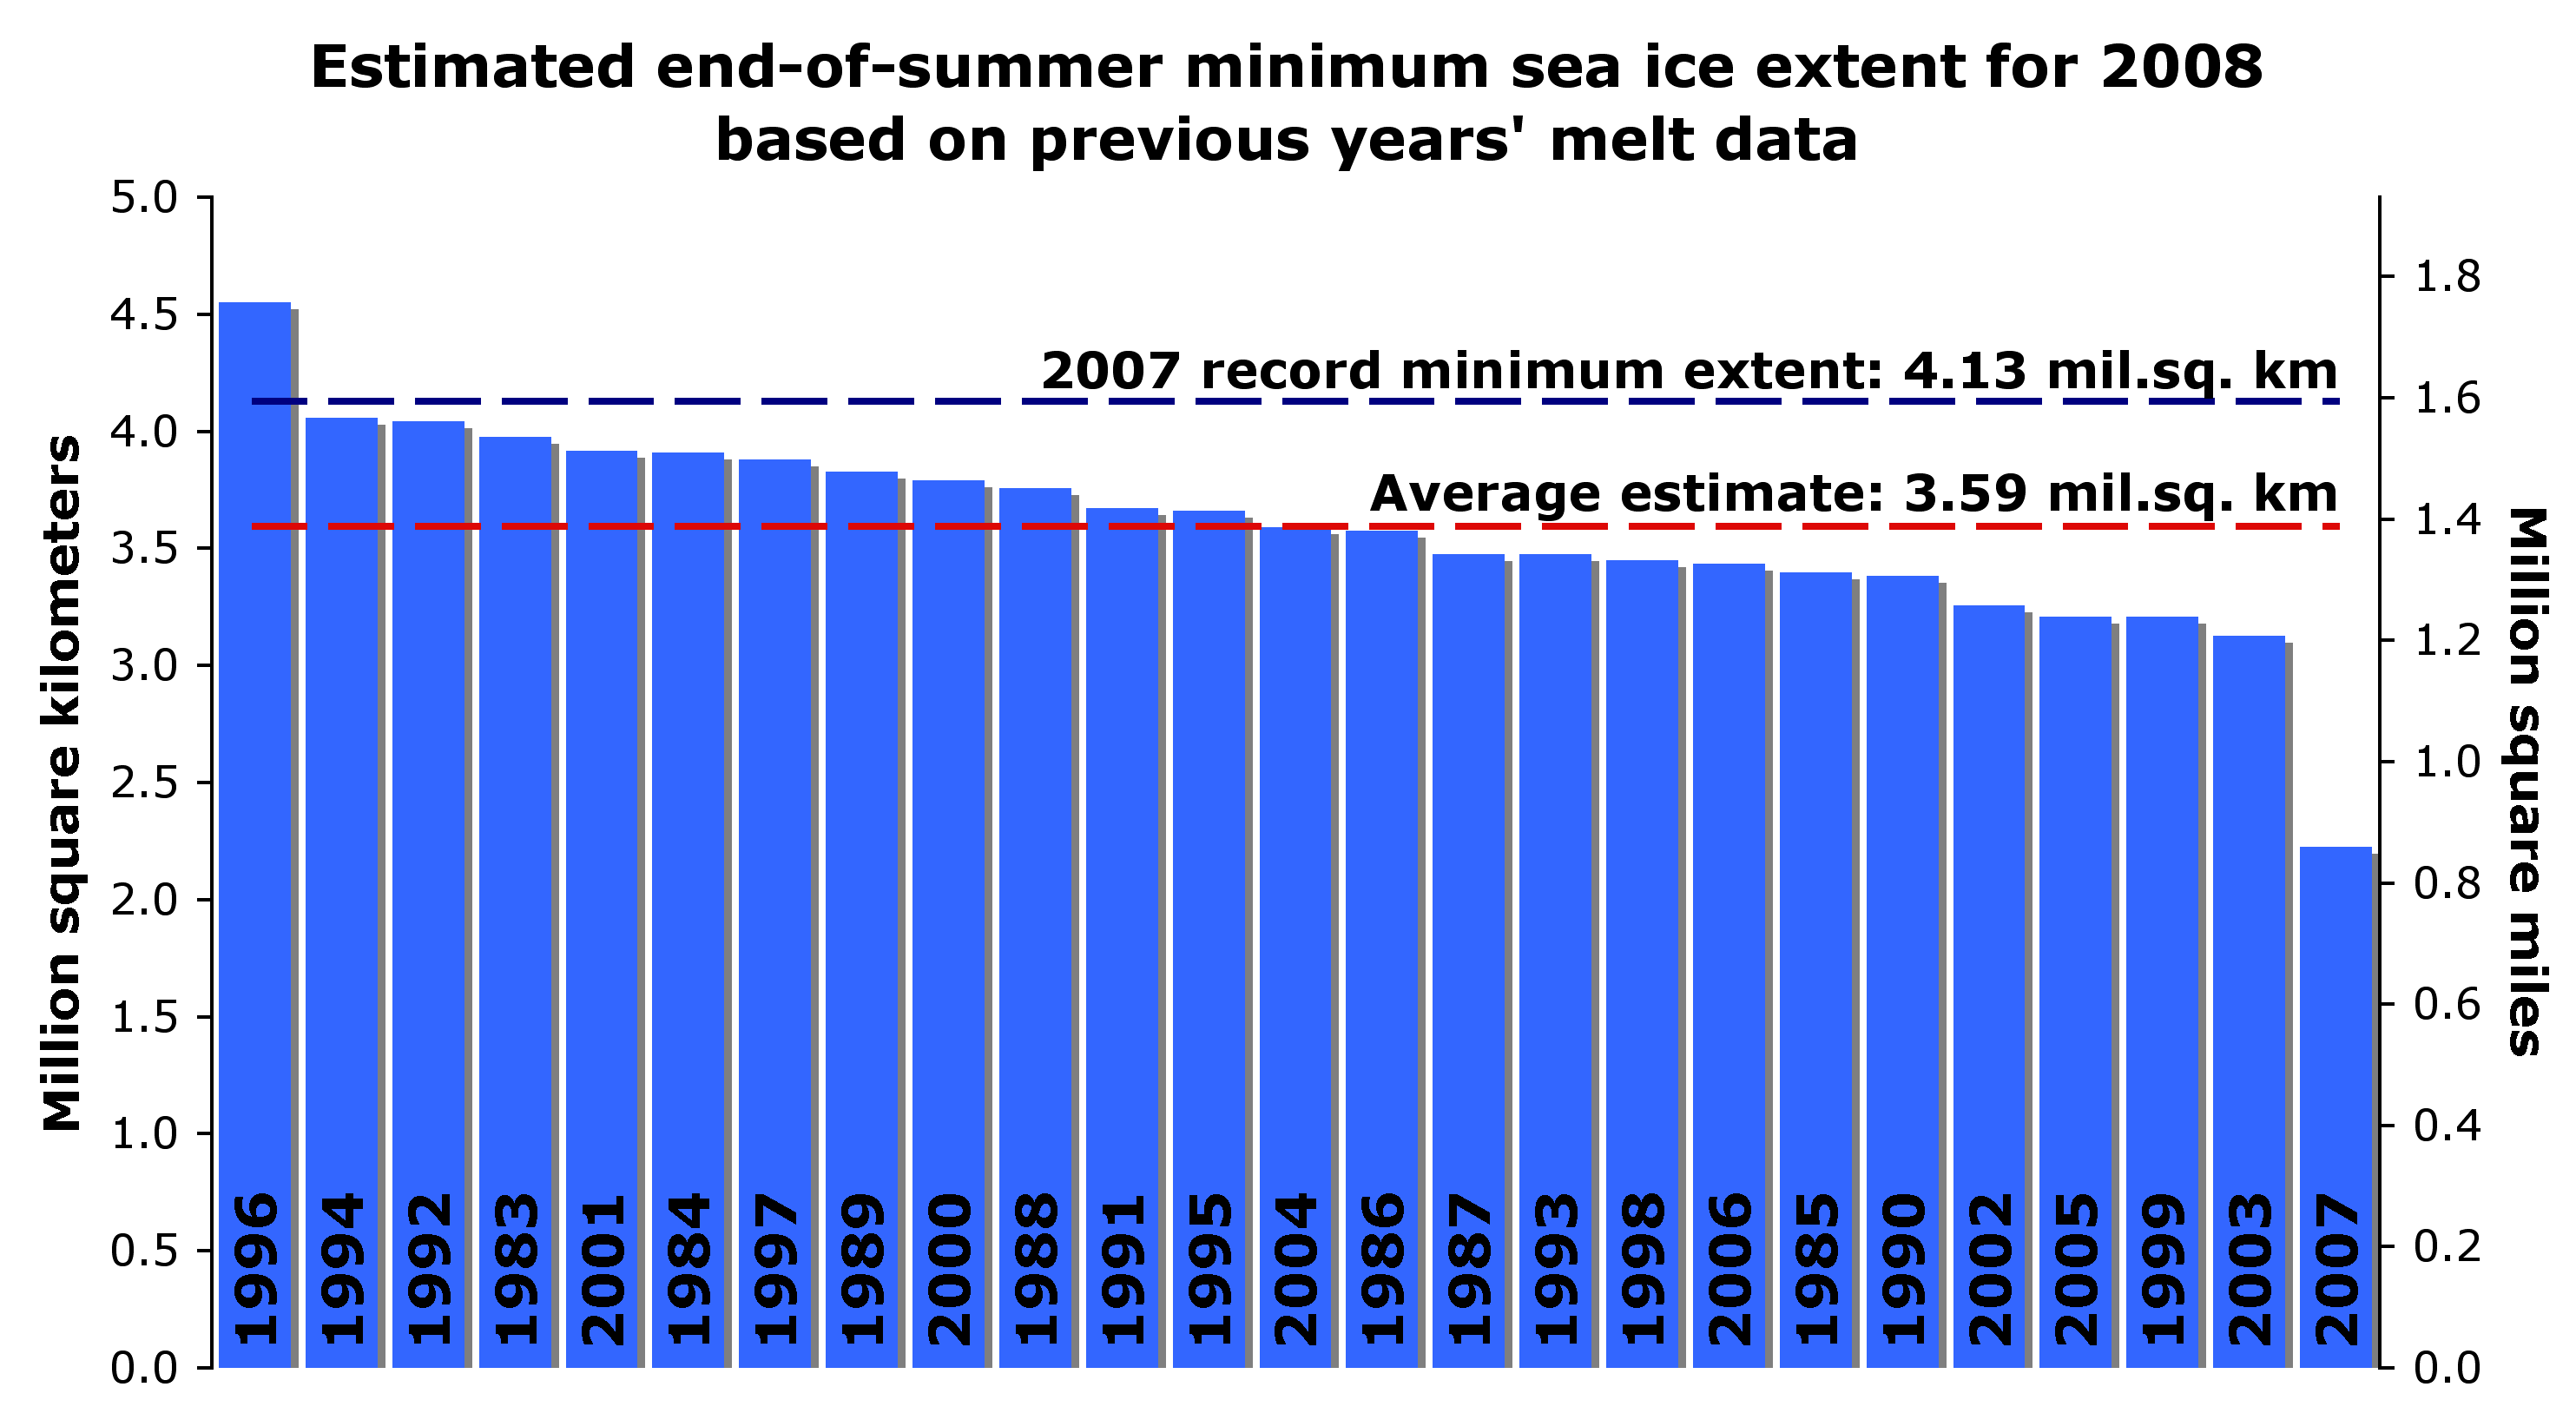
The height of the blue bar is where we will end up this year as a minimum ice extent, *IF* this year’s melt progresses like each of the last 25 years, but starting with this year’s ice extent (I think this is from April or May).
IOW, starting with this year’s ice extent, if the melt season goes as slowly as it did in 1996, you’ll get about 4.5 million at the end of the season; but if the melting goes as fast as it did in 2007, you’ll get the blue bar on the far right.
Keep in mind that this graph says absolutely *nothing* about the expectation of current weather (will it be more like 1996 or 2007, and why?), or what anomalous things could occur that have not before, or have not in those combinations… ALL that this graph does is identify a historical range (over the last 25 years) of what could happen, based on *one* parameter (rate of melting). It is a range of estimates, it is not in any sense of the word a ‘prediction’.
Basically, it’s just data.
Where is the source for this quote:
It wasn’t linked. That’s bad form.
CaM- ” Until and unless the southern hemisphere starts acting like the northern hemisphere”
That may not be too far off, the warmer deep currents are melting the underwater ice, reducing salinity and, paradoxically, increasing surface area of ice. This summer may be interesting, no? The reduction in ice depth (not visible from surface observation) is the reason for the disintegration of ice shelf this winter!
Watching the news on RAI 2 (Italian State TV) this morning, I saw that the world is about to end, ice bears ( 6,000 confirmed dead ) the North Pole is an Island, grass is growing in Alaska were last year there was 2 meters of ice, that an ozone hole the size of Europe has opened above the North Pole etc, etc, changing to Berlusconi’s Italia 1 the story was no better, It appears that Mr. Gore has started to spend his $300,000,000.
Do you have any refernce for this claim? I would be very interested in it.
The NSIDC bar graph is from their May 5th press release, which is linked to in this story. It predicts minmum sea ice extent based on survivability of first-year ice in previous years.
The problem with the graph and underlying analysis is that it didn’t take into consideration either the latitude or the actual measured thickness of the first year ice. The June 3 and July 17 NSIDC press releases discuss these problems and why the ice is melting slower than they expected.
http://nsidc.org/arcticseaicenews/2008/060308.html
http://nsidc.org/arcticseaicenews/2008/071708.html
JP,
I daily measure relative sea ice extent from Cryosphere Today maps – as discussed prominently in this article and the previous one (linked to in this article.) There has been very little change over the last four days, and based on the current ice distribution and temperature plots of the Arctic it seems unlikely to reduce much further.
It would be much appreciated if some people would read the article a little more carefully before commenting. You might also note that (as mentioned above) Dr. Meier at NSIDC has graciously agreed to answer my Arctic questions in an upcoming Q&A piece.
As far as my discussion of the earlier Arctic warm period goes, this is based on GISS temperature records and the US Weather Bureau article – again as discussed in this article.
Most of the long-term GISS station records above 60N which extend from at least 1920-2008, show temperatures as being at least as warm or warmer 70 years ago. This pattern is seen between (at least) 115W and 122E longitude, which comprises 2/3 of the Arctic. Stations around the Bering Strait show a different pattern, apparently controlled by the PDO.
Thank you for the link, the second article does mention the changes from last year but still maintains the highly alarmist tone.
I wanted the information to provide refutation to an article on Universe today:
http://www.universetoday.com/2008/08/29/satellite-images-show-arctic-ice-at-another-low/
It is just sloppy writing since the story does not back up the headline. The story speaks of forecast, the headline of current fact.
Steven:
Yes, I read your article and understood you were counting pixels from the CT maps, but I didn’t realize that was the resulting ‘chart’ from which you determined that the melting has stopped and is unlikely to melt much further, leading to your prediction that this season’s minimum ice extent will be at least 4.749+ million sq km.
However, I was under the impression that the NSIDC chart measures extent, while the CT maps shows area and concentration; much has been made of how these do not always track each other in concert.
I applaud your initiative to actually count the pixels yourself and make your own charts but, based on the NSIDC charts (the one showing the data from which the official minimum ice extent is taken each year), it still appears to me that we can expect to see less than 4.7 million sq km by the date of the minimum, which I expect is still at least 2 weeks away.
You know, it’s really quite amusing that each of us wants to say this or that about what *will* happen, when waiting just two or three more weeks will tell us what clearly *has* happened!
There is a wealth of data to indicate the North had low levels of ice in the pre AGW 1930’s and early 40’s. Science just chooses to ignore this.
Henry Larsen easily sailed the St. Roch from Halifax to Vancouver in 86 days in 1944. Through the Northern route of the Northwest Passage that is blocked this year. In 1947 the St. Roch and a large American ice breaker attempted to go through the same passage, the St. Roch from the West and the ice breaker from the east. Neither could make it.
In 1937 the Nascopie and the Aklavik combined to cross the northern route of the NW Passage.
“In 1937 the ship sailed from the East to Prince Regent Inlet and into the Bellot Strait to allow the Hudson’s Bay Company to establish Fort Ross. There she was met by the schooner Aklavik which had sailed into Bellot Strait from the West. With the historic meeting of the two at Fort Ross, the North West Passage became a reality.”
http://www.hbc.com/hbcheritage/history/transportation/nascopie/
JP,
Looking at the NSIDC graphs, it appears that melt normally bottoms the first week in September (this week.) Given that the edge is closer to the pole than normal this year, it would not be at all surprising if we see little little or no further reduction in ice extent. Perhaps even an early increase in extent because temperatures at the edge are already below freezing.
Today’s graph is again flat.
http://nsidc.org/data/seaice_index/images/daily_images/N_timeseries.png
Gaudenz:-
The link you requested, this gives a good overview of the subject
http://www.jsg.utexas.edu/walse/statement.html
i am pretty puzzled by all these references to early EXPEDITIONS into arctic waters.
that ship x (often well prepared) could to trip y (often multi years!) in year Z does NOT support your claims, that the situation was similar.
if you have real evidence that this was the case, then please bring it on!
and please try to stic to scientific papers. no chinese maps please!
There’s an article about the Arctic ice in today’s Daily Telegraph:
http://www.telegraph.co.uk/earth/main.jhtml?xml=/earth/2008/08/31/eaarctic131.xml
It claims that the North Pole has become an island that can be circumnavigated. But the map appears to be wrong. At the top, and just to the right, there is an ice-free gap on the Siberian coast. But the latest NSIDC image clearly shows solid ice in that area. Does anyone know where this image came from?
If the NSIDC image is correct then the image used in the Telegraph article is either from a different date, or does not use NSIDC data – or it has been doctored. Does anyone have any thoughts?
Chris
I’m with sod, if you don’t have satellite images to support claims of low ice in the past, it never happened.
Chris Wright – “…the latest NSIDC image clearly shows solid ice in that area…”
It is worth to note that the maps om NSIDC will show anything above 15% concentration of sea ice as white. So much of it might actually be slush. Better use the maps on Cryosphere Today
http://arctic.atmos.uiuc.edu/cryosphere/NEWIMAGES/arctic.seaice.some.000.png
or from University of Bremen:
http://www.iup.physik.uni-bremen.de:8084/amsr/arctic_AMSRE_visual.png
Temperatures around the pole have dropped to -5.5C
http://www.arctic.noaa.gov/latest/noaa1.jpg
http://psc.apl.washington.edu/northpole/30065_atmos_recent.html
I wonder how that is affecting Lewis Pugh’s kayaking?
Uk ITV News at Ten state arctic has less ice in Sept 2008 than it has had in the whole of human existence, wow.
Sod
The St. Roch with it’s little 300 HP motor and top speed of 6 miles per hour went from Halifax to Vancouver in 86 days in 1944 through the NW Passage. That is a fact. I gave an example of other boats navigating the passage in 1937 in a single year. Also a fact.
Obviously the ice was at a low level similar to today.(pre SUV)
http://www.ucalgary.ca/arcticexpedition/larsenexpeditions
Looking like the quick meltback came to a abrupt or almost abrupt halt. SO2 experiment from Kasatochi might be working. A lot of that SO2 should be converted to aerosol now. I had commented not long after that eruption about a possible early minimum on the extent because of it. Lets see what this week brings.
sod (10:04:42) asks:
if you have real evidence that this was the case, then please bring it on! and please try to stic to scientific papers. no chinese maps please!
There is the Divine Dick paper (No kidding, Mr/Ms Moderator!)
http://www.agu.org/pubs/crossref/2006/2004JC002851.shtml
“a similar shrinkage of ice cover was observed in the 1920s–1930s, during the previous warm phase of the low-frequency oscillation, when any anthropogenic influence is believed to have still been negligible”
Reply: Between that citation above and the discussion of poor Catania’s pores in the other thread, I am bemused today. ~ charles the moderator.
The St. Roch with it’s little 300 HP motor and top speed of 6 miles per hour went from Halifax to Vancouver in 86 days in 1944 through the NW Passage. That is a fact. I gave an example of other boats navigating the passage in 1937 in a single year. Also a fact.
Obviously the ice was at a low level similar to today.(pre SUV)
the St. Roche was a special arctic vessel. why are all these remarks trying to downplay this?
the conclusion that one vessel slipping through proves that the ice situation is similar to this summer, is simply false.
“a similar shrinkage of ice cover was observed in the 1920s–1930s, during the previous warm phase of the low-frequency oscillation, when any anthropogenic influence is believed to have still been negligible”
yes, and the article is comparing ice up till 2002.
http://arctic.atmos.uiuc.edu/cryosphere/IMAGES/current.anom.jpg
again, the claim that “similar situation to 2002” allows the conclusion that it was similar to today, is simply false.
i am still looking forward to real evidence for your claims!
Didjeridust,
thanks for the links. In fact the image used by the Telegraph was from the second link (University of Bremen).
Chris
Sod,/ Mike Bryant
[Snip – be nice] … as a naval design engineer any vessel (including figments of your imagination ) with a 300 hp engine would need an additional 1,000 hp plus to keep moving in slush ice, but as you rightly pointed out you require satellite photos to believe, but in 1937, 1944, the photos were under the control of Buck Rodgers and are not yet off the secrets list.