Guest essay by Steve Kopits
Mark Carney, Governor of the Bank of England, touched off a firestorm of criticism by claiming that catastrophic climate events are in store. In a speech given to the insurers group, Lloyds, Mr. Carney stated that “the catastrophic impacts of climate change will be felt beyond the traditional horizons of most actors”. The Bank of England apparently feels it can state unequivocally both the timing and magnitude of climate events well into the future.
So, let’s look at Governor Carney’s claims and how they stand up.
First of all, let’s agree on the points which are not debated.
Atmospheric CO2 continues to rise by about 2 parts per million (ppm) per year. This pace has been essentially stable for the last few decades. Atmospheric CO2 remains a trace gas at 400 ppm (0.04% of the atmosphere), up about 130 ppm from pre-industrial times. CO2 is not a poison or pollutant, but an essential part of the respiratory cycle of the planet.
Temperatures are high compared to the historical record. However, this record is limited. Comprehensive global temperature data collection only began with the satellite era, that is, from 1979. (We still lack such data if the full depths of the oceans are to be included.)
Nevertheless, we do have long-time series data for Central England, extending back to 1772. To the extent this measurement is reliable and can be extrapolated to hemispheric averages, it shows a step-up of about 1 deg Celsius from 1980 to 2005, which supports Governor Carney’s assertions. On other hand, it also shows a drop of 0.5 deg Celsius from 2005 to the present—which does not.

SOURCE: UK MET OFFICE
Satellite data tell a similar story. The temperature steps up by about 0.7 deg C from the early 1980s to 1998, but stabilizes thereafter. Thus, the satellite data shows a ‘pause’ in global warming since 1998. There has been no statistical warming in the satellite data for seventeen years.

SOURCE: DR. ROY SPENCER, UNIVERSITY OF ALABAMA HUNTSVILLE
Whether this pause will last is an open question. Temperatures have been rising at the pace of 0.1 deg C per decade since 1880. Although we have seen relatively flat temperatures since 1998, even climate skeptics would envision long-term warming will resume at some point.
Mr. Carney claims that, “[w]hile there is still time to act, the window of opportunity is finite and shrinking.” The satellite temperature record of the last eighteen years directly contradicts this statement. There has been no warming at all. And the pause is visible in other data sets as well, including in Central England temperatures, which show an outright decline in the last decade.
Sea Level
Governor Carney contends that “the rate of sea level rise is quicker now than at any time over the last 2 millennia.” Is it really?
As with just about every other metric the Governor mentions, we have data. Sea level is measured by tide gauges, and also by satellites. Satellite measurements suggest that sea level has been rising steadily by roughly 3 mm / year, which equates to about 1 foot per century.

SOURCE: UNIVERSITY OF COLORADO, BOULDER
We can cross-check this data against tide gauges, in this case, the one installed at Battery Park at the southern foot of Manhattan. This gauge has been has been in use for a very long time, since before the US Civil War. As does the satellite data, it shows an average sea level rise of about 3 mm per year. But the rise greatly pre-dates the 1950 start date which Governor Carney ascribes to anthropogenic global warming (AGW). If global warming is causing sea level rise, then this process started at least a century ago—well before more modern levels of atmospheric CO2.
Further, the last decade’s ‘pause’ is visible in this data set as well. New York sea levels have actually fallen below their 1998 peak recently. Indeed, Mr. Carney might have mentioned that sea levels at Battery Park, the epicenter of Superstorm Sandy’s tidal surge, had been falling for years at the time.

SOURCE: NOAA DATA, PRIENGA LINE FIT (6TH DEGREE POLYNOMIAL)
Importantly, sea level rise coincided with New York’s rise to power as the seat of global finance. Indeed, sea levels in New York are more than a foot higher than they were one century ago. Has New York sunk? Has it become uninhabitable? Only to those without hefty incomes. For those who can afford to live in Manhattan, it remains as high and dry as it was a century ago.
Now, is the Bank of England prepared to assert that sea level rise in New York will cease if CO2 emissions were brought to whatever level the Bank thinks is appropriate? Would the Bank suggest that New York City government should be complacent in such an event? The long-term record suggests this would be foolish advice. Sea levels have been rising monotonically in New York for a very long time. If the past is a guide to the future, we have good reason to believe a century hence sea levels at Battery Park will be a foot higher than today. And New Yorkers will be wealthier, Manhattan real estate more expensive, and the island no wetter than it is today.
If sea level rise is a problem for New York, is it not a failure of government? The current sea level in New York could have been projected with a high degree of certainty in 1940 with nothing more than historical gauge data and a straight edge ruler. If rising sea levels caught New York unawares during Superstorm Sandy in 2011, it was not for lack of data. The city had a comfortable 50 years to adjust its defenses to entirely predictable sea level rise. Any failure is a direct failure of governance. We will return to this issue later, for it is governance, not CO2, which lies at the heart of catastrophic insurance claims management.
Therefore, with respect to sea level, the data again refutes Governor Carney’s claims that “the rate of sea level rise is quicker now than at any time over the last 2 millennia.” Sea level rise has continued steadily for more than a century and a half, and indeed has fallen with the ‘pause’ in New York City. This is not to say that sea level is not rising. It is, and that is not disputed. However, in the case of New York, city government had literally decades to prepare for weather events. If it did not, then elected officials, not CO2 emissions, are to blame.
Weather-related Insurance Losses
Governor Carney’s speech deals first and foremost with the risks of rapidly rising insurance claims due to CO2 emissions. This sounds terrifying, but in fact can be decomposed into specific event types and geographies. As it turns out, not all weather events or countries are created equal.
Weather-related losses can be categorized as hurricanes and typhoons; tornadoes; floods; winter storms; drought; and fires. Of these, winter storms and fires are relatively minor sources of losses; and droughts are largely irrelevant to London insurers, as such losses are generally covered by government-sponsored programs.
Hurricanes
Rather, when we are speaking of weather-related losses, we are speaking first and foremost about hurricanes. On Munich RE’s list of top ten costliest natural disasters since 1980, earthquakes are by far the leading cause of loss and represent five of the top ten worst events. Next on the list, however, are hurricanes (excluding typhoons), taking four of the top ten positions. Of other weather-related events, only the Thailand floods of 2011 make the top ten list.
In a list of the top ten losses from hurricanes, typhoons, and floods (top ten of each), hurricanes represent more than half of all losses. If we include typhoons, this total rises to 65%. Flooding accounts for 30% of top weather-related losses, and tornadoes, a mere 5%. Thus, when we are speaking of catastrophic climate events, we are more or less speaking about hurricanes and their Asian variant, typhoons.

SOURCE: MUNICH RE NATCAT SERVICE
If we narrow this to insured losses, as opposed to overall losses (some of which are not insured commercially), the results are even more stark. Hurricanes account for 75% of catastrophic losses, with typhoons representing an additional 8%. Thus, hurricanes and typhoons represent $6 of every $7 paid out in ‘top ten’ catastrophic weather-related insurance claims.

SOURCE: MUNICH RE NATCAT SERVICE
And this in turn tells us a great deal about the nature of insurance. Where do insured hurricane losses occur? Principally in the United States. Where do insured typhoon losses occur? Principally in Japan and Taiwan. Why these places? Because all of these are wealthy countries. Hurricane and typhoon losses will be greater where there is, first, a concentration of physical assets, and second, where those assets are valuable. In other words, in the advanced countries exposed to hurricanes and typhoons.
In this, no country is more exposed than the United States. Of overall losses due to top ten catastrophic weather events, nearly 2/3 occurred in the United States alone.

SOURCE: MUNICH RE NATCAT SERVICE
Indeed, if we restrict this to insured losses (including floods and tornadoes), the US accounts for 84% by itself. Thus, if we are speaking of insured weather-related losses, as a practical matter we are speaking of hurricane damage in the US. The rest is largely incidental. For example, Superstorm Sandy caused more insured losses in one event than the cumulative and collective top ten catastrophic, weather-related losses from Europe, China, Japan and the rest of Asia since 1980. And Sandy was only the second worst insurance event in recent times.

SOURCE: MUNICH RE NATCAT SERVICE
Now, why are US losses so great? Is it due to the number or strength of storms making landfall in the United States?
In fact, there is no such pattern discernible in the data. Indeed, the last few years have seen fewer than average hurricanes globally, with a recovery to up-cycle numbers in the last year or so.

GLOBAL HURRICANE FREQUENCY
SOURCE: RYAN MAUE
Even more striking, the strength of global hurricanes and cyclones hovered near historical lows from 2009 until this past year.

GLOBAL HURRICANE ENERGY
SOURCE: RYAN MAUE
Indeed, had Carney consulted The Weather Channel, he would have found a story entitled, No Major Hurricane Has Made Landfall In the U.S. In More Than 9 Years — and That’s a New Record. Or if he had checked the internet, he would have readily found a one-by-one list of US landfall hurricanes, as presented below:

SOURCE: NOAA HURRICANE RESEARCH DIVISION
The list shows instead that the present decade is on track to be the quietist in the historical record. Our good luck is unlikely to last, but the assertion that hurricanes are somehow increasing, or at least increasing in the United States, the principal source of insured losses, is completely unfounded.
Rather, reinsurance data hints at the source of losses: higher payouts for assets in harm’s way.

INSURED LOSSES AS A PERCENT OF OVERALL LOSSES, TOP TEN LISTS, 1980-2014
SOURCE: MUNICH RE NATCAT SERVICE
The ratio of insured to total losses are the highest for hurricanes in advanced countries. For example, the insurance payout ratio for US hurricanes was 51%, for those in Japan, 45%. By contrast, in the rest of Asia, typhoon payouts equaled only 6% of losses. Payouts were also lower for floods, both in advanced and emerging countries. In advanced countries, the payouts averaged 14%, which in developing countries, it averaged a mere 1% (excluding the major floods in Thailand, which would have brought emerging averages to advanced country levels).
Further, more and more expensive assets are exposed to hurricanes in particular. In the US, for example, ever more people are living on the coasts, and beach front property has become prized and expensive. One need only look out the window on a flight approaching Miami International Airport to be appalled at the sheer concertation of high-end housing built just above sea level on islands dotting Florida’s Atlantic Coast. How long until a hurricane wipes a good number of these off their foundations? And what kind of insurance losses will that involve?
Indeed, an examination of catastrophic losses suggests a decisive role for government policy. Hurricane Katrina, which destroyed New Orleans in 2005, represents alone more than one-quarter of all insured top ten losses globally since 1980. In just one event.
Why was Katrina so destructive? Katrina was only a Category 3 hurricane when it hit Louisiana. A Category 3 storm is strong, but certainly nothing unprecedented in that part of the world. New Orleans had—and has—good reason to expect a punishing hurricane once every generation. TheTimes-Picayune, a New Orleans newspaper, notes that the city has been ravaged “repeatedly by hurricanes during its 200-year history, with the first major hurricane in 1722 destroying nearly every structure in the four-year-old village, including its only church, parsonage and hospital.” Hurricanes are nothing new or exotic in New Orleans. The city has been destroyed by such events more than once and far before modern industrial times—by hurricanes entirely unrelated to global warming.
No, New Orleans was destroyed in 2005, first, because the levees failed, and second, because much of the city was built below sea level. Therefore, if the levees failed, the city would be lost. Who was responsible for the levees and zoning? The Federal and local governments. Had the levees held, no doubt the losses would still have been formidable, but perhaps two-thirds less than those actually incurred. Government failure made a fairly routine, if damaging hurricane, into the worst weather-related event in history.
The catastrophe of New Orleans was a failure of politics. Governor Carney might have made that point. He might have mentioned that, had the levees held in New Orleans, the insurance sector would have been spared costs greater than the total of all catastrophic weather-related claims in Europe, Japan, China and the rest of Asia since 1980 taken together. Climate is not the greatest source of risk in catastrophic insurance claims. Weak and politicized policy-making is.
Upon closer analysis, Governor Carney’s claims of higher losses from stronger storms are not supported by the data. The number of hurricanes is not increasingly, nor is their intensity. Indeed, the US, by far the leading cause of insured hurricane losses, is currently seeing a hurricane drought. Losses are nevertheless increasing over time, because the country has concentrated valuable assets in harm’s way. And that is the general rule: As a country becomes more wealthy and insurance more prevalent, losses will increase—even if the frequency and intensity of hurricanes do not.
Floods
In the US, flood damage is tracked by the US Weather Service (NOAA). The Weather Service endeavors to collect yearly data related to fresh water flooding (ie, not a tidal storm surges). It is not entirely clear whether there is overlap with hurricane-related rain events, but in any event, the Weather Service provides a solid approximation of US losses.
NOAA data indicates that annual flood losses averaged $8 bn (measured in 2014 dollars) over the last 30 years. More recently, from 2007 to 2014, losses averaged a modest $4 bn per year. However, as with other catastrophic events, the occurrence of rains and damages is unpredictable. For example, 2005 saw $55 bn in damages (which one has to image were at least partially related to several landfall hurricanes that year).

SOURCE: NOAA HYDROLOGIC INFORMATION CENTER, PRIENGA GDP ADJUSTMENT USING US FEDERAL RESERVE DATA
NOAA presents flood-loss data in inflation-adjusted dollars, and this is commendable. However, we also need to acknowledge that the US economy is much bigger than a century ago. Indeed, the US economy in 2014 was literally 15 times the size of the economy in 1930. With a vastly larger economy, a substantially greater asset value is placed in harm’s way. Therefore, we should by rights adjust for both inflation and economic growth. If we adjust accordingly (ie, adjust in terms of nominal GDP growth), then flood losses have fallen by half every 15 years or so, and now average around $10 bn per year, with a continued declining trend.

SOURCE: NOAA, DATA WITH PRIENGA ANALYSIS
Once again, we see nothing in the data which leads us to believe that flood losses are increasing at some exponential rate.
Drought
There is no doubt that California is seeing a major drought, probably the worst in recorded history. However, until 2005 or so, there is no visible trend in California rain or drought conditions as recorded on an annual basis and using the widely accepted Palmer Drought Severity Index. Is California’s drought the result of climate change, or just a historically bad drought?

SOURCE: NOAA VIA MONTEREY COUNTY GOVERNMENT
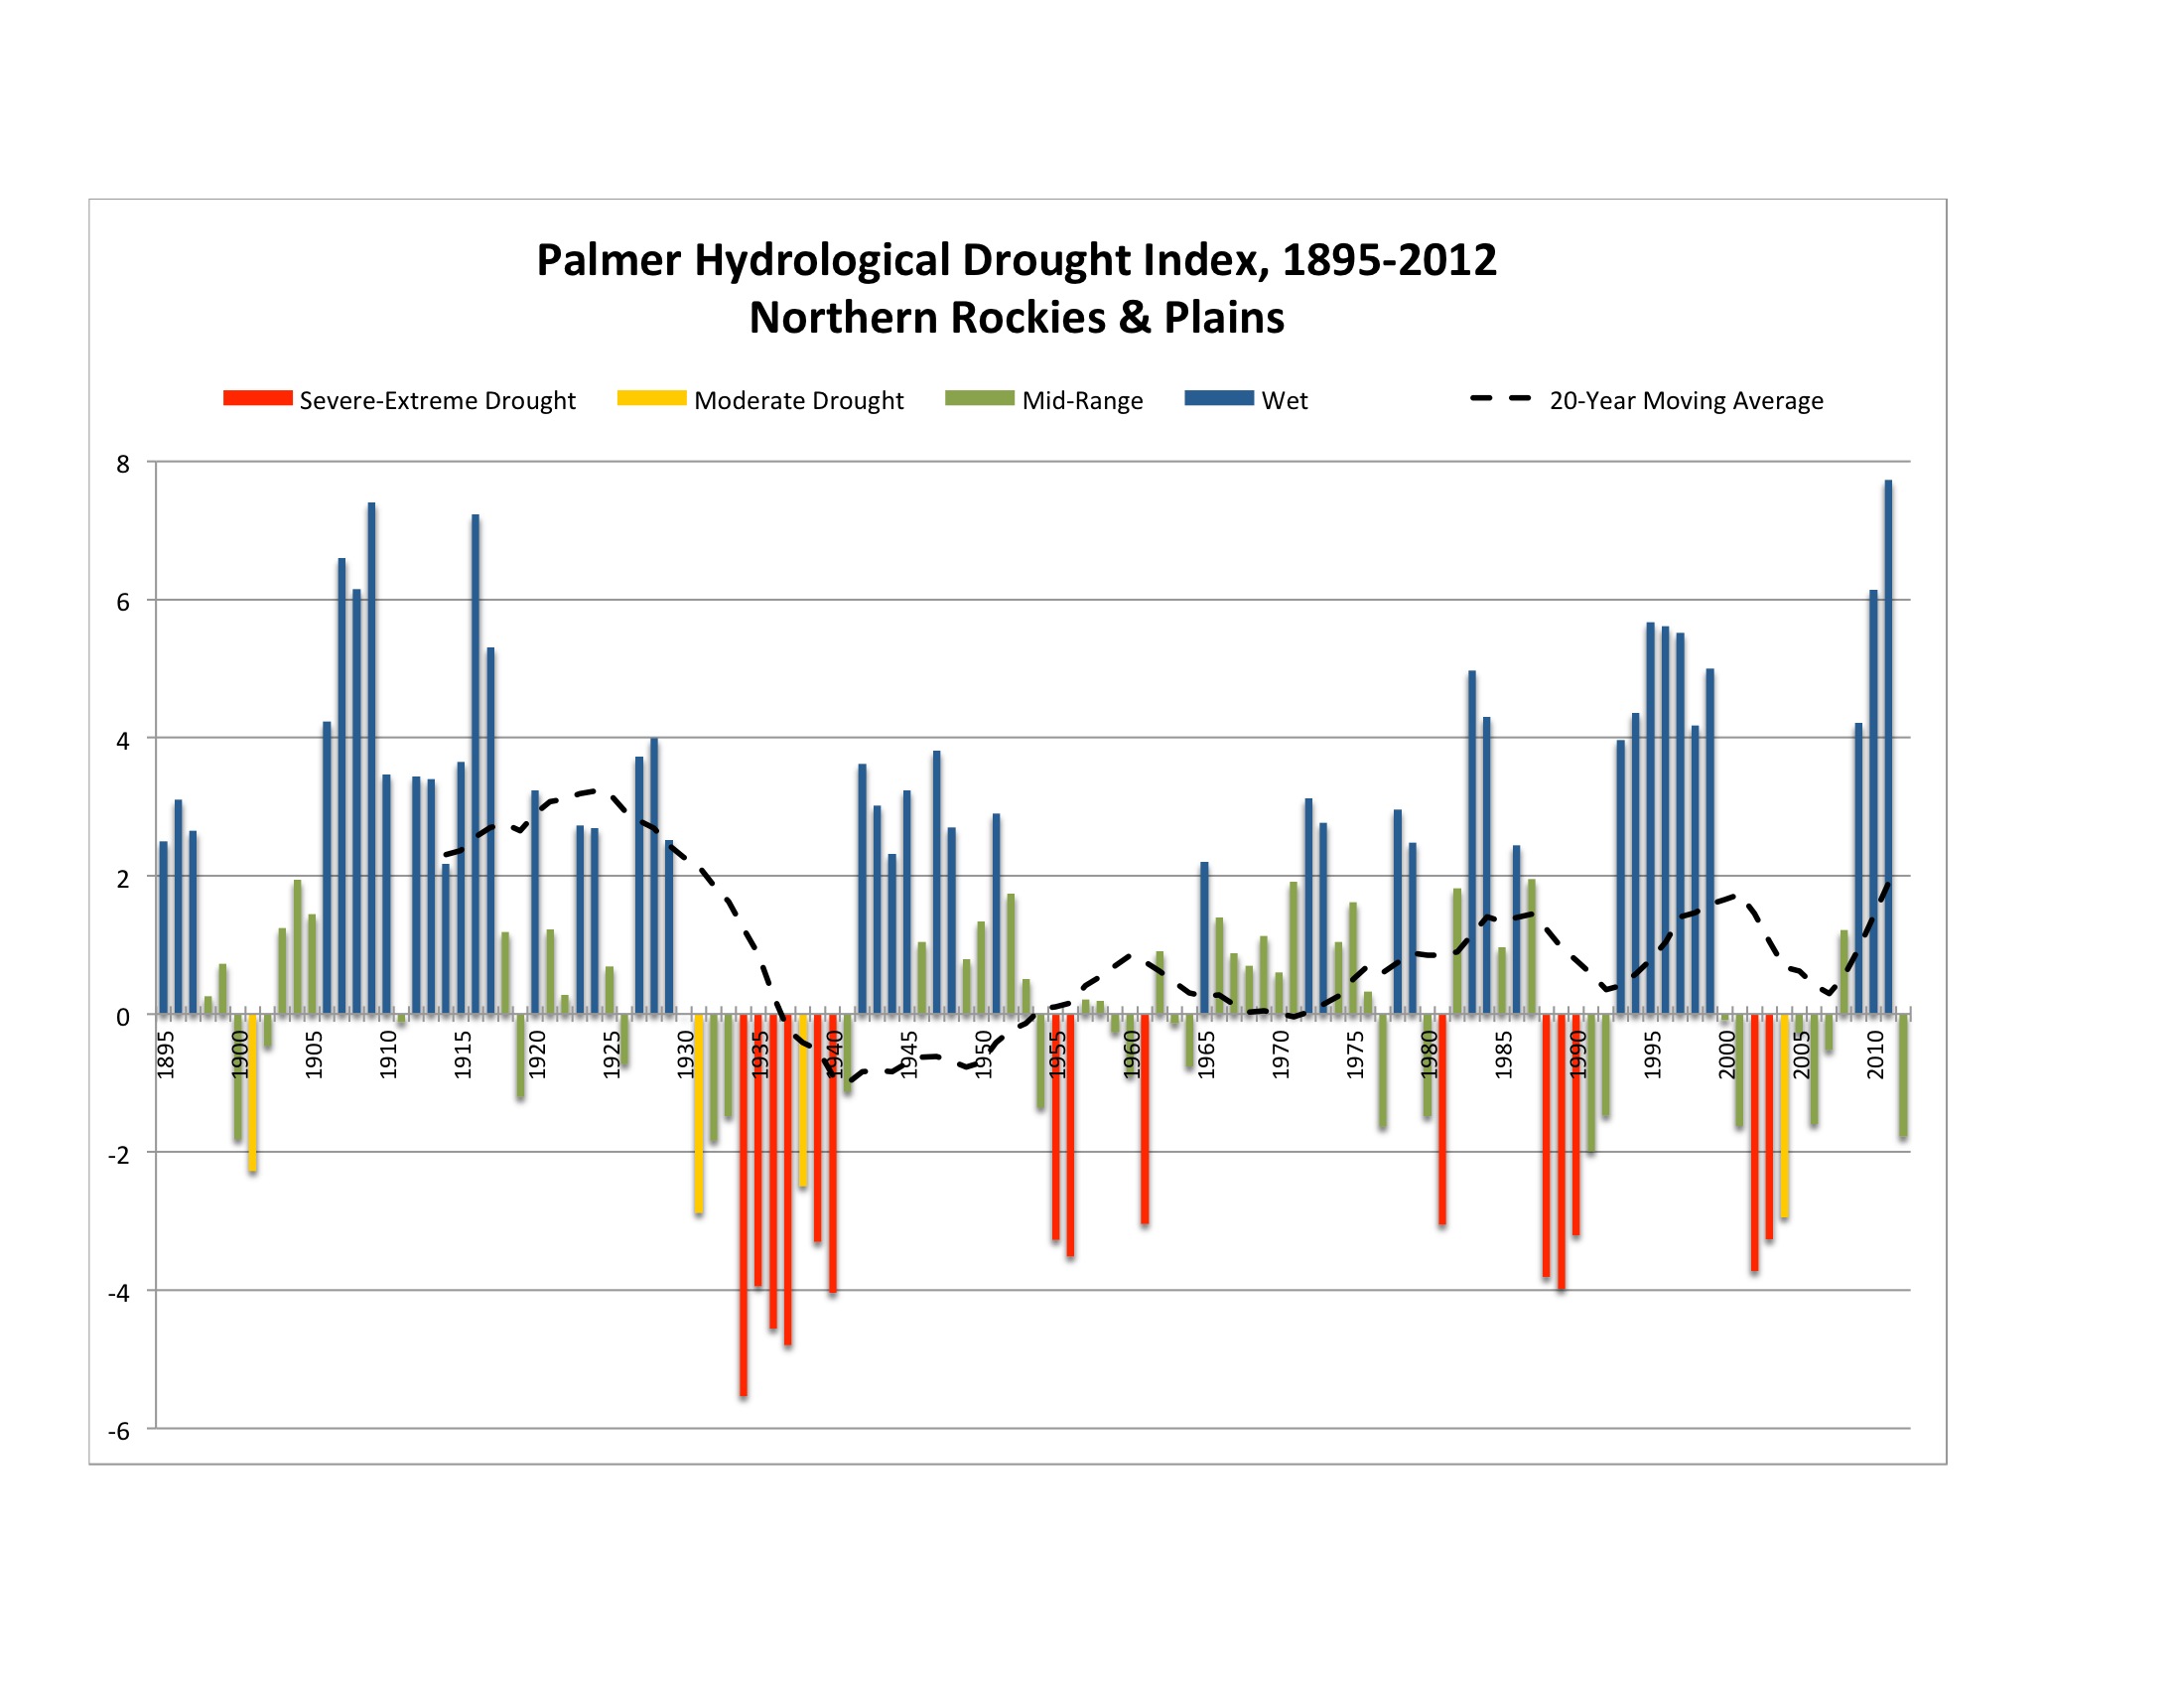
If we consider the Great Plains and Rockies, an area not currently under drought conditions, we can see the historical pattern more clearly. During the Dust Bowl of the 1930s, the US saw its worst drought in recorded history. Conditions were far worse than those in California today. Similarly, the center of the country saw droughts in the 1950s and again in the late 1980s. These events are episodic, and no trend is readily identifiable in the data.

SOURCE: NOAA VIA MOGREENSTATS
The story is similar for the country as a whole. There is no visible trend is apparent in the data over the last 120 years, and as above, the droughts of the 1930s and 1950s are readily visible in the data.

Tornadoes
Tornadoes, like hurricanes, are essentially a US phenomenon. These are measured on the Fujita scale, from 0 to 5. F0 tornadoes count more as bad storms, with “branches broken off trees; shallow-rooted trees pushed over; sign boards damaged,” according to NOAA. An F1 tornado produces ‘moderate damage’, with wind that “peels surface off roofs; mobile homes pushed off foundations or overturned; moving autos blown off roads.” In the center of the country, this might constitute ‘moderate damage’. In New Jersey, where I live, it would constitute something of a disaster. Tornadoes rated F3 and above are considered ‘severe’, and according to the Fujita scale, F5 tornadoes can shoot “automobile-sized missiles…through the air in excess of 100 meters.” An F2 tornado would have wind comparable to that of Superstorm Sandy; however, the path of damage would be typically much more limited.
How have tornado numbers evolved?
The number of recorded tornadoes since the 1950s has risen dramatically, although total numbers declined precipitously from 2010 to 2014.

SOURCE: NOAA
However, if we exclude F-0 tornadoes, then in fact the count is flat, and by some measures, down. As a broad generalization, we might consider the count of F1+ tornadoes largely without meaningful trend up or down.

SOURCE: NOAA
If we narrow the analysis to just the most destructive tornadoes—those rated F3 and higher—frequency appears to have actually declined since the 1970.

SOURCE: NOAA
Why then the increase in F0 tornadoes? As noted above, F0 tornadoes are essentially indistinguishable from strong storms. With today’s Doppler radar, even weak tornadoes can be detected. In 1950, particularly in remote areas or if they occurred at night, weak tornadoes probably passed unnoticed or unrecorded. Thus, the increase in F0 tornadoes, when F1 and stronger tornado counts are flat to down, suggests simple detection bias. The number of F0 tornadoes has in all likelihood not increased compared to 1950, we can simply identify them better.
And even if F0 tornadoes had increased, they would be relatively inconsequential for catastrophic insurance purposes. Tornado damage, while spectacular, is not particularly large in dollar terms, for the reason that tornadoes typically take a narrow path. The destruction is severe, but geographically limited, unlike a hurricane. The US Census Bureau estimates that US tornado damage averaged around $2 bn per year from 2008 to 2010. For a country like the US, this is a minor outlay.
Nor has tornado damage increased. A study by Roger Pielke Jr., professor of environmental studies at the Center for Science and Technology Policy Research at the University of Colorado, concludes that normalized tornado damage has not increased since the 1950s. I would note, however, that damage can be quite severe in any given year, as it was in 2011.

SOURCE: ROGER PIELKE
Again, the data squarely contradict the assertions of the Governor of the Bank of England. If Mr. Carney is arguing that tornadoes are becoming more frequent, severe, or damaging, he is flatly contradicted by the recorded data in the US.
Wildfires
With drought and heat, wildfires look to have a record year in the US in 2015.

Although they make for great television, wildfires are not a huge sources of insured losses. According to the Insurance Information Institute, “over the 20-year period, 1995 to 2014, [in the United States] fires, including wildfires, accounted for 1.5 percent of insured catastrophes losses, totaling about $6.0 billion, according to the Property Claims Services (PCS) unit of ISO.” Wildfires are certainly exacerbated by drought, high temperatures, and wind. However, the intensity of such fires has become much more severe due to the practice of…putting out wildfires. In much of the US, wildfires are a natural and necessary feature of the landscape. Indeed, flora have evolved specifically to resist fire or germinate as a result of wildfires. Notwithstanding, in the last century, US forest management practice has emphasized fire suppression, such that a good bit of US wilderness is now at great risk of catastrophic fire. This problem is hardly new. The US Government Accounting Office prepared a report on the matter back in 1999:
The most extensive and serious problem related to the health of national forests in the interior West is the overaccumulation of vegetation, which has caused an increasing number of large, intense, uncontrollable, and catastrophically destructive wildfires. According to the Forest Service, 39 million acres on national forests in the interior West are at high risk of catastrophic wildfire. Past management practices, especially the Forest Service’s decades-old policy of putting out wildfires on the national forests, disrupted the historical occurrence of frequent low-intensity fires, which had periodically removed flammable undergrowth without significantly damaging larger trees. Because this normal cycle of fire was disrupted, vegetation has accumulated, creating high levels of fuels for catastrophic wildfires and transforming much of the region into a tinderbox.
To this is added the expansion of housing into formerly remote areas. Some of this is quite upscale. For example, the actor Tom Cruise recently put his Colorado vacation home on sale for $59 million. In the event it were lost in a wildfire, it would be quite a claim.

TOM CRUISE’S $59 MILLION COLORADO GETAWAY
SOURCE: AOL REAL ESTATE
Thus, fire losses are insignificant as a percent of total weather-related losses, and likely to stay that way. To the extent they are growing, a warmer climate no doubt plays a part, but the principal factors are side-effects of Forest Services practices for decades, on the one hand, and the encroachment of residential properties—some of them quite expensive—on formerly wilderness areas.
Summing Up
Is his speech London’s insurance community, Mark Carney, Governor of the Bank of England, asserted a series claims about climate change. Some of these are widely accepted. The climate does change. The world has warmed. Atmospheric CO2 has increased, half of the increment due to human activities.
Beyond this, there is no consensus, and indeed, the available data in many cases directly refutes the Governor’s more extreme assertions. There is no consensus that humans are the primary drivers of climate change. As we can see, sea levels, for example, were rising well before the 1950s date Carney gives as the start of modern anthropogenic warming.
Importantly, the increase in losses since the 1980s is more likely to reflect expanded insurance coverage, increasing payouts as a percent of losses incurred, and an increased number of assets with higher values placed in harm’s way. Losses increases have not occurred due to increases in hurricane, tornado, flooding, drought or fire frequency or strength, at least not in the United States, which represents the lion’s share of insurance claims. In many cases, either frequency or intensity of weather-related events has actually declined. Sea level rise has not accelerated, not as measured by either satellites or tide gauges. Sea level has been rising for well over 100 years, and continues on that pace.
Like so many other economists, Governor Carney seems to operate under the assumption that current CO2 levels are just on the edge of some catastrophic acceleration. For some reason, 320 ppm of atmospheric CO2 is safe, but 540 ppm is not, because there is some precipice—an inflection point or boundary—between here and there. The limit is not 1,000 ppm, or 5,000 ppm, or 42,448 ppm, but right here, right now. A little more CO2, a trace more of a harmless trace gas, and we are doomed.
The climate is complex and the future uncertain. It is possible the worst fears may prove correct. Nevertheless, such an assertion is not supported by the historical data, not for US droughts, floods, tornados, hurricanes or fires. But it does show up. In politics. If sea levels were 20 cm higher in New York and this contributed to the damage from Superstorm Sandy, well, any middling analyst could have predicted the rise back in 1940, just as we can predict today that sea levels will be one foot higher a century hence. The failure was not of CO2 emissions, but squarely a failure of governance. And that goes doubly so for the fate of New Orleans. If Governor Carney wanted to make a constructive proposal, he should have called for Lloyds to create macro audits of risk zones and censure or refuse to insure jurisdictions where governance is not up to par. If insurers had refused to insure New Orleans unless the levees were sound, they could have saved themselves $30 bn in payouts and probably twice that in losses.
As an analyst, I find Mr. Carney’s speech is truly dismaying. For the Governor of the Bank to claim that climate change is leading to rapidly rising insurance claims is, at best, a critical failure of analysis. As discussed above, insurance claims are a function of a number of factors, including the type and country of the weather event, as well as the extent of insurance coverage and payout ratios. A hurricane in the US may see one hundred times the payouts of a major flood in India. Payouts will rise as a function of nominal GDP, as both inflation and the value and concentration of assets will play a crucial role in overall losses. The specific path of a storm can also be decisive for global averages. It goes without saying that a storm which strikes in Philadelphia, marches up the New Jersey coast, slams into the Manhattan and turns towards New Haven is going to cost a bundle. That same storm hitting, say, rural Mississippi would cause a fraction of the monetary damages. And this matters, because Superstorm Sandy caused more insured damages than all the leading weather events in Europe, Japan, China and the rest of Asia combined. Single events can move long-term global averages.
If the Bank missed this, it is not because the necessary data is hard to find. Information on weather-related events is readily and publicly accessible on the internet. Almost every graph I use above relating to hurricanes, tornadoes, floods and droughts comes from the US government itself. Apparently, the Bank of England could not be bothered to consult the underlying climate data before making hyperbolic claims. Thus, at best, the Bank was careless with data analysis.
A worse interpretation of events suggests that Mr. Carney was willing to blindly accept the conventional wisdom, the ‘consensus of scientists’ regarding global warming, without any will or curiosity to dig deeper and form a personal view. One can only hope that monetary policy in the UK is not informed by such superficiality or passivity.
The very worst interpretation is that Mr. Carney is in fact aware of the source data, but chose to make hysterical claims to promote a personal political agenda. I cannot imagine a more ill-considered idea. For those of us who consider central bank independence sacred, the appearance of a national bank taking sides in a highly charged political debate—and doing so with scant regard for the underlying data—will establish the Bank of England as partisan and the political opponent of conservative politicians. Given that Janet Yellen, the Chairman of the US Federal Reserve Bank, hails from Berkeley, a hot bed of climate activism, should the Republican Party consider the Fed also its opponent? If so, I can assure you, the Republicans will find some support to ‘audit’ the institution.
At the end of the day, political neutrality is a pre-condition for central bank independence. If a political party deems the central bank to be an opponent, then it will take measures to gain political control over the bank, with the result that monetary policy itself may become politicized. If the Bank nevertheless feels compelled to champion a particular side in a political debate, its analysis must be water-tight and its communication, impartial. That Governor Carny violated both dictums is simply stunning and a huge blow to the prestige of the Bank of England. It was a very bad call indeed.
Reblogged this on Norah4you's Weblog and commented:
Some persons never learnt basic facts re. our Earth…. normally this would have been their problems…. but when same persons ending up as leading person or persons in Society, no matter where, that’s a catastrophe in itself…
Save-the-planet eco-lunacy is now an airborne phenomenon. It affects otherwise sensible people who, if they had a decent knowledge of basic science, would shudder at the abject stupidity of their utterances.
Carney’s utterances were sliced and diced here, clearly demonstrating that he should stick to his area of expertise and not venture as an ignoramus into the realms of science, also good advice for the likes of Michael Mann.
His area of expertise and primary concern is the UK economy. Since Thatcher destroyed its industrial base, the economy has been totally dependant upon the insurance and financial services sector. So the Bank’s role as guardian angle of the UK economy is centred on the interests of this sector.
Steve Kopits:
These people are not hysterical but do know how turn a profit. What Mr. Carney’s public statement does is prepare the way for increased insurance premiums on the pretext of AGW. In fact, it is an invitation to so. This will help the City of London, one of the centres of world insurance and hence the UK economy.
Just like all the parasites in the new climatology industry, he knows how to spin the data to ensure more income.
What arrant nonsense, The UK economy is not “totally dependent” on any one sector and to suggest that the necessary shaking out of the feather bed in the 1980s “destroyed the industrial base” of the country is ludicrous.
It is consdierably more likely that Carney has been brainwashed by his wife just is Cameron almost certainly has been by his.
I never knew that a couple of out of date coal mines was the entirety of UK’s industrial base.
More likely the facts emmenâtes from his wife.
“Stick to his area of expertise ” ? Idiots in, Idiots out, you got it wrong Peter, check your dictionary for a explanation of expert !!!
Expert (ex-spurt): an old drip under pressure.
I’m glad we got rid of him and you guys have him now. His wife is a greenie and I have no doubt the she and probably him too have much personal wealth invested in the global warming scam.
Perhaps somebody could look deeply into that.
Ditto, double ditto, triple ditto, quarduple ditto,….
He will, hopefully, no longer have ANY influence on the Canadian economy.
Nothing like venting a spleen Steve. I’ll be reading this for the rest of the week. One observation: Mark Carney is a Canadian, home brewed by the the Canadian leftists. He is an economist out the left wings of Harvard on top of being a socialist. He doesn’t know a thing about science.
He likes the UN, and the IPCC. He is simply a wealthy aristocratic opportunist that believe people should be taxed more so that money can be given to the left’s power base.
His prognostications can’t be taken seriously, as with Pope Francis. They are out of their depth.
That being said, I will read all of your article.
Agreed. I think another relevant observation is that, for some time before Carney was overpromoted to his present position, he was the BBC’s Economics Correspondent, appearing practically daily on the main radio “news” channel, Radio 4, at peak times. As such, he has had plenty of indoctrination, and practice, in spreading climate alarm.
I do not think Mark Carney ever worked for the BBC, perhaps you are thinking of Martha Kearney?
The term used in years gone by was that he has reached his “Peter Principle”.
Just what is a superstorm?
A Superstorm is a super-duper killer Cat IV hurricane that barely measured out as a tropical storm, and not a hurricane at all, when it went over the Cape Fear weather station on first landfall. The super hurricane had to be quickly rebranded as a super storm because it was not a hurricane anymore, and thus the term “superstorm” was born. You must admit, “superstorm” sounds much more exciting than “rainstorm”.
TonyL, well said.
Another way to look at it is this:
An elderly woman pranced through the hall of her nursing home in a flimsy nightie smiling at each hunched or wheel-chair borne man shouting, “Supersex!” Supersex!” She stopped in front of a man hunched in his wheelchair and again offered, “Supersex!” He replied, “I’ll take the soup.”
A Superstorm is what you call it when a hurricane doesn’t live up to expectations, and even if it did, there is nothing you could do about it anyway.
IIRC the number of named hurricanes has been decreasing, especially large ones. Hurricane Wilma was the last Cat 3 (or greater) to make landfall in the US, and that was 10 years this month.
So they had to coming up with a new PR strategy and invented the sinister sounding “Superstorm”. It’s all about the marketing and scare mongering.
“storm” vs “Superstorm” is kinda like “model” vs “Supermodel.”
Ah, you mean airbrushed to within an inch of its life ?
Sandy did not qualify as a hurricane. Notwithstanding, it caused the second largest overall weather-related loss in the historical record. So it was more than just a storm, but cannot be formally classified as a hurricane. Hence, the media settled on the term ‘superstorm’, and I also accept that description.
The term superstorm is unofficial, and was used by the media then picked up by everyone including Govt institutions. Sandy went from storm to hurricane to storm back to hurricane a few times during its Atlantic peregrinations. It was the second costliest storm of all time and the largest recorded Atlantic hurricane. Unusually it merged with an Atlantic frontal system and turned left, into the mainland instead of east into the Atlantic. There is no meterological term “Superstorm” – this is just a nickname. Since Sandy unoubtably was a hurricane when it struck some places (Cuba, Jamaica), and then not a hurricane when it made landfall at USA, it seems a reasonable nickname.
Storm Of The Century and The Perfect Storm were already taken, so they are just working through the litany of such words as they can conjure.
Anyone ready for a Hyperstorm?
Great essay!
Unfortunately not only the BOE is taking a Carney view of CO2, lots of other banks are as well. Many funds, banks and governments are selling down investments in coal, oil and mining projects and this may mean a significant stutter in our standard of living as we grapple with a future energy crisis.
“Selling down” means there is a buyer. Who’s buying all these tainted assets? Could it be the old chap’s Blind Trust Fund?
Exactly what the insurers group wanted to hear. Put the premiums up; blame it on global warming. Makes you wonder who he is working for..
It used to be just fire insurance. Now people have “insurance packages” Maybe it will be back to affording only fire insurance.
Perhaps spousal influence came into play:
http://ecoproductsthatwork.com
Mark Carney should stick to his job description and quit looking like a fool.
The pre-industrial level was a lot higher than 130. 280?
Oh, up 130… Never mind.
How is this partisan in a place like UK where all parties agree that the sky is falling and its rich people who are causing it. Indeed, it’s a perfect situation for a lefty economist bank head to make such claims. What UK needs is a real opposition. They are so crowded and overlapped well to the left of center zone, that Karlny Marx’s best seller harmonizes with everybody.
Yes. Right on. And not only the UK.
Do you mean when the oceans begin to boil as the sun swells into its Red Giant phase? If so, I agree. The long term trend is just cyclical warming and cooling at all shorter time scales of relevance (diurnal, annual, multidecadal, millenial, glacial-interglacial). Or unless you mean the man-made tampering of temp data , I.e. Karlized PauseBuster adjustments.
“as the Sun swells into its Red Giant phase”
The climate models go up exponentially. It is quite clear by now that the temps won’t be able to catch up no matter what.
The only question is whether as the Sun swells into its Red Giant phase temps will catch up with the climate models or not.
Very likely, not, since by then the climate model temps will be in a nonphysical range.
By that time CO2 should have vaporized the planet, then flown off through space to terrorize Venus and Mars.
Didn’t you know? The increase of CO2 on Earth will heat up the planet so much that it will cause the Sun to go into the red giant stage.
When the Sun becomes a red giant, some idiots will still blame it on CO2.
But of course! All those millions of years of “back radiation” …
Thanks for the essay.
While CATO guessed that Ocean Acidification might be the prevailing fire breathing dragon in the run up to Paris, seems that sea level rise is winning for now:
http://phys.org/news/2015-10-sea-swallow-miami-orleans.html
(sad, but you can leave fun comments for editors without your email address)
I think the scammers are failing to display imagination.
Combine the two scarys = Catastrophic Acidic Seal Level Rise.
The penultimate paragraph at that phys.org link tells you everything you need to know about it.:
According to earth scientist Michael Mann, a well-known author on climate change, the latest findings are a “useful contribution to the literature.”
the 87-page report by Bank Of England for the Insurance Industry BofE governor, Mark Carney, was launching when he made the speech:
87 pages: Sept 2015: Bank of England Prudential Regulation Authority: The impact of climate change on the UK insurance sector
A Climate Change Adaptation Report by the Prudential Regulation Authority
http://www.bankofengland.co.uk/pra/Documents/supervision/activities/pradefra0915.pdf
I principally reviewed Carney’s speech. Had I extended the review to the report, my analysis would have been more critical.
I have in front of me a graph called:
Accumulated temperatures during the growing season in Month/degrees. 1747 to 1950. From a location in the north of England.
It is from a book called Climate and the British Scene by Gordon Manley. Publisher Collins. 1953.
The relevant section does NOT tally with Parker et al. 1992 from the UK Met Office who appear to have done a few of their adjustments!
Have you tried turning the book upside down?
Wow, your right…we’re doomed!
What other reasons could be behind bankers and insurance executives buying into the most extravagant claims of climate alarmism, besides strictly political concerns? Higher insurance rates, perhaps?
I think green organizations realized a year or so ago that it would be a brilliant stroke to get leading financial types and other establishment figures to on board, as they would have credibility with right-of-center types. (For years I have been worried that greenies would realize this, but I didn’t mention it here, because I didn’t want to give them ideas.) I think they approached such figures and blitzed them with propaganda. (I doubt they’ve done much reading on the topic on their own.) Examples in the US include ex-Treasury Sec. Paulson and a couple of other similar bigshots.
The only provable outcome of global warming is the severe mental incompetence demonstrated by leaders.
Mark Carney’s behavior and statements are indisputable proof of this affliction of mental incompetence. At the Paris summit the mental incompetence will reach such a crescendo that the global implications of the mental incompetence affliction will have to be addressed. Perhaps an island can be set aside so those leaders afflicted with AGW mental incompetence can be given a safe place where they can have milk and cookies and told soothing CO2 fairy tales.
Perhaps an island can be set aside so those leaders afflicted with AGW mental incompetence can be given a safe place where they can have milk and cookies and told soothing CO2 fairy tales.
England?
Antarctica.
They can sit atop the ice and debate about how long it will take to melt.
Re: “Mark Carney should stick to his job description and quit looking like a fool.”
Sound advice. But it comes too late.
If a man does not know the limits of his own expertise, then he is no more use than a man who has no expertise, at all. Carney has now revealed himself to be either the former or the latter.
It is not hard to make some evidence-based analysis of trends in extreme weather phenomena.
Especially not, if a person focuses their attention on widely available graphical representation of the data, as shown above. Just include the word “graph” in the search title and confine the search to Google Images.
Carney is clearly suffering from the condition that should be known as “expert arrogance”. A condition born of excessive confidence, in which a person feels that they can make proclamations of truth based on a combination of snippets watched on TV, words overheard at dinner parties and possibly some shit that happened in a dream the night before.
Who knows what he based his proclamations on.
Certainly not on a considered assessment of well documented factual data.
Or perhaps he has spent the last few years of his career being indulged by over-respectful lackies who would not deign to trouble him with facts or argument.
In such an atmosphere, a person grows progressively more emboldened and progressively less well informed.
One way or another this man has revealed himself to be an ignorant and arrogant imbecile.
It’s too late for him to “quit looking like a fool”, now.
In summary: https://www.youtube.com/watch?v=CG2cux_6Rcw
I disagree with how the author characterizes the Sandy flooding as a failure of government. We can’t complain about government inaction doing when the other side is actively trying to get the alarmist agenda written into government policies around the country.
Not so long ago, east coast states were lambasted in the media when they dared pass a law saying that they would base coastal policies on long-run tidal gauge measurements. It was characterized as the Republicans being anti-science, backwards deniers. While sea levels were rising 2 mm per year, the other side was trying to get them to plan on 10-14 mm per year of sea level rise.
We don’t want to fight to have government do more to address climate change, even if it is natural. The first order of business is to push back against the alarmists who are pushing hard to force government to act on the basis of their laughable projections. If the government errs on the side of doing too little, that is better than having both sides telling them to do more and then overdoing it.
The alarmists were saying we will have to create a Category 6 for the new fossil fueled super-hurricanes that climate change will produce. I’d rather stand pat with what we have now than to have every state government demand Cat-6-proof coastal defenses and building codes. We need to fight back against the alarmists and support those government officials that are standing against them now, not join in denouncing them.
Several months, or maybe even a year ago Anthony ran an article about a seawall that had been exposed by Sandy.
I forget how old it was, but simple failure to maintain it would constitute “a failure of government”.
The Sandy flooding was a failure of government. Building had been allowed in New Jersey and New York on low lying land that was known to flood occasionally, no attempts had been made to put flood doors on tunnels or lift standby generators above potential flood levels. Finally, nothing had been done to consider a large sea protection system (as has now been constructed for New Orleans) despite warnings of what was likely to happen if a hurricane made direct landfall as it had happened several times before such as the Long Island hurricane in 1938.
However, the size of soda cups was being strongly debated.
Storms as big and bigger than Sandy have hit that area about every 70 years for as long as they have kept records.
In the last millennium bankers use to be a docile conservative sort of people.
In this new millennium BANKERS HAVE GONE BONKERS
Here is money in the game they are playing. From that viewpoint, they are doing the rational thing.
Oops “There is money in the game….”
The bankers nearly put themselves out of business in 2008. I suppose they will do so again at some future time when their hubris and willingness to loan money to eco-sharks causes them to bet against the weather.
“The bankers nearly put themselves out of business in 2008.”
“The bankers” did quite well, especially considering that prosecution (unlike the S&L fiasco under Reagan) was non-existent. It’s the banking corporations (and the economies that they feed), worldwide, that nearly went up in smoke. But the multi-trillion dollar bailouts worked, this time….
Is there a number count on national leader warmists vs. sceptics?
I would like to see a map with their geographic distribution correlated
with the wealth of the countries they lead. Just for chits and giggles.
This is one of the best summaries I have seen. Thanks for putting it together so carefully.
Would it be possible to add the graph showing temperatures predicted by IPCC models compared with IPCC predictions and also the growth in CO2 over the past 18 years please?
The lack of correlation between CO2 levels and temperature rise over the period since 1979 when we have had accurate unhomogenised satellite temperature records is very important.
If so it would become a very powerful aid to understanding explaining the facts.
First of all, England is homebase to most of the super wealthy. Second, the vary nature of the beast (banks) feeds upon the despair of the masses. In other words, if co2 levels continue to rise then supply and demand for produce will decrease. So it is in their best intrests to gain control of co2 just as they’ve gained control of the distribution of wealth.
“I care not what puppet is placed upon the throne of England to rule the Empire on which the sun never sets. The man who controls Britain’s money supply controls the British Empire, and I control the British money supply.”
-Nathan Rothschild
“It.. would divert the genius of the nation from trade and industry. It would hold out a dangerous lure to decoy the unwary to their ruin, by making them part with the earnings of their labour for a prospect of imaginary wealth. The great principle of the project was an evil of first-rate magnitude.. by exciting and keeping up a general infatuation, and by promising dividends out of funds which could never be adequate to the purpose.” In a prophetic spirit he added, that if the plan succeeded, the directors would become masters of the government, form a new and absolute aristocracy in the kingdom, and control the resolutions of the legislature.
From Walpole’s speech to government on the the South Sea Bubble delusion.1717?
It all sounds so dreadfully familiar…
Is this the same organisation that failed to predict the global financial crisis? Wasn’t that their job at the time??