…and human civilization did just fine.
The Holocene context for Anthropogenic Global warming
Guest essay by Ed Hoskins
Our current beneficial, warm Holocene interglacial has been the enabler of mankind’s civilisation for the last 10,000 years. The congenial climate of the Holocene spans from mankind’s earliest farming to the scientific and technological advances of the last 100 years.
Summary
When considering the scale of temperature changes that alarmists anticipate because of Man-made Global Warming and their view of the disastrous effects of additional Man-made Carbon Dioxide emissions, it is particularly useful to look at climate change from a longer term, century by century or a millennial perspective.
The profile of our current Holocene epoch with temperature averages century by century set against the maximum of the past Eemian epoch and the predictions of Catastrophic Global Warming alarmists this century.

The much vaunted and much feared “fatal” tipping point of +2°C would only bring Global temperatures to the level of the very congenial climate of “the Roman warm period”.
If it were possible to reach the “potentially horrendous” level of +6°C postulated by Warmists, by the inclusion of major positive feedbacks from additional water vapor in the atmosphere, that extreme level would still only bring temperatures to about the level of the previous Eemian maximum.
The Context
The Vostok and EPICA Antarctic ice core records show that there have been 5 interglacial periods in the last 450,000 years, they have varied both in temperature intensity and duration. On occasions some earlier interglacial periods were significantly shorter than the 10,000 year norm. These climate changes can be seen in the overlaid Vostock and EPICA Ice Core records from the Antarctic.

The periods of glaciation and Interglacials show a fairly regular pattern. The Antarctic based EPICA and Vostok Ice Cores above mostly show good accord for the last 200,000 years. But earlier there seems to be a similar pattern but with some significant time displacement in the period between 200,000 and 450,000 years ago. Those two Antarctic records are not so well coordinated during the recent Holocene period.
Warm Interglacials seem to last roughly 10,000 years and the intervening periods of full encroaching glaciation persist for some 100,000 years or more in between.
Prior to the Holocene epoch a period of deep encroaching glaciation had persisted for the previous 100,000+ years. Such glaciation meant that a mile high ice sheet covering New York and much of the currently inhabited Northern hemisphere. That glaciation was preceded by the Eemian interglacial period. The Eemian epoch was at its warmest about 120,000 years ago. It was some +3°C warmer than the Holocene “Climate Optimum”, only about ~8000 years ago.
So based on this pattern of radical climate change our current benign Holocene interglacial could well be drawing towards its close.

According to longer term Northern Hemisphere Greenland GRIP ice core records, the last millennium 1000 – 2000 AD was the coldest of the current Holocene epoch, with millennial average temperatures about 1.8°C lower than its early “Holocene climate optimum” in about 6000 BC.
There has since been a comparatively minor temperature recovery since the Little Ice Age some 300 years ago.
However, it is this minor temperature recovery that has recently given rise to the “Great Global Warming Scare”.
The Holocene Epoch
The temperature progress of the current Holocene interglacial epoch for the last 10,000 years is interesting as a gauge for all the recent Warmist and Alarmist predictions that have been developing over the most recent 40 – 50 years.
The Holocene interglacial can be divided into two phases.
- the early Holocene, encompassing its highest “Climate Optimum”, was relatively stable at the millennial level showing only a modest cooling of about 0.05°C per millennium from about 8000BC up until about 1000BC.
- thereafter the more recent 3000 year phase 1000BC – 2000AD shows much more rapid cooling at a rate of 0.5°C per millennium, (i.e. about ten times the earlier rate).

Judging from the lengths of past interglacial periods, after some 10,000 – 11,000 years the Holocene should be drawing to its close. A climate reversion to full, encroaching, glaciation is therefore foreseeable, if not overdue, in this century, the next century, or this millennium.
Looked at from the point of view of the most recent 3 millennia which have experienced accelerated cooling, a continued natural climate change towards a colder climate is now more, rather than less, likely.
Cooling would lead to more intense and adverse weather: there is good reason to expect this, simply because the overall energy differential between the poles and the tropics can only be greater with cooling and that in itself would lead to less stable atmospheric conditions.
In addition to more adverse weather, any coming cooling will also lead to very serious deprivation for mankind and the biosphere as a whole. Growing seasons will shorten and less arable land will be capable of crop production.
But all current Climate Change discussion and propaganda only concentrate on short term temperature variations, often with emphasis on minor short term temperature increases. These always try to emphasise ever increasing global temperatures. But they are often measured in virtually undetectable one hundredths of a degree Centigrade.
The predictions of Catastrophic Global Warming by alarmists should be set in the context of the temperature picture of the current Holocene interglacial

The much vaunted and much feared “fatal” tipping point of +2°C would only bring Global temperatures to be at the level of the very congenial and productive “Roman warm period”. A further rise of +2°C could only bring positive economic benefits to the bulk of the Northern hemisphere.
Catastrophic Global Warming alarmists postulate that temperature rise will reach the “potentially horrendous” level of +6°C by from the inclusion of major positive feedbacks from additional water vapor in the atmosphere. The +6°C temperature level would still only bring global temperatures only to about the level of the previous Eemian maximum.
The Eemian interglacial ~120,000 years ago, was a warm and more plentiful period in the worlds recent history: hippopotami thrived in the Rhine delta. As ice sheets substantially receded in the Eemian, resulting sea levels were about 3 meters higher than found at present. But that ice sheet disintegration process would have taken millennia to be fulfilled.
But according to the Alarmists all this radical and destructive temperature increase is supposed to occur over a span of less than 100 years in this century 2000 – 2100AD. And it is solely attributable to Man-kind’s burning of fossil fuels and emission of extra Carbon Dioxide into the atmosphere.
Over the past 20 years:
- Man-made Co2 emissions have risen by ~14%
- CO2 concentrations in the atmosphere have increased by almost ~8%
but there has been no perceptible increase in Global temperature.
Global Warming Alarmists including:
- the Intergovernmental Panel on Climate Change
- the United Nations
- many Western Governments
- Green NGOs, etc.
aggressively assert catastrophe with excessive temperature rises. But is extreme hubris to expect that mankind could achieve a complete reversal of the world’s climatic progress of the last 3000 years and achieve an additional positive +6°C change over the course of the current century.
When the postulated warming in the coming century as promoted by the IPCC and other Global Warming alarmists is collated against the progress of actual Holocene temperatures, the absolute implausibility of the Man-made global warming hypothesis becomes obvious.
(cough) Oh, hello. Can somebody tell me how historical temperatures are calculated please ?
(cough) Oh, Hello. A damn sight more easily than temperatures a century from now.
no seriously stop messing about 🙂 although I am not worthy I would like to know how it is calculated because I do not see how it is possible considering the unknown things.
Isotope analysis of hydrogen and oxygen. SciAm is not the magazine it used to be, but they did an explanation a while back: http://www.scientificamerican.com/article/how-are-past-temperatures/
If they have explained the past temperature records, and those records show many times past the so-called tipping point, why then are they still so frightened of future warming?
My sense is that geologists know far more about this than ‘climate scientists’. I don’t know how accurate the geological record is but its light years ahead of tree rings.
And the warmists claim that skeptics have their heads in the sand. . .
The SciAm rendition is a load of BS. “Robert Mulvaney, a glaciologist with the British Antarctic Survey,” SciAm’s house expert, implies that they use the well-known temperature dependence of dO-18 ratios to obtain temperatures from ice-cores. They don’t.
Instead, they use the usual non-physical statistical re-scaling against the recent surface temperature record to get temperature numbers. Those statistical temperature numbers have no knowable relationship to actual physical temperature degrees.
Ice core dO-18 can’t be used directly to calculate physically real temperatures, because there are a number of confounding environmental effects, such as unknown and unknowable variations in paleo storm tracks, and unknown variations in monsoon dO-18 rain-out, that put large non-temperature variations in dO-18 ratios.
http://uwpcc.washington.edu/documents/PCC/icecore_temp_uwinhs_schoenemann_draft_lowres.pdf
http://www.scientificamerican.com/article/how-are-past-temperatures/
what I mean is; you could say that dinosaurs were so big in the past because there was more gravity to fight against so the heavy isotopes of water sank and weren’t there to be evaporated and end up in the ice cores to be measured.
You could also say that dinosaurs were as big as they were because of the far greater levels of CO2 and consequent productivity of the biosphere. That is much more likely than a massive (pun intended) change in the earth’s gravitational field. The former is scientifically reasonable, while the latter remains science fiction and can’t be supported by any known physics model.
yes well, as you bright sparks don’t know what gravity is I doubt you could argue that it might not be variable
zemlik,
You think you’re being clever, but when you show up here without a clue, all that you do is illustrate the hermetically sealed nature of left/enviro thought. You would need another 30 IQ points just to realize how clueless you are.
@zemlik
When you propose a novel interpretation of the physical world that is not supported by the current paradigm, it’s YOUR responsibility to provide convincing evidence and a theoretical framework, inasmuch as it’s impossible to prove that something is not true.
The bone densities of dinosaurs were akin to those of present-day land animals, the largest of which (the elephant) cannot run or jump because of the limitation of gravity. This implies that terrestrial dinosaur giants could exist only because lower gravity made the mechanics of their movement viable. A lower gravity implies a much smaller, less-dense globe.
Anyone who claims that elephants can’t run, has automatically forfeited any right to be taken seriously.
@TYoke
I was just asking a reasonable question so there is no necessity to be abusive then stating illustrated with an invented thought that so far back in the past there are so many variables you cannot tell what you are measuring.
[Commas were invented for a reason… ~mod.]
Zemlik,
Most dinosaurs were within the mass range of the largest land animals which replaced them. The only exception is the biggest of the sauropods, which evolved greater size because of their diet and method of consumption.
There were however more species in the more massive range then because of more abundant vegetation, thanks to a generally warmer world, without ice sheets, and hence with plenty of CO2 in the air.
There is not the least shred of evidence in favor of lower gravity a mere 235 to 65 million years ago.
Just see e.g. here:
http://en.wikipedia.org/wiki/%CE%9418O
this explains the basic mechanism
http://media.washtimes.com.s3.amazonaws.com/media/image/2014/11/06/116_2014_b1-oliv-thumb-scale8201.jpg
Since others are being a bit snarky, I’ll give a more straight reply:
A variety of methods are used. I doubt I can recount them all from memory. They are then tested against each other to assure calibration works well enough.
From several isotopes ratios ( Oxygen from water is a big one, but Sr too, and C13/C12 comes into it – yes, the C12 / C13 ratio changed before people… very useful for temp ideas from deposits of plant matter, and a few more) to things like looking at stalagmites / stalactites in caves (again with the isotopes, but also measure things like water flow so can tell something of precipitation and the kind of plants on the surface), to looking at layers of sediments in lakes and the ocean (isotopes, but also which kind of microscopic life was around in the water column as some are very temperature picky, and what kind of macroscopic life too… oh, and some minerals only form at certain temperatures so they set bounds based on what is in the goo.)
Then there is geographic markers for things like glacial moraines. If you have one, it is the place where ice melts. 0C transition line. Also glacial scrape marks (less than 0C and under a lot of heavy ice), and what inclusions are left in the moraine (bones, animal and plant types, pollen. Lots of uses for pollen…).
Lakes and even dirt can have a great history of the pollen in it. Plants are extraordinarily picky about what temperature range they will use for “doing it”, and the mix of pollens can give a very good picture of average temperatures. (For example, my Runner Beans like things a bit cool and will NOT set seed over about 95 F, while most tomatoes absolutely refuse to even think about sex if the temperature is below 60 F or so – only the rare Russian types and a few others will shed at 50 F… and go for it… Enough of those and you can narrow temps down nicely. Then you have Oak vs Pine. Just the ratio of the two pollens gives a nice temperature profile.) So all over the place you can ‘take a core’ of something and start your pollen studies.
In this case, they are looking at the glacier. Turns out ice does not conduct heat well. (Duh! Over 32 F it melts, but didn’t bother passing the heat on…). So you can take temperatures down a bore hole and actually just use a thermometer to see what the temp is now. Based on some physics for things like specific heat, temperature gradient, age, etc. you can then calculate what it had to be then to be what it is now.
So take a bit of glacier. Measure the bore hole temps. Calculate. Look at the embedded pollen types (wind blown from somewhere nearby generally) if any. Find your temp. Take the local geology, figure where the ice ended then and figure out the temp ‘up stream’ to have it end there. Take your CO2 sample of trapped gas, find the implied temps. Take your water sample and compare O2 isotopes, find sea temp of source water. Take various isotopes deposited in dust, figure out the cosmic ray flux and more. Compare all your calculated temps. They ought to be close. If not, you screwed something up and get to start over (or find what was wrong with the method that tells you something new). And, if you find any artifacts of life in the ice, date them too and see what they say about temperatures.
That ought to give you a general idea. For more, do a web search on “paleotemperature methods”
https://duckduckgo.com/?q=paleotemperature+methods
Plan to spend a few weeks, pack a lunch, and make sure you have at least 5 lbs of coffee.
Interesting, thanks.
Thanks E.M.
If I understand correctly are you saying that the temperature of the ice as measured down a borehole today will give you the temperature that it was up to 450,000 years ago? Seems a bit hard to believe that it could retain the same temperature after so long or am I missing something?
Cheers,
Alastair
Generally, the ratio of oxygen 16/18 isotopes in ice-core data is proportional to change in temperature.
If you want more info, Richard Alley’s book “The Two Mile Time Machine” gives more detail, as well as being an overall good read.
You can begin to find an answer to your question in Richard B. Alley’s “The Two-Mile Time Machine” that describes the process of getting and analyzing the Greenland ice cores. http://www.amazon.com/The-Two-Mile-Time-Machine-Climate/dp/0691102961
There are also many studies of sediment cores, tree lines – how far north they extended, or how high up mountains, sea levels as evidenced by coral mounds above the current sea level and physical remnants of prior coast lines and beaches, glacier advances and retreats, etc. Just as a starter, you could read the voluminous volumes written by the father of climate science, Dr, Hubert H. Lamb. The study of the physical research of climate change can be exhausting, but very rewarding because it exposes you to an enormous amount of information that is lacking in the popular discussion of climate change. It’s too bad that the natural climate change deniers have drowned out so much good, basic science from the climate change discussion.
Climate change. It’s what climate does.
1. The last data point in the GRIP survey is from 1855, at the tail end of the little ice age
2. The GRIP data is from a specific point in greenland that is heavily affected by the gulf stream current, it is not a globally averaged temperature
3. The temperature at the GRIP site has increased significantly since 1855, much more than the globally averaged temperature has risen. In fact, August 2012 temperatures at the GRIP site were close to 0C. So the warming there on an annual average has increased to about even with or slightly above the Minoan Warming period spike.
4. The 2C is a globally averaged warming, at the GRIP site a 4 C of globally averaged warming would bring closer to 5 or 6C of localized warming due to increased water vapor and other arctic amplification feedbacks.
That is actually reasonable. But if you want to measure glaciation, you go to where the glaciers were. If you want to understand written history, you go to where the historians wrote. Unfortunately, our data points are very limited. Outside of Antarctica southern hemisphere glaciation was very limited in all of the stadials and the evidence has melted. Outside of the Mediterranean and north there is no written history, give or take some Mayan hypotheses recently falsified.
Not our fault. Just the way it is.
I think you guys are misunderstanding zemlik.
He (she?) is saying that science is necessary to determine past temperatures. Since he believes we deny science, he says that it is impossible for us to determine past temperatures. In his mind, it is as simple as that.
There is zero chance he will read the post or your comments. He does not think he has the capacity to tell if they are scientifically credible and his belief is that they are not, so the matter is settled for him.
The bottom line is that if he says you believe in dragons, it does not matter that you say you don’t. There is nothing you can do. His belief is fanatical. If you say 2 + 2 = 4, he will hear blah, blah, blah…
zemlik is a creationist troll
Biblical fundamentalist creationists (a minority of Christian believers) assert that the earth was created in 6 days, about 4000 years ago.
CAGW creationists go further and are even more creative and fanatical. They believe the world came into existence in what “infidels” would call the year 1850.
Any climate history before 1850 is easy to criticize and cast into doubt by discussing measurement and recording technology.
Thus CAGW believers such as zemlik are today’s arch-creationists.
Geology is the mortal enemy of all such young-earth fundamentalists.
CAGW cultists are also flat-earthers, they believe that climate history was always flat, unchanging and paradisical, until mankind carbon-sinned and started turning heaven into hell.
Amen brother – preach it! Hallelooooo-yah!
Tell that 1850 bit to my grandaddy’s daddy. My grandfather was born in 1865. So, if the 1850 date is accurate his dad must only have been 15 years old when grandaddy was born. This sure doesn’t match the dates in our family bible, which go back to the 1600’s in Ireland.
+10 phlogiston I’ll need to remember some of that when I’m with my uber left elitist friends and colleagues…..
zemlik, your faq
June 1, 2015 at 9:47 am
(cough) Oh, hello. Can somebody tell me how historical temperatures are calculated please ?
zemlik, (cough), you didn’t decipher the title of the thread? –
: Ice core data shows the much feared +2°C climate ‘tipping point’ has already occurred… :
Hans
Global temperatures have always varied in cycles and so to I suspect will the waillings of climate alarmists from global cooling to global warming and back again.
Do you know what this means? “We are in the coldest 1000 period since the last ice age.”
That is the response everyone should use when an alarmist says “2014 was the warmest year ever!!”
Precisely what it says. Both are true. You can derive “linear” trends across any arbitrary time span. Asserting that 2014 is the warmest year on record means just that, but, records have only been kept for a historically short period with the Central England record, which started in 1659, being among the longest “records.” But that is about 3.5% of the Holocene and is a temporally-biased span that ignores the remainder of the Holocene. The best estimates of Holocene temperatures indicate that the warmest period in the Holocene was between about 8,000 and 7,000 years ago. This is supported by ice core evidence, speleothem evidence, marine high stands about 1.5 meters above present sea level, and may other lines of evidence. The present is about as warm as the beginning of the Holocene. Sadly, since there has been so much poorly documented “adjustment” to the available data in historical records of temperature, the actual temperatures are thrown into doubt.It is quite unlikely that 2014 was all that warm.
Or perhaps more accurately… we’re in the coldest 1,000 years since the Holocene optimum.
there is good reason to expect this, simply because the overall energy differential between the poles and the tropics can only be greater with cooling and that in itself would lead to less stable atmospheric conditions.
I would think it is the other way around.
Please specify Leif, your post is ambiguous. I am reading your comment as a cooling planet with high energy differential between poles will lead to stable atmospheric conditions?
Studies have shown more stable and less extreme weather with warming. Hurricanes hitting the USA are at an all time low in the past decade despite being on a plateau as far as atmosperic temperatures are concerned. For 18 years the global temperatures has not changed statistically significantly. So while someone can say we are statistically on a flat line for 18 years it is entirely wrong to claim global temperatures have been rising year after year during these 18 years. This plateau occurred despite CO2 still rising and above 400 ppm which disproves the AGW hypothesis.
AGW theory proposes the poles warming more than the equator so in an AGW warming world the temperature differentials between equator and poles would decrease.
If that were correct then cooling would involve greater differentials as Ed says.
However, Leif is actually correct in that warm spells with more zonal jets lock cold air in around the poles more tightly so the poles get colder but the polar air masses are smaller and move out across the mid latitudes less often and for shorter periods of time.
The reality is more subtle.
What happens is that although the net temperature differential between equator and poles falls during cooling spells the more equatorward surges of cold polar air cause a larger temperature differential across the mid latitude jet stream tracks.
In warming spells the net temperature differential between equator and poles rises but there is a smaller temperature differential across the mid latitude jet stream tracks.
In my opinion the regime changes are solar induced so that an active sun results in colder poles but less vigorous mid latitude storms whereas a quiet sun results in less cold poles and more vigorous mid latitude storms.
It is all a matter of energy redistribution rather than any change in average surface temperatures.
Note though that a quiet sun with more equatorward surges of cooler air produces more clouds which cools the system overall so that whilst the pole to equator differential decreases the system will cool.
An active sun with less equatorward surges of cooler air produces less clouds which warms the system overall so that whilst the pole to equator differential increases the system will warm.
The confounding feature that produces the counterintuitive system response is the change in global cloudiness/albedo which alters the proportion of incoming solar energy that enters the oceans to drive the climate system.
Cloudiness / albedo changes mimic the effect of a change in top of atmosphere insolation.
That is what results in climate change and not the amount of GHGs in the atmosphere.
Sounds to me like you’re saying less stable atmospheric conditions would lead to greater energy differential between the poles and the tropics.
Either way, I suspect the correct wording would be, greater energy differentials lead to less stable atmospheric conditions. Period. ‘Cooling’ is a relative word. If the tropics and the poles both heated up or both cooled down, but by vastly different amounts, it would still produce greater atmospheric instabilities.
jtom,
What I am saying is that the location of the largest temperature differentials shifts latitutudinally.
The change in location then affects global cloudiness which leads to net warming or net cooling.
When the sun is active the largest differential is nearer the poles with reduced global cloudiness and system warming but when the sun is less active the largest differential shifts equatorward with increased global cloudiness and system cooling.
Either way, greater energy differentials do indeed lead to less stable atmospheric conditions as you say but the location matters as far as global albedo is concerned because that determines whether the system is warming or cooling.
Leif, no!
Icehouse baloney not withstanding the evidence, the tropics have never frozen.Thank goodness! That might have been an actual tipping point. All that happens is the gradient increases between the tropics and the poles.
Glaciation – the great equalizer.
when the ice age cometh, be sure to be armed. I know the hippies want to grow gardens and live under the palm trees (no fires please, co2 and whatnot). If you grow a garden unarmed, you are only growing it for the guy with the gun.
Just use DDT as a pesticide. The hippies would flee to the next county, and the food would be safe to eat.
This context looks very impressive — but I’d like to know how trustworthy these particular graphs are at reflecting the ice core data accurately, and also how well the ice core data reflects the global climate and not just the polar climate. I’m sure proponents of CAGW would dispute these graphs… How strong would their arguments be? If these graphs are accurate, the “Catastrophic” part of CAGW is clearly seen to be no threat and talk of soon-to-be-reached tipping points is absurd.
True.
The error boundaries must be huge.
“the graph confirms the 1930s were indeed the warmest period during the past 150 years”
The graph says that the 1930s were warmest at a particular location in Greenland (where the record largely stops in 1980). The world is a big place, and that is my point. Single locations vary a lot and do not represent the global average.
“and also how well the ice core data reflects the global climate and not just the polar climate”
Good question. Single locations can be far more variable than the global average. Here is the unadjusted record for Upernavik in Greenland. Annual averages range over 7°C, with a nett rise of about 3°C.
http://www.moyhu.org.s3.amazonaws.com/pics/upernavik.png
Nick — do you invest the same way — ignore things like the Great Depression? and fit straight lines through all the fluctuations
When I look at the data my eye see it much much differently:
1) I eyeball fit a nearly horizontal line @ur momisugly -0.5 with a +/- 1.5 wiggle from 1870 to 1920
2) then there is a dramatic rise to a “new normal” @ur momisugly+2 with rather larger +/- 2 superimposed fluctuations from 1930 to about 1950
this is followed by a rapid fall to another “new normal” @ur momisugly +0.5 with a +/- 1 fluctuation between 1950 and around 2000 with a gap in the data between 1980 and 2000
Wow… just WOW!!! Upernavik, Greenland has been steadily cooling since the mid-1920s!! Somehow avoiding the broiling death presence of that ever universal omnipotent driver of Undeniable Catastrophic Global Galactic Climate Disruption (to use the latest parlance)… CO2! Heavens to Betsy!!
“Nick — do you invest the same way — ignore things like the Great Depression? and fit straight lines through all the fluctuations”
My point isn’t that Upernavik follows any particular pattern. It is that single locations (like the GISP 2 site) are far more variable than a global average, and not in sync with any particular pattern.,
Wow…. the graph confirms the 1930s were indeed the warmest period during the past 150 years… just like the surface stations used to say prior to all of the supposed corrections to the data…. imagine that. Might want to deep six this graph Nick, or at least make some “adjustments” to it.
Nick should have shown the entire chart for Upernavik.
Which also shows how much adjustment the NCDC is applying to Upernavik (second panel is what the NCDC reports to the public as the true temperature trend and the third panel is the individual adjustments by year.
Talk about your Polar Amplification. Taking an up and down pattern and making it straight-up trend for about +5.0C of warming since 1870. That is just so far wrong that there should be an investigation and people need to pay a price for being so ….
http://s8.postimg.org/ay2p8yihh/Upernavik_43104210000.gif
And of course, the 1930s was the warmest period in the US as well, so not just Greenland.
Bill,
Indeed it is criminal what the “data” gatekeepers do and even more so that they get away with it. They and their bosses need to go away and do time fir fra@ud, waste, abuse. robbery and mass murder.
There are similar temperature studies for other areas that tend to find them fluctuating in the same cycles. I took a look at some postings on Texas paleotemperatures here and generally it finds the same thing. Hotter in the Holocene Optimum, cooler in the LIA.
Interesting to note that when things get cold, Texas gets wetter, so when the next glacial gets really rolling, the HIll Country and West Texas become nice forested areas with decent game hunting, more water, and cooler temps. Right nice places to camp out of 100,000 years until NYC thaws 😉
https://chiefio.wordpress.com/2015/05/31/texas-rain-and-1500-year-cycles/
LOTS of places show the cycle (about 700 articles per one source account of just the articles he found)…
Until then, we have to put up with a lot of flooding!
I’m still confused…if that bit of warming will melt all the glaciers and icecaps, how is an ice core from that time still available?
Shhhh! You keep up with that kind of talk and you’re going to make Al Gore’s head explode!
You say that like it would be a bad thing.
Why did that make me think of the ending of Ghostbusters?
A bit of warming won’t melt ALL the icecaps–it’s never done so in the past. Only glaciers (and not all of them).
They call the warm periods climate optimums, why are the warmistas so insistent that we avoid a new one?
” why are the warmistas so insistent that we avoid a new one?”
They hate optimums, or love control?
Because the cold periods are called pessimums… and they are sooo pessimistic so want to feel at home 😉
If this keeps up, Frank Zappa might’ve sung:
“Movin’ from Montana soon
Floss won’t grow so close to Saskatoon”
I know, I know- almost as corny as some o’ Max Photon’s stuff.
We’re all doomed…
.
Buy cheap farmland in central Florida.
I also would appreciate more info on where these data came from and how it was calculated and how they will be “debunked”
since most of the warming will occur in cool places and in the winter, what isn’t congenial about it?
icouldnthelpit,
Would you rather use temperatures on the equator? We can do that.
According to Prof. Richard Lindzen, equatorial temperatures have not varied by more than ±1ºC over the past billion years.
Global warming happens primarily at night, and in the winter rather than in summer, and low temperatures are raised, rather than daily high temperatures going up — and temperature change is greater as one travels toward the higher latitudes.
All those things are contrary to the popular misconception that runaway high temperatures wil occur.
This was an excellent article showing where we are currently in the geologic record. Warm times are rare. The IPCC is sounding the alarm about beneficial warmth, when we should really be preparing for much colder times:
[Comments deleted/sockpuppet. -mod.]
..
http://news.nationalgeographic.com/news/2010/03/100304-snowball-earth-ice-global-warming/
Joel Jackson,
From your link:
There’s still plenty of mystery surrounding snowball Earth… The continents may have been in a total deep freeze, or the planet may have simply been subjected to a patchwork of constantly moving glaciers or icebergs—or something in between.
I’ve noticed a new meme lately, claiming that ‘Snowball Earth’ was completely ice covered. So who to believe? National Geographic? Or Dr. Lindzen?
This chart shows Warmhouse/Icehouse temperatures:
Notice that Icehouse temperatures were not all that much colder than now. Here’s another chart showing pretty much the same thing:
http://whatreallyhappened.com/IMAGES/GeoColumn.gif
Next, still another chart showing that we are currently at the colder end of the planet’s temperature range:
http://www.kogagrove.org/sams/agw/images/paleomap.png
If you want to believe the NatGeo version, feel free. That far back in geologic history it is hard to pin down what happened with any certainty. But given the choice between a professor who has authored twenty dozen peer reviewed papers on the climate and related subjects, and a magazine always promoting the same narrative, I would tend to think the prof has looked into it a lot more thoroughly.
‘icouldnbthelpit’ asked if Lindzen could construct a temperature with no error bars. As usual, that commenter needs to get up to speed: “±1ºC” is a two degree uncertainty range. And yes, compared to some folks he is a genius.
[Comment deleted/sockpuppet. -mod]
Joel D. Jackson,
During the last two Snowball Earth episodes (peaking at 635 Mya and 715 Mya) almost all of the continents were together in Super-Continents (Pannotia, and Rodinia respectively) which were mostly centred around the South Pole.
Some geographic arrangements like to place the majority of the continents at the equator during these periods but they are NOT the real reconstructions from the real geologists who do this work.
Take Pangea for example, centred at the equator. Hot, hot climate of course. Now put it where Antarctica is and the glaciers are 5 kms high and spread by gravity across all of the land surface available and temperatures are -100C at the South Pole and maybe +10C at the equator.
There you go solved.
[Comment deleted. This is the site pest “David Socrates”. -mod]
Joel D Jackson
Paleomagnetic reconstructions are basically a crock in the Proterozoic, and only slightly less so in the Phanerozoic. The relict magnetic alignments resolve only for latitude and not for longitude. They would have Mesozoic terraines of Western North America ziz zagging back and forth thousands of kilometers, perhaps crossing the equator. Major cratons rotating first this way and then that, and back again.
Proterozoic rocks are only exposed where they have been uplifted, tipped and metamorphosed, or in the case of Canada where they were scoured over in our current Pleistocene ice age. Reconstructions rely on the difference between the magnetic angle and the bedding angle. All of this presumes that the bedding was level and that there has been no true polar wander. Brave presumptions.
We have no evidence that any glaciation was ever any worse than our own.
@gymnosperm…
[Deleted. -mod]
Joel Jackson says:
Lindzen has never published ANYTHING on the geological evidence of past temperatures.
That is so demonstrably false that I think we can ignore the rest of your posts. You want to believe NatGeo, fine. They’re following the Narrative, not the science.
Dr. Lindzen wrote:
“There is ample evidence that the Earth’s temperature as measured at the equator has remained within +/- 1°C for more than the past billion years. Those temperatures have not changed over the past century.”
That drives the alarmist crowd nuts. They can’t refute what M.I.T.’s head of their atmospheric sciences department said, so pop culture magazines like NatGeo look for folks on the payroll, to try and keep the meme alive.
Believe them if you like. Me, I’ll go with a real expert on global temperatures — which your authors are not.
[Snippity-snip. -mod.]
PS dbstealey
..
Careful with your “appeal to authority” fallacy with Lindzen
icouldntfindit:
Better keep looking, then. I’ve kept that Lindzen quote for probably the past decade or more. I cut and pasted it, so if you couldn’t find it you didn’t try hard enough. Or your search-fu is weak.
But no matter. Prof. Lindzen responds to emails. His contact info is on his CV which is also online, but you may not be able to find that, either. Ask him, if you care. He will respond. Post it here when he does. And please don’t assign homework, I’m not your secretary. Continue searching if you like. It’s your time being spent, not mine.
Now, for the meat of the matter: since I’ve shown that we are currently pretty close to the geologically coldest global temperatures (we’re still in an Ice Age, you know), maybe you can explain how the entire planet was covered with ice, when temperatures were only a couple of degrees colder than now?
The global temperature is currently below 15ºC. The coldest it has been in the past billion years has been about 12ºC. (Look at the charts I posted above). There is a divergence of opinion on the subject, with pop magazines like NatGeo on one side, and global temperature experts like Prof. Lindzen on the other.
But using plain common sense, given that we’re only around 2º above the coldest global T in the geologic record, what do you think? Do you believe that solid ice covered the entire planet including the equator? How does that work? The planet has been just as cold in more recent times, and that didn’t happen. What do you think? Maybe someone’s got an agenda?
What kind of person gets all indignant when asked for a source to one of their quotes?
Was that a rhetorical question?
Who cares?
The graph has the early Cenozoic peak in the wrong place. It occurred at the Paleocene/Eocene boundary. That’s why it’s called the PETM.
Over the past 20 years:
Man-made CO2 emissions have risen by ~14%
CO2 concentrations in the atmosphere have increased by almost ~8%
Or put in different numbers: the atmospheric composition change, over that time frame, due to this increased CO2 is approx. 0.003%.
No wonder Nature does not take any notice.
CO2 concentrations in the atmosphere have increased by almost ~8%
Look at all the GH Gases.
Updated Dec 2014 CO2, CH4 and N2O were ( in ppm ) 398.6, 1.893, & 0.326 = 400.819 total ppm
If in 2013 CO2, CH4 and N2O were ( in ppm ) 396, 1.824, & 0.326 = 398.15 total ppm
Reading in 1995 were ( in ppm ) 360.8, 1.75 , & 0.312 = 362.062 total ppm
http://cdiac.ornl.gov/pns/current_ghg.html
ftp://aftp.cmdl.noaa.gov/products/trends/co2/co2_annmean_mlo.txt
percentages of total atmosphere 2014 (remember watervapor is not included in above ppm)
400.82 / 1,030,000.00 = 0.0389% (at 3% watervapor)
percentages of total atmosphere 2013 (remember watervapor is not included in above ppm)
398.15 / 1,030,000.00 = 0.03865%
percentages of total atmosphere 1995
362.062 / 1,030,000.00 = 0.03515 @ur momisugly watervapor = 3%
So the rest of the atmosphere has changed (at 3% humitity)(2014/2013/1995) 99.611% from 99.961% from 99.965%. = 0.354% 1995 to 2014 & 0.004% 1995 to 2013
That is the real change not your 8%
Quibble as much as you like over such trifles! No change in global ave temp for 18+ years. We’re watching the greenhouse gas theory dissolve into much ado about nothing before our very eyes.
DD
thanks for your numbers.
From about 370 ppm to about 400 ppm over 20 years is approx a 0.003% change, i.e. 30 ppm in composition.
I guess the other thing this means is: what has decreased by that amount? Not much really, how can it.
The 8% comes from the article, please scroll up, which is also correct 370 to 400 is about 8%.
A numbers game that is all it is. Once you are in business it all becomes clear and you really can turn losses into profits, within reason. That is a bit like adjustments to temps and finding all sorts of justifications for it.
Ed, nice charts but, as others suggest, without sources or links to the peer-reviewed literature the post is just some guy’s opinion. Also, stick to conclusions that actually derive from your data. Warmer-than-present temperatures in past millennia that facilitated improvements in human welfare are evidence against CAGW, not against AGW. The past three millennia, you contend, are a period of accelerated cooling. So what accounts for the “recovery” of the past century-plus? Unless you have strong evidence the current warm period is due to solar forcing or unforced natural variability, you cannot credibly dismiss the AGW hypothesis as “absolutely implausible.”
Marlo, our present “recovery” is suspiciously similar to those “recoveries” leading up to the Minoan, Roman, and Medieval warm periods. Unless you have strong evidence that those were caused by Anthropomorphic Global Warming, then our present warming is probably just natural variability. Looking at the graph, the previous warming trends were fairly abrupt. And, just as an aside, the cooling trends afterward were also fairly abrupt. Abrupt, of course, in the geologic sense, as people in the midst of a long-term warming or cooling trend will still see mostly the same weather throughout their short lives.
Every 1500 years (more or less) there is a cold spike. These are called Bond Events during interglacials.
During glacial periods ( Ice Age Glacial) the same 1500 year cycle is seen as a Dansgaraad Oeschger event. Except that D.O. events are warm spikes… that proceed the cold spike… Seems you can see warming in ice better and you can see frozen in warm better… The D.O. Events are often proceeded by ice rafted debris in what are called Heinrich Events.
Now when I look at recent history ( i.e. under 2000 years), I see an ice rafting event that sunk the Titanic, then a warm spike (now) as we leave the Little Ice Age, and what comes next?….
Onset can be measured in years to one or two decades… In Egypt the span between old and new kingdoms was such an event. It became cold, severe drought hit, and there are layers of loess (wind blown dust) with onset in years. Ended something like 100 years later. It’s a very clear loess layer with rich soil on each side…
https://chiefio.wordpress.com/2015/05/31/texas-rain-and-1500-year-cycles/
Akkad falls in that 3000 BC warm to cold plunge:
https://chiefio.wordpress.com/2011/11/03/akkadians-and-chad/
There isn’t much available during the actual bottom, but by about 2000 BC Egypt was climbing back out of that hole and we get some writings about their “Dark Ages”:
https://chiefio.wordpress.com/2011/11/03/akkadians-and-chad/
Then we are back into the New Kingdom and all that with Cleo and friends with the Greeks moving in and the Romans take over…
Then that ‘bit o cold’ in 540 AD and the Fall Of The Roman Empire (Western Empire) that we call the Dark Ages. Cold is just not a good thing for empires… But the Eastern Empire got through it as the Byzantine Empire and survived until the Little Ice Age pretty much set them up for the kill-shot from the invading Muslim Armies. (Hey, history doesn’t repeat, but it rhymes… guess what comes next for the EU Empire??…)
Onset can be down in the single digit years as the Gulf Stream shifts the warmth away and / or an Icelandic Volcano blots out the sun. (Both tend to come together for an unknown reason, but cold plunges are the times of the most volcanoes, but not in a causally clear sequence…)
The history is very very clear. You get a 1500 year cycle. It’s Damn Cold, then during the warm run, Empire and technology expand. Unless you use that time to prepare, the next cold plunge puts you in a Dark Age full of chaos and wars as civilization takes a ‘reset’. The cold plunge is preceded by a warm spike. Use it or lose it…
Marlo — look at the data from the ice cores — while there maybe some calibration uncertainty comparing similar periods should be relatively insensitive to these
When you do that you can make three major observations:
1) on short terms of days to a few years [not resolvable in the ice cores] we know that the temperature fluctuates
2) on the scale of decades to centuries which is resolvable in the ice cores we see much the same as [1]
temperatures moving up and down with a spectrum of frequencies — essentially noise-like
3) the more general trend that is easy to see is a dramatic and rapid rise UP at the end of a glacial phase followed by a gradual decline during the interglacial until the beginning of the next glacial
As the above have happened many times when human activity was insignificant [i.e. before the current interglacial warm phase — you need to argue why these natural processes should not be occurring today
The take-away message is:
The ice is coming back — However, no one can yet predict when it will be time to pack-up everything north of a line roughly between DC and SF and more it south — Although sitting through the months of February and March in Greater Boston — one was beginning to wonder
Keep an eye on Labrador. When all the snow doesn’t melt one year DOOM is coming. Labrador is supposedly where the last glaciation(post Eemian) began. Probably a change in annual snow melt anywhere in eastern Canada would be an equally good harbinger.
In regards to the graphs, although there is no attribution they were are all taken from published, peer-reviewed literature. They have appeared in many published papers and many places on the internet. Fortunately the folks doing the ice core work were very meticulous and honest. As far as I remember all the base papers were strictly presentations of what had been measured, with fairly long, well-thought out arguments as to why oxygen isotope ratios were a good indication of the surface temperature where the water evaporated. Later papers and many of the reproductions changed the axes of the graphs to temperature, rather than making you wade through the papers and figure out how to do the calculations. Assigning temperatures is a bit problematic because of all the assumptions involved, but the isotope results appear to be pretty much self-explanatory functionally correct and useful to show the range of variation, its direction, and relatively fine-grained time sequence(~2-300 years).
Yes l agree with you that it looks like the last ice age started off as regional climate change in North America. For me the big clue to this is the fact that the ice sheets started to grow from around the Hudson Bay area and not from the Rockies in western Canada. Because had the cooling started off as been more global then you would have expected the ice sheets to grow down from the mountains not from the lower levels around Hudson Bay. When there is regional climate change then my interest always turns to the weather for the cause. Which leads me to believe that a large part of the cause of the last ice age in the NH. Was a large increase in the number of blocking highs turning up in the NE Pacific area over the long term. Which leads to a increase in the amount of cold Arctic air flowing over the eastern side of Canada, just the area the ice sheets grew during the last ice age. So the signs l am looking for in climate cooling is a increasing trend of highs forming around the NE Pacific/ NW Canada area along with a increase in a more zonal and southern tracking jet stream flowing across the N Atlantic and Europe.
Also note that it is a shift of the Gulf Stream / North Atlantic Drift that is the trigger. At that time, heat backs up a bit into Florida (so it stays “Very Nice”) while Europe takes a cold plunge. When that happens, take an extended vacation to Florida…
https://chiefio.wordpress.com/2012/12/15/d-o-ride-my-see-saw-mr-bond/
cites a paper that explores that shift in Florida and the Gulf Stream:
http://www.pik-potsdam.de/~stefan/Publications/Nature/rapid.pdf
It finds that the ocean has relatively stable warm mode, and a metastable cold mode. We are on the cusp of the metatable mode so just a tiny bit of cooling and it’s all over to the cold side. So prior 1500 year cool events did not trigger the ice age cometh… but the next one likely will as we have lower insolation 65 N and shorter summers N. H.
Per this graph:
http://3.bp.blogspot.com/-DwvUGTr-V9A/UccGZEn31PI/AAAAAAAAAW0/m7ik6M2Uy6w/s1600/DO_08.jpg
from:
http://astroclimateconnection.blogspot.com/2013/06/are-dansgaard-oeschger-d-o-warm-events.html
we are at the top of the warm run and the next hard bottom (middle of the cold plunge) is in about 2200 AD.
I hope he is right, as that gives us about another 60 years before the cold plunge. I suspect that there is another factor he isn’t including and that the plunge likely comes between 2016 and 2040, but that’s a long speculation that doesn’t belong here.
In any case, the thing to watch is persistent snow in Eastern Canada, and Florida having a great time while London is talking snow and Holland is having grand ice skating fairs…
l don’t think that changes in the North Atlantic Drift are the cause of ice ages in the NH. But rather its a effect of the changes in the weather patterns that leads to increase in cold Arctic air flowing across eastern Canada and then over the northern Atlantic. Which then leads to the cooling of the northern Atlantic. This is what l believe happened during the last ice age
Gravity exists because the earth loves the things on it and wants to hold them dear.
earth gave consciousness to things to protect it.
or Alien intelligence gave earth to its creation ( us )
or It is all one gigantic fvckup of accidental stuff which will soon pass.
The Hitchhier’s Guide entry for Earth is: “Mostly Harmless”.
That is the most authoritative source available.
We apologise for the inconvenience.
I thought gravity was higgs bosons sucking.
What fits the global temperature trend data the best since the Holocene Optimum- Present is what I suggest below.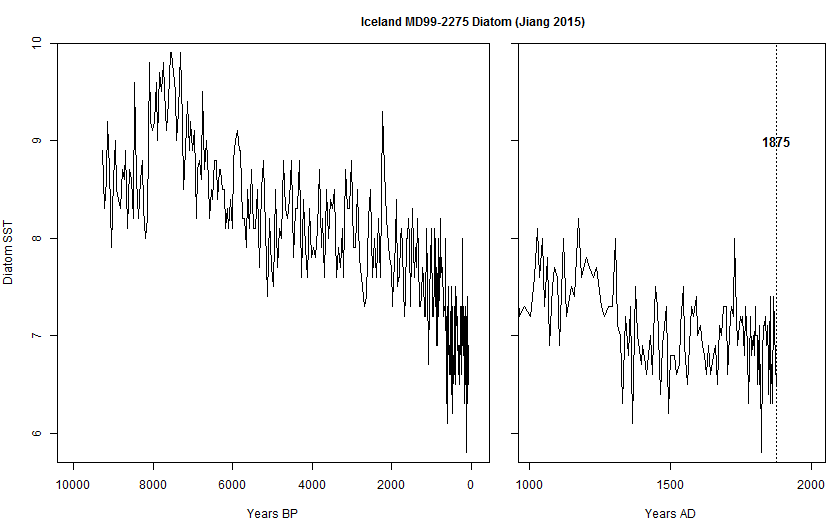
My thoughts on what drives the climate conform to what the data shows(present/past), unlike AGW theory which totally ignores the data both present and past.
AGW theory wants the data to conform to what it suggest, not the other way around.
More data which shows since the Holocene Optimum from around 8000BC , through the present day Modern Warm Period( which ended in 1998) the temperature trend throughout this time in the Holocene, has been in a slow gradual down trend(despite an overall increase in CO2, my first chart ), punctuated with periods of warmth. Each successive warm period being a little less warm then the one proceeding it.
My reasoning for the data showing this gradual cooling trend during the Holocene ,is Milankovitch Cycles were highly favorable for warming 10000 years ago or 8000 BC, and have since been in a cooling cycle. Superimposed on this gradual cooling cycle has been solar variability which has worked sometimes in concert and sometimes in opposition to the overall gradual cooling trend , Milankovitch Cycles have been promoting.
Then again this is only data which AGW enthusiast ignore if it does not fit into their scheme of things.
http://www.murdoconline.net/wordpress/wp-content/uploads/2011/01/gisp2-ice-core-temperatures
The ice traps gases that are well-mixed globally, so ice cores reflect global temperatures.
So globally it’s about 5 degrees celsius?
There’s a reason Roman soldiers wore short skirts and sandals!
“The much vaunted and much feared “fatal” tipping point of +2°C would only bring Global temperatures to the level of the very congenial climate of “the Roman warm period”.”
Temps are already warmer now than the Roman warm period!!
http://www.skepticalscience.com/pics/c4u-chart7.png
Martin,
Tell us who is inserting the blue “+” signs into Prof. Ole Humlum’s chart?
That person is also altering Prof. Humlum’s original chart. The fabrication you posted has the recent blue line extended upward. Where did you get that fake chart from?
Here is the original:
http://www.climate4you.com/images/GISP2%20TemperatureSince10700%20BP%20with%20CO2%20from%20EPICA%20DomeC.gif
It is Alley’s data not Humlum’s and the time axis is incorrectly labelled, the last data on are from ~150 years ago. It’s hard to take the original post in this thread seriously when it uses the same graph three times with the same error in it!
Phil.,
I wrote:
Tell us who is inserting the blue “+” signs into Prof. Ole Humlum’s chart?
It is Prof. Humlum’s chart — exactly as I stated, Mr. Insufferable.
Now if you can stop nitpicking for a minute, maybe YOU will tell us who altered the chart by extending the blue line?
But you probably don’t want to, because then you would be arguing about why your side feels the need to fabricate a chart to show bogus warming.
But by all means, if you want to have that discussion, I’m up for it. Who forged Dr. Humlum’s chart?
Humlum plots that data in recent paper and quite clearly indicates that the last data point corresponds to 1855 AD so I’m sure he wouldn’t like to see this article’s misrepresentation of his graph, he also correctly indicates the source of the data, which the versions plotted in the OP do not.
http://www.nipccreport.org/articles/2011/nov/HumlumetalFig1.png
Phil.,
You replied to my comment pointing out that Martin had posted a forged chart. But you answered by not answering; by changing the subject, and pretending the original chart is wrong. My point was that it was altered, without noting the fact. That’s devious.
Why not answer the question: who put in the fake alterations? And if you don’t know, why are you giving it a pass? Instead, you changed the subject to a different graph that doesn’t answer the question.
Phil, you lost the ‘global warming’ debate/alarm a long time ago. Now you just can’t admit that there is anything unprecedented or unusual happening. You bought into the “dangerous man-made global warming” scare early on, and now you’re stuck in that corner. So you give an A-OK to Martin for what he’s done here. As for Martin, he’s skedaddled.
You can get out of that corner, and people would respect you for it. Like many others, I also thought there was a problem in the late 1990’s, when global T began to rise fast. But that didn’t last, and there has been no upward trend in temperatures since then.
It would look much better if you tried being a stand-up guy and admitted that like lots of folks, you were wrong about dangerous global warming. That’s good advice. Whether you take it or not is up to you.
It’s not a forged chart stealey since both are plots of Alley’s data, the second graph which upsets you so much appears to have been produced by Rob Honeycutt who apparently contacted Humlum about the error on his graph. The more recent version by Humlum which I linked to here makes the source of the data and its limitation more clear.
See:
http://www.skepticalscience.com/print.php?n=670
He says there quite clearly what he’s done, like you with many of your ‘charts’ Martin has apparently omitted the legend and source reference.
dbstealey June 1, 2015 at 2:04 pm
Martin,
Who inserted those blue plus signs in your chart?
The address of the graph appears to be on hot-topic.co.nz:
http://hot-topic.co.nz/wp-content/uploads/2011/01/GISP210k480.png
why not take a look yourself.
The author was someone named Gareth and the blue crosses are the GRIP site surface temperatures from Box
Phil.,
Thanx for the explanation. Now, can you explain how ice core records match air thermometer temperatures?
Next, Dr. Humlum says:
The GISP2 record ends around 1854, and the two graphs therefore ends here. There has since been a temperature increase to about the same level as during the Medieval Warm Period… [my emphasis]
So as we see, whoever added the blue line (Honeycutt?) extended it way, way above the MWP. That’s fakery, no? Also, if Dr. H is aware of the ‘correction’, why hasn’t he changed his chart? I checked just now, and it’s the same one I posted above. But going by his own words, if he did change his chart, the present blue line would still be no higher than the MWP.
There is still a big discrepancy between the fake chart and the real chart. Someone is posting false information, and I know why. It’s because climate alarmists have been consistently wrong, so posting misinformation is all you’ve got left.
If you let the facts, evidence and observations tell you what’s happening (and what’s not happening), you would switch sides and become a skeptic — the only honest kind of scientist. Instead, you’re trying to tell the observations how to behave. But I don’t think the real world is listening to you. Or anyone. It is what it is.
[BTW, when I post charts, they’re from all kinds of different sources. But in all of them that I’m aware of, the provenance is easily found. It’s something to do with the URL, and getting to the original source. If you need help in finding out how to do that, just let me know and I’ll be glad to walk you through it.]
dbstealey June 3, 2015 at 3:15 pm
Phil.,
Thanx for the explanation. Now, can you explain how ice core records match air thermometer temperatures?
I suggest you ask Ed Hoskins, he is the one using them as an atmospheric proxy in the OP.
Next, Dr. Humlum says:
The GISP2 record ends around 1854, and the two graphs therefore ends here. There has since been a temperature increase to about the same level as during the Medieval Warm Period… [my emphasis]
So as we see, whoever added the blue line (Honeycutt?) extended it way, way above the MWP. That’s fakery, no?
A temperature increase ‘to about the same level as during the Medieval Warm Period’ implies an increase of ~0.5ºC since the end of the graph, whereas the temperature change at that location is ~1.5ºC. Since the graph you complain about added ~1ºC and clearly indicated what was done it’s clearly not fakery.
Also, if Dr. H is aware of the ‘correction’, why hasn’t he changed his chart? I checked just now, and it’s the same one I posted above. But going by his own words, if he did change his chart, the present blue line would still be no higher than the MWP.
Since Humlum is reported as saying:
“Dear Rob
You are entirely correct; my error. I will change it in a short while.
Thank you very much for pointing this out.
All the best,
Ole”
I think you should ask him. It appears that at one time he did post a version with instrumental data appended but that doesn’t appear on his site anymore.
There is still a big discrepancy between the fake chart and the real chart. Someone is posting false information, and I know why.
There is no ‘fake’ chart there are just other versions of Alley’s data, some of which indicate the change in the temperature at that location since the most recent datapoint in the core. That is not ‘false information’ it’s actual data, which in the originals is correctly cited. There are also many versions of Alley’s data plotted with incorrectly labelled time axis, some of which you post despite having been told of their error. In fact a whole thread was devoted to rooting out the ‘fake’ ones.
http://wattsupwiththat.com/2013/04/13/crowdsourcing-the-wuwt-paleoclimate-reference-page-disputed-graphs-alley-2000/
If you let the facts, evidence and observations tell you what’s happening (and what’s not happening), you would switch sides and become a skeptic — the only honest kind of scientist.
I do, which is why I object to bad misrepresentations of data. I find a correctly labelled version of Alley’s data with reference to how much that site temperature has changed since the end of the core as being very useful.
[BTW, when I post charts, they’re from all kinds of different sources. But in all of them that I’m aware of, the provenance is easily found. It’s something to do with the URL, and getting to the original source. If you need help in finding out how to do that, just let me know and I’ll be glad to walk you through it.]
Since I had to find the source of the two graphs above for you, I’ll pass on your advice thanks.
Phil. says:
Since the graph you complain about added ~1ºC and clearly indicated what was done it’s clearly not fakery.
Clearly it is. On the same graph the fake blue line goes way, way above the MWP.
And:
I object to bad misrepresentations of data.
I get that: you only like the good misrepresentations, like Honeycutt’s.
Martin,
How did you get the global temperature anomaly values on the right hand axis of your graph?
Ah yes, another author who thinks it’s legitimate to splice the faulty thermometer record onto the end of a proxy record.
Martin @ur momisugly 1:51 pm
The ice core graphs are low resolution smoothed averages, smoothed to many hundreds of years.
It’s wrong and absurd to splice the recent temperatures on the end, “… the habit of extending smoothed graphs beyond their formal limits is widespread today …”:
http://www.climate4you.com/ (data smoothing).
Martin, No, they are not even close to Roman warmth yet. The Modern Warm Period still hasn’t had a single 50 year period as warm as a number during the Medieval WP, let alone the Roman.
sturgishooper (replying to Martin)
For reference, what are the established (accepted) maximum global average temperatures for the Minoan, Roman, and Medieval Warming Periods? Obviously, they are not a single, well-defined “peak” but a range of high temperatures that themselves cycle by a 60-70 year short cycle – plus other added short-term events like volcanoes and the like. All three long-term cycles peaked than today’s Modern Warming Period maximum of 2000-2010, but how much higher?
The ice core records stopped at 1855. It’s much warmer now…
http://hot-topic.co.nz/wp-content/uploads/2011/01/GISP210k480.png
Martin,
Who inserted those blue plus signs in your chart? You do understand that ice core data cannot be recent, because the snow has not compacted into ice yet? And ice core data is not directly comparable to air thermometer data. You need to provide a reliable provenance for your chart. Please tell us the name of the person that put in those blue plus signs.
Here are some current temperatures, versus model predictions:
And:
Martin June 1, 2015 at 1:52 pm
As Dave has pointed out, splicing a thermometer reading on the end of a proxy graph results in exactly garbage. That said, those temps are summer day highs. What do you suppose the night temps were on those days? What do you suppose the high and lows were on a couple of days six months later in January? What do you suppose was the ave of the high and low of those July days and January days? That’s why Humlum doesn’t go there on your graph at 8:56 pm. Greenland is likely warmer (on average) than it was in 1855, but it’s still not as warm as it was during the MWP, let alone the RWP. And given the cessation of 20th century warming, it’s very unlikely to do so.
yes sceptical science. graph. they forget one thing: they plot an actual value against a several hundred years “smothed curve” that uses proxies.
in a scientific way that means that blue cross indicating 1855 is a value for that year so take that difference and plot similar crosses below and above this graph. than you have an idea of the annual variation that has been smoothed out in this proxie graph…. that gives you blue crosses far above the scale of this graph. far hotter then your 2008 dot.
nice try but in science this is a garbage graph: first the smoothing factor of the proxie graph needs to be known, the raw data needs to be known, then you have to add the data from 1855 to now to the raw data of the proxy study and then apply the smoothing again. i bet the result won’t be that impressiva anymore still far under the MWP….
Martin,
Greenland is not that much warmer now than in 1850. Your points are fictional.
We can argue about how accurate the ice core data is but the climate on Greenland supported Norse farms one thousand years ago that now lie under permafrost.
I’m not a scientist but that is all the evidence I need to know that it was warmer then than now.
It’s getting closer, however. They have recently advanced from goats and sheep to an experimental herd of about 20 dairy cows. Although, they’re not yet growing all the fodder and grain needed to support them. During the MWP the Norse did that and that is how we know conclusively it was warmer then than now.
Hoskins is being dishonest. He claims “The much vaunted and much feared “fatal” tipping point of +2°C would only bring Global temperatures to the level of the very congenial climate of “the Roman warm period”.”
But he has provided no data to support that claim and, in fact, the claim is false. Greenland temperature is not global temperature. It is far more variable. Just compare the Greenland variability during the holocene in Hoskin’s first figure (about 5 K) with the Vostok variability in his second figure (maybe 3 K). And global temperature changes, as indicated by ocean sediments are much smaller than Vostok changes (about half).
If I remember correctly, most proxies show NH temperatures for the roman and medieval warm periods somewhat smaller than present temperatures, although the uncertainties are so large that we can not say that with any certainty.
The question of why we are not presently in an ice age is an important one. The answer might be that we have CO2 from anthropogenic activity (clearing forests) to thank for saving us from that disaster. But fighting the nonsense from the left will take arguments based on science rather than cherry picked data inappropriately applied.
http://www.lwhancock.com/images/Ljugzvist2010.gif
Thanks, Chris. So I should have said “about the same” rather than “somewhat smaller”.
One should be cautious in comparing past temperature obtained from ice core data to the globe as a whole. Various surface regions can have rather different temperatures, and few humans lived near the poles during the Holocene. Different proxy temperature data obtained by various techniques across the northern hemisphere (and some SH) give quite different patterns over the Holocene.
The current warming episode has followed a similar pattern:
http://www.climate4you.com/images/MSU%20RSS%20TropicsAndExtratropicsMonthlyTempSince1979%20With37monthRunningAverage.gif