From the Helmholtz Centre for Ocean Research Kiel (GEOMAR) and the upside down Mann-world department:
Ferromanganese crusts record past climates
Marine scientists reconstruct past variations in Arctic climate

In the past decades ferromanganese crusts have been the focus of interest due to their resource potential of valuable metals such as cobalt, nickel or rare earth elements, which are highly enriched in these crusts. For the moment, however, the cost of underwater mining outweighs their cost of recovery. Future price development will change this and deep-sea mining may one day become profitable. In their new study, the German marine scientists show that their metal content is not the only value of these crusts but that they are also archives of past climate changes.
Ferromanganese crusts are up to 26 centimeters in thickness showing laminated growth, comparable to tree rings, but on a much longer time scale. Crusts grow at incredibly slow growth rates of only a few millimeters per million years. Forming on the summit and slopes of submarine mountains these chemical sediments thus record changes in ocean chemistry reflecting the evolution of ocean currents and climate on the continents over the course of millions of years.
But how is the information stored in the crusts? The main ultimate sources of chemical substances in seawater are the rocks of the continents. Weathering erodes and dissolves the rocks and transfers the chemical components to the oceans. Some of these substances inherit the “geochemical fingerprints” of their source regions and travel around the globe together with the ocean currents. Changes in climatic conditions, such as the emergence of large-scale glaciations on the continents during the ice ages, have led to a change in the chemical composition of seawater. The huge ice shields grind the rocks more efficiently and release greater amounts of certain chemical compounds to the oceans. “This is how we can track how the conditions on glacial North America changed during the establishment of large past glaciations”, Veit Dausmann, lead author of the study, points out.
Three ferromanganese crusts from water depths between 2200 and 3600 meters were analysed in the study. The specimens are only a few centimeters thick and were recovered from the Canada Basin of the Arctic Ocean during a cruise of U.S. Coast Guard icebreaker Healy in 2005 to explore the US Exclusive Economic Zone in the Arctic Ocean. “Seven million years of the ocean’s past are archived in these crusts”, states James R. Hein, Santa Cruz-based geologist at the USGS and co-author of the study. The ages were determined using the naturally occurring radioactive isotope beryllium-10 at ETH Zurich.
The time series of the geochemical fingerprints show that due to the sluggish mixing of deep waters in the Arctic Ocean, changes in climatic conditions on land have left a particularly distinct record.
The new data show that approximately four million years ago large climatic changes started to emerge that promoted increased glaciation of North America. Since one million years ago this effect has even been amplified in response to the drastic alternations between warm and cold phases of the ice ages. “Deciphering the climatic records preserved in these ferromanganese crusts closes a large gap in our knowledge of the Arctic regions’ past” explains Martin Frank, professor at GEOMAR and co-author of the study. “Due to harsh conditions and inaccessibility of Canada Basin’s long sedimentary records, our commonly used archives of long-term climate change, have not up to now been available.”
###
Original work:
Dausmann, V. M. Frank, C. Siebert, M. Christl, and J. R. Hein, 2015: The evolution of climatically driven weathering inputs into the western Arctic Ocean since the late Miocene: Radiogenic isotope evidence, Earth and Planetary Science Letters, 419, 111-124, ISSN 0012-821X, http://dx.doi.org/10.1016/j.epsl.2015.03.007.
Interesting but could only ever provide a coarse, or very smoothed, record of climate variation.
Yet environmental researchers splice current fine scale measures onto these coarse, smoothed-by-nature proxies and then proclaim how the modern sudden, steep rise is not only hotter, but its rapid rise is unprecedented in the historical reconstructed record, and is therefore mann-made. It is this splicing that is repeated across reconstructions by several research groups, thus adding to Mann’s oft repeated contention that his methods are robust and repeatable.
+97
just a trick of nature…but well spotted Pamela.
Very good point Ms. Gray.
They can still be used to help verify other proxies.
So … they can mean global measure temperature changes to within +/- 0.0001 degrees C.
Am I reading that correctly?
Sorry… “can measure mean global temperature changes …”
Writing funny you are.
English is my 23rd language, so occasionally I make an errer.
We all do on occasion, however, what is the theoretical resolution of this method?
Graph from the paper does show an inverse hockey stick with acceleration over the past million years, perfect for another ‘upside down Mann’:
http://hockeyschtick.blogspot.com/2015/04/new-paper-finds-long-term-cooling-of.html
I need some of the Koch brothers funding myself. Can WhatsUp help me with some tips to apply? Also give me a reference to from you so Koch’s will know I’m a genuine fossil fuel friend.
I promise to give you a 10% cut. Deal?
Thank you!
Bill g
Proxy looks like it works. Last 8 million years of 2C or 3C general temperature decline and then another 5C decline in the deepest ice age periods. New proxy compared to d18O.
http://ars.els-cdn.com/content/image/1-s2.0-S0012821X15001442-gr004.jpg
Some other interesting points about the Arctic Deep Water (which is mainly about -0.5C). Residency times can be several hundred years before it makes it out into the Atlantic to become the Atlantic Deep Water (about 1.0C) and becomes part of the thermohaline ocean circulation system (in reference to Michael Mann’s latest paper saying this water originates south of Iceland. NOT. It comes from the entire Arctic Ocean basin.) Hard to come by information so that is why it is here.
Cross-section.
http://ars.els-cdn.com/content/image/1-s2.0-S0012821X15001442-gr001.jpg
Overhead map.
http://ars.els-cdn.com/content/image/1-s2.0-S0012821X15001442-gr002.jpg
It is interesting to note that the “Mid-Pliocene Warm Period” at c. 3.25 Ma BP is completely absent, while the cooling at c. 2.5 Ma BP (Praetiglian) and the mid-pleistocene event at 1 Ma BP are fairly obvious.
The cross-section showing residence times hurts my brain.
The arctic sea ice mostly melts from the bottom up. The thickness is an inverse function of air temperature. In February the ice is easily thick enough to land a DC-3 on. By the end of April, you may have to tell a lie to get it to come back and take you out. 😉 The air temperature will have warmed up a lot but still be way below freezing.
The energy to melt the ice comes from the water. So, it seems to me that there must be a supply of warm water from the south. I have a lot of trouble squaring that with the minimum 10 year residence time shown on the cross-section.
commiebob
Going to strongly disagree with you there.
The Antarctic sea ice DOES melt from the “bottom up.” The slightly warmer ocewan water under the Antarctic sea ice does melt away at the bottom layers of the sea ice as the top stays cold (frozen) with fresh snow and ice on it. As a result, the Antarctic sea ice shows a dramatically different albedo pattern through the southern summer melt season than the Arctic sea ice does. Down south, the sea ice starts out about the same albedo 0.83, but then it only drops to about 0.80 in Sept-Oct-Nov, then 0.75 in Dec-January-Feb melt season. hen, by March, it has refrozen back to the “clean snow on fresh ice” again at 0.83-0.85 alebdo. Very few melt ponds down south, and the change from sea ice to open ocean in any given area is very fast.
The Arctic sea ice melts from the top down: With melt ponds staying in shallow pools all over the place on top of the sea ice, which itself does not melt as much. Thus Curry has measured the arctic sea ice albedo as dropping from a winter high of 0.83 down to a low of 0.38 in mid-to-late July. By August up north, the evening cooldown each night starts the re-freeze cycle all over again and albedo starts going back up again.
RACookPE1978 says: April 11, 2015 at 6:27 pm
In the places I’ve been (pretty much the whole Canadian Arctic Archipelago), most of the ice thickness is gone long before there is any melt on the surface.
commiebob
Odd. The “standard” arctic plots of ice thickness (deepest sea ice) all show those Canadian coastal inter-island shallows and narrows as consistently having the deepest areas of Arctic sea ice – as much as 5 meters over most of that area.
http://www7320.nrlssc.navy.mil/hycomARC/navo/arcticictnowcast.gif
Shallowest (thinnest) arctic sea ice is across the “pond” on the northern Siberian coast.
AMO and the magnetic proxies
What is the most surprising is that the Earth’s outer core where its magnetic field is generated, oscillates at the same rate as the sunspot cycles ! an effect discovered by M. Vukcevic in the data calculated by Jackson(ETH Zürich ) and Bloxham(Harvard University).
The strongest component of the natural variability in global temperatures is to be found in the N. Atlantic’s Sea Surface change, better known as the Atlantic Multidecadal Oscillations of for short the AMO, which is de-trended SST.
The effect of these oscillations appears to be directly reflected in the AMO
more info HERE
Calculations by Jackson et al are complex : “The zonal toroidal t_1^0 and t_3^0 components of a fully time-dependent geostrophic flow constructed under the frozen flux hypothesis are used to estimate the core angular momentum (CAM) using the hypothesis of Jault Gire and LeMouel (1988).”
(References to be mentioned when data are used: Jackson A., 1997. Time-Depency of geostrophic core surface motions, Phys. Earth Planet. Int., 103, pp 293-311.)
How does it work, I do not know, more research needed ! but do not, I repeat do not send any money, my research is financed entirely by my weekly pocket money allowance.
Sorry, I bungled the links:
http://www.vukcevic.talktalk.net/SUN-AMOa.gif
more info HERE
Vuk, without looking at your algorithm for “Solar-Earth” (your dependent variable?) or the AMO (your independent variable?) signal you used, I am guessing you have combined a very weak solar signal or signals with a very strong Earth signal or signals to arrive at your Solar-Earth indices. When people do that, (mix strong signals with weak ones) they need to show that the strong signals alone can or cannot also work.
So to that end, please show each component of your solar-earth signal alone compared with the AMO signal. In other words, you need to do a correlation analysis for each component of your equations.
Ms Gray
You guessed wrong.
As more often than not, you write without making an effort to understand. If you have bothered to take even glancing look at the link, you would find that it states:
“However, the intensity of geomagnetic field changes continuously. Spectral analysis reveals two strong components 16.1 years and surprisingly the same 21.4 years periodicity. Origin of the 21.4 years is most likely the same one as in the case of the solar magnetic fields, while origin of 16.1 years period is unknown, although the Himalayan monsoon exhibits strong 16 year periodicity, suggesting possibility in change of the Earth’s rotation angular moment, due to mass transfer from equatorial to the higher latitudes.
Interaction of two above cycles with frequency A and B will give result…..” etc.
So you are guessing wrong! There is no need for “very weak solar signal” as you put it, it is all provided by the Tera amata.
All data information you need is in the link, with the AMO from esrl.noaa.
Seems that I have read this post before on another thread. Did you just cut and paste it here?
Hi Tom in Florida
This is for the benefit of those who may have missed it before, giving chance to Ms Gray and others to object to yet another ‘spurious’ correlation. I have found a good number of those, but even with best will in the world, it is not always possible to come up with a brand new one, consequently from time to time I resort to a bit of recycling.
It is as I reckoned. Because you over-parameterized the data, you made the elephant’s trunk wriggle. Your result does not demonstrate your thesis of a solar-Earth connection. It does demonstrate your lack of understanding regarding independent and dependent variables and how important it is to do correlation analysis of each variable alone compared to an observed phenomenon. In the case of your thesis, you are using the AMO as the dependent variable, IE the effect. You are using magnetic field/solar productions as the independent variables, IE the cause. However, you have failed to test each of your multiple components in your expression to see if one of them is the overwhelming cause while the rest sit there and do nothing. Furthermore, you must assume that the AMO causes the AMO. In other words, if your strongest correlation is the AMO itself to the AMO, while the others are far behind, you have not discovered anything. And if you are saying that one variable amplifies the other (ergo your expression), you are using a fudge factor which will only raise your parameterized result artificially above the noise, again not discovering anything.
Me Gray, you reckoned wrong again.
“you must assume that the AMO causes the AMO”
Do I need to?
Your comment is a meaningless twaddle..
Vukcevic:
Pamela is correct. In order to understand the effects of the independent inputs into a dynamical system, one needs to determine the autocorrelation of that system to isolate the feedback’s which are a part of the system.
DesertYote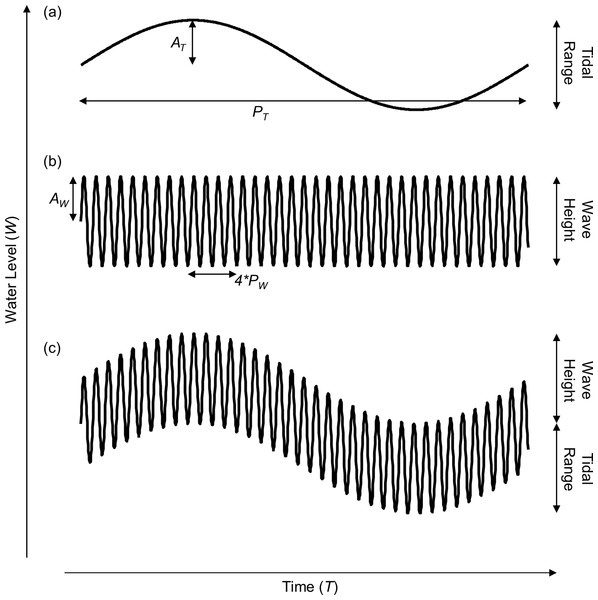
Unrelated frequencies that exist independently produce an effect called beating. The effect is well known in many natural processes from listening to two music notes (no example needed) to the ocean’ tidal system.
Frequencies of the initial excitation can be determined only by spectral analysis, if there are two input frequencies of similar amplitude then the result is A+B and A-B, consequently there is no correlation between either of two inputs and the effect.
Correct link
Where A and B are frequencies, not amplitudes
Vuk and Pamela : I find the discussion interesting, and Vuk I could do without the rancour. The Vuk logic as I see it is as follows: There are two periodicities in Earthly activity, namely 16.1 and 21.4 years, with the latter matching a periodic Solar activity. If sine waves of these periodicities and with equal amplitude are added together, the result shows a strong correlation to the AMO. In the Vuk logic, there is no more and no less, ie. the correlation is shown as interesting but without a mechanism. So far so good. But the adding of the two sine waves was at equal amplitude, while the two effects being combined might in reality be of very different amplitude, in which case the correlation with AMO is likely to be spurious. And this, if I understand correctly, is the point that Pamela is making. As I said, it is interesting, but (as Vuk says) it needs more work. The first step is surely to try to find the relative amplitudes of the two oscillations, and maybe for that we need to find some possible mechanisms??
One question: Vuk, why does the Earth Magnetic Oscillation in the first chart end at 1890?
Mr. Jonas
I am happy to answer any reasonable question if I know the answer.
Two amplitudes are within 15%, but the system may or may not have a flat frequency response, for simplicity I assumed the first rather than the second and since coincidence with the AMO proved to be good, didn’t think it’s wort complicating the matter any further.
Further more two components are likely to have amplitude -time dependency and that function can not be determined from the spectral output. .
Graph stops at 1980, because data is available only to 1990 (1995 publication), signal is result of the high-pass filter (30 years 6db down).
One could speculate:
Two frequencies are due to thermal convection of the liquid outer core, where the geomagnetic field is generated, with the ‘mechanical vibrations’ propagating through crust and magma all the way to the Mid-Atlantic ridge and further to the North Atlantic currents (subpolar gyre slowing down -Mann, speeding up –NASA, or whatever and whoever said it).
Why Atlantic not Pacific? Ring of fire in the Pacific is in the coastal proximity, while the MAR runs along middle of the Atlantic Ocean.
@ur momisugly vukcevic
” … [Ms.] Gray, you reckoned wrong again.
“you must assume that the AMO causes the AMO”
Do I need to?
Your comment is a meaningless twaddle..”
I would ask you to be polite, especially when addressing Ms. Gray. She is one of the more popular and fair posters here. I don’t always agree with her, but I always respect her.
It would be good PR on your part to be polite. (and yes, I should heed my own advice sometimes — the spirit is willing but the flesh is weak)
So? This has nothing to do with what I wrote. That you would offer this triviality up as a response to me would indicate that you did not understand what I wrote, and instead assume I am stupid.
Mr. Mark Stoval
I am happy to take put-downs from Dr. S who knows about the subject I research more than I do, but from those, from whose comments I realise that they do not, and it is obvious that they have not researched geomagnetism in any dept, expressing presumptuous criticism on number of occasions, it eventually becomes a bit tedious.
In order not to offend anyone’s sensibility, certain comments I may choose to ignore.
hmm, i look up the AMO in fresh search and the first mention of the Atlantic Multidecadal Oscillation is the 64th link-
http://www.aoml.noaa.gov/phod/amo_faq.php
i look up the question what drives the AMO? and this is the response –
“Models of the ocean and atmosphere that interact with each other indicate that the AMO cycle involves changes in the south-to-north circulation and overturning of water and heat in the Atlantic Ocean. This is the same circulation that we think weakens during ice ages, but in the case of the AMO the changes in circulation are much more subtle than those of the ice ages. The warm Gulf Stream current off the east coast of the United States is part of the Atlantic overturning circulation. When the overturning circulation decreases, the North Atlantic temperatures become cooler.”
Sooo… does this answer the question? not one bit. it just says it involved circulation that is different during ice ages? where is the cause? where is the understanding?
the understanding does NOT exist as to why the AMO exists or the PDO for that matter. ENSO models are trash and consistently wrong, so I think it is perfectly reasonable to expect people to attempt to understand the phenomenon. I think ANY correlation of the AMO to an external influence is a viable path of investigation. just because the influence on the surface may be small, does not mean it is nothing. it is true though that it needs to be a true correlation and not just noise.
I have no comment about your thesis at this time other than to say again the calculations you did cannot support or deny your thesis. You have put your original data through too many parameterized steps. And I knew that immediately when I saw your solar-earth and AMO comparison graph. It is a classic example of over-fit. My initial strong hunch was confirmed when I read your side bar on the steps you took to get to your graph. In summary, you have discovered nothing related to your thesis but your work is useful in demonstrating its parameterization of data steps to a false positive.
http://www.rasch.org/rmt/rmt222b.htm
Models of observations, which is what Vuk has attempted, are stylized examples, IE wholly manmade, that attempt to demonstrate the observations, thus speaking to relationships and possible causes. But by adding bits and pieces to his expression beyond the quadratic level, is where the error is made. Graduate students are prone to making this mistake not realizing that all they have done is not only defined the elephant, but made his trunk to wriggle. Vuk should know better.
By the way, I think the authors of global warming scenarios did the same thing, IE overmatched the training period of observations by adding bits and pieces to their expression, which resulted in overfit. Thus the models neither prove nor disprove anything about anthropogenic influences on climate because they were so over-parameterized to begin with, they no longer had anything to do with real climate observations.
Pamela – I agree with you re the overfitting of parameters in the climate models. I’ll take a further look at Vuk’s formulae to see if I agree with you there, too. It’ll take me a while …
@ur momisugly Vuk,
I’m way too f’n stupid to understand most of your comments.
After the way you talked to Pamela, I think I’ll just skip your comments in the future.
u.k.(us),
The discussion here centers on the subject of signal processing, and the modeling thereof. Here is a very popular text on the subject that is remarkable readable and incredibly interesting. As with accounting and statistics, it is one of those subjects that everyone would do well to have some familiarity with. (I hope I don’t sound smug. I’m merely trying to share I text that I have enjoyed immensely.)
http://www.amazon.com/Scientist-Engineers-Digital-Signal-Processing/dp/0966017633/ref=sr_1_1?s=books&ie=UTF8&qid=1428812835&sr=1-1&keywords=digital+signal+processing+smith
vukcevic,
May I suggest that sometimes it is easy to mistake directness for aggression. And Pamela is nothing if not direct. Plus, internet posts are missing all of the facial and body language cues that help guide our reading of the other’s intent, so it is easy to find challenging responses as … well … totally $#@ur momisugly%& annoying.
But Pamela is a fair and interesting poster, and we are lucky to have her, so a more gentlemanly approach might be more appropriate and productive.
Humor might be more fruitful. (Isn’t that right, Peaches 😉
@ur momisugly Max Photon,
You’ll never see it coming.
Vuk, Pamela (if you’re still around on this thread) – Pamela’s right, it’s far too long a fetch from the 16.1 and 21.4 year periodicities to the AMO. The AMO displays a ~65 year oscillation (based on just 2 1/2 cycles) with noise that might have a ~9.5 year oscillation in it. Mapping that to Cos(A) multiplied by Cos (B) [A, B for 16.1, 21.4 cycles) without a mechanism is a huge stretch.
PS. Just my opinion, of coourse.
Hi all
Thanks for your comments. I look a various data files from the major institutions in the field: NASA, NOAA, MetOffice, Potsdam, ETH Zurich etc.I have no idea how good or bad is the data, but if I dig out something of interest, I will bring it to the other’s attention.
I am more than content for readers to find it wrong, or the result doesn’t agree the way they see science, science methods or even their view of the world, that is all fine with me. If there are ambiguity I am happy to answer it. More often than not, even I do understand either meaning or value of what is found in the data.
However there is an underlining tendency of some commentators to discredit everything what may connect sun with the climate’s natural variability, by making own assumptions and building a non existing case, which eventually makes one irritable.
Ms Grey never asked a single question of clarification, made her assumptions, as she stated herself, and as in the past firing off, by now familiar sharp shooter of ‘excessive parametarisation’ (whatever that is?, there are only two variables in there 16 &21) and elephants trunks routine.
I don’t know what ‘twaddle’ expression means elsewhere, but in the circles I move it’s used to a characterise an incoherent voluminous wordage (this comment may be a good example of a ‘twaddle’ ), so
if Ms Gray and anyone else found it offensive my unreserved apology to all.
Having said all that, the right or wrong ‘parametarisation’, I will continue to plough onwards regardless.
vuk
Mr. Vukcevic:
It gave me pause when you said:
Correlations can be interesting and are particularly popular in climatology (cf. Mann’s proxy reconstructions). However, as you know, scientific explanations require uncovering and describing the actual cause-and-effect process and the elimination of plausible alternatives. I encourage you to continue your research with that in mind.
opluso
Thanks. Data is there, good or bad, often hard to tell a difference. The fact that data apparently show that deep in the Earth’s interior there are changes matching those of the solar cycles (a very ‘inconvenient’ and puzzling fact I discovered !) if it is verified by other means (need to get embattled Willie Soon onto it) , it should be of interest, even if a minor one, to those who are not entirely content with the ‘settled science’.
Coincidental or causal correlation with the AMO, may or may not mean much, but it existence could be an interesting ‘side band’ to the helio-terrestrial magnetic oscillations.
BTW. About a week ago I put link to the same graph on the Gavin’s RC blog, he normally dispatches most of my comments to the ‘bore hole’, but for some reason decided to keep this one, the hesitant vote of ‘support’, if I may say so.
If the global temperatures’ pause continues in the next few years, and sun is inevitably winding down rather low SC24, with absence of major volcanic eruptions, the blame is going to be attributed to the sun, some may not like it but there are some signs of the ‘blame the sun’ already.
Ooohhhhhhh … see, I thought it was a girlie part.
Well carry on then.
Indeed, she can be a bit of a modern day Annie Oakley from atop her high polynomial.
Nice song.
I think I’ll replay it now.
Hi Max
Here are some alternatives from my MS Word synonym alternatives
twaddle =
nonsense
balderdash
drivel
claptrap
baloney
tripe
garbage
Any one is more than welcome to use any of the above at any time I post a ‘spurious’ correlation or graph.
Jesus Christ, I guess it is true, given enough rope a man will hang himself.
vukcevic,
Just so we’re clear, I was only kidding about ‘twaddle.’ I love language, and it’s a great word with a great sound to it — very fitting for what it describes.
BTW, I think that you too are a victim of posts sounding harsher than intended because of the missing information provided by verbal tone, body language, etc.. And it is incredibly irritating when people dismiss one’s writings out of hand based on fixed ideas in their minds; I have studied the monetary gold standard for decades, yet people smother me like a wet blanket with their demonstrably wrong misconceptions when I get half way through the first sentence. It’s sooooooo annoying!
Plus, I’ve seen other posters, such as SHF and Brandon, receive far rougher treatment, and no one seems to care. Pamela, while deserving all due respect, should receive no special quarter (nor, I would imagine, does she expect any).
I will give her credit for making me think more about your efforts. While I certainly understand the modeling problem of introducing ever more variables to make things fit, I am still trying to get my mind around how she is using ‘excessive parameterization’ and ‘wiggling the elephant’s trunk’ and how it related to your work.
Keep it up. I think the sun-earth connection is woefully under-valued. I look forward to following your output 🙂
Max
Since “Horse With No Name” was so awesome, let me add this here just …. well, because life is short …
Thanks Max.
People are entitled to their views. If I cared much about refinements of the ‘scientific’ presentation etiquette and statistical bamboozling, I wouldn’t have done a thing. It is all there to make a big deal out of the diminutive thinking and keep ‘not conversant’ (which I am) out.
Like the songs, they remind me of the good old seventies, I did a 6 weeks greyhound summer tour of the USA. Very often someone with a guitar would join trip and make long journeys more pleasant. Went on business back in eighties and nineties, but it wasn’t as memorable, I had more money, stayed in good hotels, but still I do prefer to remember America as it was in the early seventies.
Max Photon : “I am still trying to get my mind around how she is using ‘excessive parameterization’ and ‘wiggling the elephant’s trunk’ and how it related to your work.“. Here is my take: Vuk starts with the 16.1 and 21.4 year cycles, both of which are claimed (I haven’t checked) to exist in Earthly data and the latter in solar data. He then moves to abstract formulae Cos(A) and Cos(B) based on those two periodicities. There are then a very large step : he transforms the formulae into the more complex and ?probably? meaningless Cos(A)xCos(b). After scaling and rebasing, this is then superimposed on the AMO graph to show a good fit. Now I am not going to claim that the good fit is necessarily a fluke, but it is the case that it took a fair bit of work with the initial parameters to get to the “match”, and it is the case that the more work you do to get a match the less value the match has – the risk of over-parameterisation [“With four parameters I can fit an elephant, and with five I can make him wiggle his trunk” (attributed to John von Neumann), ie, by using enough input variables, you can get any result you seek. There’s a brilliant web page where someone demonstrates a trunk-wiggling elephant with 5 parameters, but just now I can’t find it.].
Mr Jonas hi,
Thanks for effort you put into, your prejudice free comments, a rare commodity nowadays are appreciated .
There is Grand Canyon size precipice between simple equation and a complex natural event as the SST variability in the N. Atlantic.
There is already well know observationally established 21.4 periodicity (either by spectral analysis of SSN from 1860) or doubling average length of the solar cycles for the period (Hale Cycle).
Finding 16.1 year is a more of a problem, ‘climbing a high mountain’ so to speak, and they don’t come higher than Himalaya. Indian Ocean monsoons could be one of the sources, but not that obvious. Possible role of Himalayan monsoon is discussed in the link containing the equations.
Numerous papers have shown that monsoons are highly influenced by el Nino. I had another look into this, and found that can be easily demonstrated that monsoon’s variability is function of the solar periodicity and el Nino. This gives one more parameter i.e. el Nino (this von Neumann elephant can not only wriggle it’s trunk ant its tail, but this is excellent at playing cricket as well, the Indian national game).
I digress, I think it is much easier to demonstrate the ‘monsoon’ event as a function of el Nino and SSN, ant then step up to AMO.
Temporary condensed and concise conclusion : it appears that
the AMO is a consequence of Solar Activity and El Nino interactions
In short:
– Sun (or whatever drives it) is the elephant in the room
– el Nino is the big Pacific dog
– AMO is the N. Atlantic’s tail of the Pacific dog
Not possible to please (or for that matter, fool) all the people at all the times, but there is something in it for everyone ( 🙂 )
Can someone tell me what type of rocks where the source rocks for the Hf? And can someone tell me if the rocks have a consistent minerology? There is a little it (sarc) of geology missing in what i read on this page. I can’t afford to read the entire article so i din’t know if they described the source rocks for all of this material. It seems to me that all the depositional material would have come from differet parts of the bedrock as the glaciers moved and that you would have had changes in the chemical signature of the minerals in the bed rock, especially when you realize the distances the glaciers traveled. Oh, even i, as a lowly geologist, would recognize that over 7 million years the climate would change.
(sorry for any spelling errors)
mstar
April 11, 2015 at 9:40 am
“Can someone tell me what type of rocks where the source rocks for the Hf?”
Hafnium is always found with zirconium in minerals and Zr is about 200ppm in the earth’s crust. Moreover, it is wide spread, found in all granitic rocks and sediments derived from them – particularly quartzose sands. The Precambrian shield is about 3/4 granitic rocks and river borne sediments would carry zircon grains. I see no reason why halfnium wouldn’t be widely distributed on the ocean floor.
“Future price development will change this and deep-sea mining may one day become profitable.”
Is being programmed with a Marxist world view a requirement for being tasked with writing press releases? How about, “Future technological developments will change this …”. Just like the Marxists promoters of the disproved theory of Peak Coal, the authors do not take into account the ingenuity of people.
DesertYote:
Not sure how you detected Marxism in a basic assertion of demand and price signals (rather than government bureaucrats) driving economic outputs.
I think my post addressed that.
“The ages were determined using the naturally occurring radioactive isotope beryllium-10”?
Beryllium-10 is a light element, not common in the rocks of the continents which are “the main ultimate sources of chemical substances in seawater”.
The geologically short half-life (about 1.4 million years) means that there is essentially no Be-10 left from earth’s beginning about 3000 half-lives ago. The Be-10 they are looking at did not come from the rocks.
The main source of environmental Be-10 is the interaction of cosmic rays with atmospheric nitrogen or oxygen: http://en.wikipedia.org/wiki/Beryllium-10
That makes Be-10 a poor proxy for erosion/deposition or for time. If the rocks could be dated *independently* then Be-10 abundance would be a proxy for cosmic ray activity through time.
Be-10 scale is calibrated to remove the effects of cosmic ray activity. Its use is pretty standard.
Climate etc (via science link http://insideclimatenews.org/node/39010 ) reports
Coal utility Southern Company has funded five of Willie Soon’s research projects for a total of $469,560 since 2005. The company has confirmed that it will longer finance Soon’s work, which promotes the discredited theory that the sun is a primary driver of climate change.
Sorry – if our luminary changes output, might that have a n effect on the orbiting shards?
Other effects are – most certainly – are available: the WUWT did a good line in ‘possible effects’ – but I’ve lost the link.
the Sun surely is a driver.
Primary – well, if we get a thousand years’ worth of data, we may get a much better appreciation.
Auto
“Discredited?” Sure.
I am always excited by new research that provides information that helps shed light on the conditions that prevailed during the late Neogene. This is a period that is significant in the evolutionary history of carnivores. The opening and closing of and bridges had a direct impact on the animals that exist today.
It disturbs me, that it seems that all new research must be subjugated into providing narrative for the Cause. Doing so, destroys the contribution to science that the research could have provided. I hope that is not the case here, but without reading the paper …
“Seven million years of the ocean’s past are archived in these (ferromanganese) crusts”, states James R. Hein, Santa Cruz-based geologist at the USGS and co-author of the study.
This is fascinating science! The slow deposition rate (a few millimeters per million years) make these crusts ‘witness marks’ for 10e5 year changes in iron and manganese ion concentrations in the deep arctic ocean waters. The changes in ion concentrations are purported to be enhanced or degraded by changes in glacier activity, with the advancing glaciers acting as monstrous ‘ball mills’ to powder the iron and manganese bearing granitic rocks, thus freeing higher extraction yields and solution concentration into seawater. Presumably the ferromanganese deposition rates increase with higher concentrations and decrease with lower concentrations, making the ‘hundred thousand year growth rings’ of the deep water arctic crusts analogous to annual growth rings on a tree.
These ferromanganese crusts should also provide accurate records of earths magnetic field shifts, for the specific locations and periods of deposition.
How would algal uptake of iron affect the long term trends in the arctic ‘crusts’? Would it only offer a comparatively short term ‘transient response’… or would it perhaps cause a substantial portion of the the iron to get deposited locally, with the dead algae as it settled into the local deeps? In other words, “How accurate could this deep arctic ocean based glaciation proxy possibly be?”
A bit ‘fudgey’… but still fascinating!
Vukcsevic,
Have you ever calculated or have any idea the magnitude of the eddy losses and subsequent heat production (induction heating) due to the time changes in the magnetic field of the Earth?
I asked this question of a geophysics prof ages ago. He said it was insignificant. I got the impression he did not want to think about it.
If we stick to the strict definition of Eddy Currents, I think your prof. was right. Eddy current is a result of a changing magnetic field. Since the earth’s magnetic field doesn’t change very fast, any resulting Eddy Currents would be relatively small. In this case, I would make the comparison with the nuclear fission that generates the approx. 20 terawatts of heat. http://blogs.scientificamerican.com/observations/2011/07/18/nuclear-fission-confirmed-as-source-of-more-than-half-of-earths-heat/
I would agree with the ‘insignificant’
Geomagnetic field changes (beyond period of few days – due to the solar radiation) is an excellent proxy of what is happening in the Earth’s interior.
My initial post (on April 11, 2015 at 9:16 am ) that caused furious reaction, has title
“AMO and the magnetic proxies”
What I find fascinating though, is that according to data, the solar and geomagnetic long term changes, both ‘oscillate’ at just below 22 years, so it appears that the Earth also has its own Hale cycle.
Difference with the Earth’s field is that ‘oscillation’ is sitting on the top of a much longer variability, where by the 22 year ‘oscillation’ makes about 20-25% in intensity of a centenary change, which again sits on the top of millennial change and so on.
Mr. Vukcevic:
In your linked information, you state that:
Yet you also noted that spectral analysis of the Earth’s geomagnetic field reveals a 21.4 year periodicity (among others). You further state that
Perhaps I missed it, but why did you assert a link between the sun and the AMO rather than between the Earth’s periodicity and the AMO?
Relying further on your “Sun and the AMO link”, if both periodicities are determined by the same outside source (Jupiter sidereal and Jupiter-Saturn synodic periods) then isn’t the outside source the true cause of the AMO’s periodicity?
most likely, you are the only one to pick up that subtle message, but that kind of assumption is considered to be in the realm of pseudoscience.
There is another even ‘stranger’ property of the AMO, pointing in the same direction, but I had enough fun for now.
http://www.beerorkid.com/avatars/love_your_job.gif
I goes without saying that most of the heat from the earth is from radioactive decay. I have observed at latitudes rapid magnetic changes in addition to the normal diurnal changes. During magnetic-solar storms the changes were significant as measured with a flux-gate magnetometers and set of Helmoltz coils ( 1 metre internal area, 1000 turns per coil.) It was not my experiment and was only helping with the instrumentation, so, I did not pay close attention to the measurements. I am still curious if the rapid changes have any measurable Earth effects: One of the effects being heating of the more electrically conducting rocks, The other being telluric currents.
The nice thing about ferromanganese crusts and concretions, particular in the sea which has lots of dissolved uranium, is that they can dated with high resolution particularly over the last 250,000 years or so using 234U/230Th isotope analysis via e.g. laser ablation mass spec or secondary ion beam mass spec. Even adventitious incorporation of non-authigenic detrital 230Th can be factored-out via the 232Th. For longer timescales 231Pa/236U can be used. In fact, via the lower members of the uranium decay series even sub-centennial and sub-annual time scales can be usefully studied. As a retired geochemist who was pioneering these techniques on ferruginous deposits back in the 1980s I am particularly pleased that the utility of such amazing deposits is finally getting the attention it deserves.
I do appreciate your enthusiasm for precipitated iron and manganese but they’re a torment for me in my house-hold porcelain.
Seriously though, sub-annual seems extraordinary.
Steve Short,
Some of the newer instrumentation, such as the Cameca IMS-7F GEO, make the extraction of data from manganese nodules a lot easier. Using the Cs+ it can detect down to 1-100PPB of Th
daughter products. It can also spatially map and create “tomographs.” I have seen better performance out of 1of instruments in the past, however the ability of duplicating the results in other labs was very difficult. With the new generation of commercial “:mass produced” instruments, replication of results is a lot less difficult.
The problem I see now is the human factor: The maintenance, calibration, operation, and data interpretation. Setting up analytical protocols and sticking to them, publishing results with all of the analytical conditions and data reduction, etc. The sad part is that most researchers have no idea of how exactly their instrument is making the measurements or how their software is reducing the data, or what the caveats are. Sound familiar??
Anyone else notice that the “two” crustal samples pictured at the beginning of this article appear to be either split from one, or just a reversed photograph?
Larry,
I think you should google Tiljander sediments.
who said it was two samples? the two pictures are simply 180 degree rotations of the same image…
The point presumably being that its that easy to make a case if making a case is the game you are playing..
On the solar stuff
There is a group of sunspots, I think it could be the SC24 largest, three of which are larger than Earth itself with a room to spare. That is not all, there may be another group just behind horizon, a new peak in SC24 ?
If so, kudos to Dr. S who predicted number of SC24 peaks about 3 years ago.
http://sdo.gsfc.nasa.gov/assets/img/latest/latest_1024_HMIIC.jpg
Future price development will change this and deep-sea mining may one day become profitable.
More likely the cost of recovery will become lower. That is how fracking has worked.