
The rise in temperatures along the U.S. West Coast during the past century is almost entirely the result of natural forces — not human emissions of greenhouse gases, according to a major new study released today in the Proceedings of the National Academy of Sciences.
Northeast Pacific coastal warming since 1900 is often ascribed to anthropogenic greenhouse forcing, whereas multidecadal temperature changes are widely interpreted in the framework of the Pacific Decadal Oscillation (PDO), which responds to regional atmospheric dynamics. This study uses several independent data sources to demonstrate that century-long warming around the northeast Pacific margins, like multidecadal variability, can be primarily attributed to changes in atmospheric circulation. It presents a significant reinterpretation of the region’s recent climate change origins, showing that atmospheric conditions have changed substantially over the last century, that these changes are not likely related to historical anthropogenic and natural radiative forcing, and that dynamical mechanisms of interannual and multidecadal temperature variability can also apply to observed century-long trends.
From a Seattle Times newspaper story: (h/t Dale Hartz)
The vast majority of coastal temperature increases since 1900 are the result of changes in winds over the eastern Pacific Ocean, the authors found. But they could find no evidence that those weather patterns were themselves being influenced by the human burning of fossil fuels.
…
Since the ocean is the biggest driver of temperature changes along the coast, the authors tracked land and sea surface temperatures there going back 113 years. They found that virtually all of the roughly 1 degree Celsius average temperature increase could be explained by changes in air circulation.
“It’s a simple story, but the results are very surprising: We do not see a human hand in the warming of the West Coast,” said co-author Nate Mantua, with NOAA Fisheries Southwest Fisheries Science Center. “That is taking people by surprise, and may generate some blowback.”
Source: http://seattletimes.com/html/localnews/2024601865_climateweatherstudyxml.html
The paper:
Atmospheric controls on northeast Pacific temperature variability and change, 1900–2012
James A. Johnstone and Nathan J. Mantua
Abstract
Over the last century, northeast Pacific coastal sea surface temperatures (SSTs) and land-based surface air temperatures (SATs) display multidecadal variations associated with the Pacific Decadal Oscillation, in addition to a warming trend of ∼0.5–1 °C. Using independent records of sea-level pressure (SLP), SST, and SAT, this study investigates northeast (NE) Pacific coupled atmosphere–ocean variability from 1900 to 2012, with emphasis on the coastal areas around North America. We use a linear stochastic time series model to show that the SST evolution around the NE Pacific coast can be explained by a combination of regional atmospheric forcing and ocean persistence, accounting for 63% of nonseasonal monthly SST variance (r = 0.79) and 73% of variance in annual means (r = 0.86). We show that SLP reductions and related atmospheric forcing led to century-long warming around the NE Pacific margins, with the strongest trends observed from 1910–1920 to 1940. NE Pacific circulation changes are estimated to account for more than 80% of the 1900–2012 linear warming in coastal NE Pacific SST and US Pacific northwest (Washington, Oregon, and northern California) SAT. An ensemble of climate model simulations run under the same historical radiative forcings fails to reproduce the observed regional circulation trends. These results suggest that natural internally generated changes in atmospheric circulation were the primary cause of coastal NE Pacific warming from 1900 to 2012 and demonstrate more generally that regional mechanisms of interannual and multidecadal temperature variability can also extend to century time scales.
http://www.pnas.org/content/early/2014/09/16/1318371111.abstract
“May generate some blowback” You get bonus points when you can answer the media with a subtle pun.
“but the results are very surprising: We do not see a human hand in the warming… ”
translation: The results surprised the authors.
Why do they assume me or anyone else is also surprised by this? There is much of their minds revealed in their sloppy writing.
Welcome to the great CAGW pullback where everyone is surprised over natural cycles and not a single person saw it otherwise.
Well – that’s because the assumption is that CAGW has been somewhat validated by the masses. It’s soft landing stuff… else it would not get published… just sayin’
And beckley makes the crucial mistake of not having a baseline for climate. You guys jumped the shark in the beginning by not establishing what the baseline (normal) for climate is. “Constant” is a made up word in climate science of today.
By the way,
“oscillation” can vary chaotically. It can be fun if you make digital music. The mechanism(s) is/are unknown for climate of earth, but the models nor the climate scientists provided any predictive value and therefore the falsity of alarmist theory is shown.
Dave in Canmore,
Funny, isn’t it? The internet’s largest, highest traffic climate site, WUWT, has argued the position that there is no evidence showing a human “fingerprint of AGW” for many years now. But this is news to these guys?
What they have discovered is the scientific skeptic’s default position; the Null Hypothesis. If there is any measurable evidence that human activity causes global warming, no one has yet posted it. AGW is based entirely on conjecture.
AGW may well exist. It has not been disproven. But with literally thousands of scientists searching for evidence of AGW for the past 30+ years, you would think that at least some verifiable measurements would have been produced, showing what specific fraction of the 0.7ºC recent global warming is supposedly due to human emissions.
But so far there are no such measurements. Not one. So there is nothing to try and falsify. Instead, everything is a conjecture: “Most” warming is caused by human emissions, some say. Or “Half” the warming is due to AGW. But testable, falsifiable measurements? None so far.
Science is nothing without measurements. But we’re still waiting for that first measurement showing just how much global warming is due to AGW. And now these guys find that they can find no measurements showing a human fingerprint on climate change. As Gomer would say, “Surprise, surprise, surprise!”
The correct sequence is: Falsify the Null. Consider alternatives. Make “make or break” predictions from each. Observe.
This study attempted Step One, and failed. So the Null stands, without need for further validation. Until the next (hopeless) attempt, it is only valid to assume the Null.
I wish you guys would stop confusing the statistical concept of the null hypothesis (e.g. no difference in sample means or the like) with an the possibility of alternative explanations for weather and climate phenomena in terms of “natural processes”. In the latter case, an explanation is still required – the natural processes are not in any sense “null”.
rw,
If you have thoughts on the Null Hypothesis, I would like to hear them. I would especially like to read more about “the possibility of alternative explanations for weather and climate phenomena”. Any alternative explanation must measurably affect current climate parameters, or it is nothing but speculation. Any explanation requires specific measurements — which are so far non-existent. Alternative explanations such as CO2=CAGW are nothing more than conjectures.
As I understand it, the null hypothesis is the statistical hypothesis that states that there are no differences between observed and expected data. The null hypothesis of climate science is that climate is always changing in a log-log fractal manner due to normal chaotic-nonlinear oscillation. CAGW has failed to falsify this hypothesis. Natural climate variability is the null.
The null hypothesis assumes that what has happened will continue to happen. If there are extraneous forces that are significant enough to measurably alter climate parameters [such as temperature] outside of their past parameters, the null is falsified.
But that has not happened. Everything currently observed has happened to a greater degree in the past. In fact, for that past 150 years or so, global temperatures have been amazingly flat, fluctuating by only ≈0.7ºC.
And as Dr. Roy Spencer writes, “The [climate] null hypothesis has never been falsified.”
Smokey, It is truly enjoyable to see you throw around words you don’t have a clue as to what they mean.
..
“in a log-log fractal manner due to normal chaotic-nonlinear oscillation.”
…
Thank you for the laugh.
Bud,
Obviously you did not understand. Sorry about that. Please explain where your knowledge ends, and I will try to help. Just because you don’t have a clue about what fractals are, or what chaotic oscillation is, it does not mean others don’t. This is a science site, you know.
So ask away, and I will be happy to help educate you. But if a laugh is what you’re looking for, you are on the wrong site. I would suggest going here.
1) If something is “oscillating” it is NOT “chaotic”
2) If something is “oscillating” it is by definition “non-linear”
3) You cannot quantify using the word “normal” as an adjective for chaotic. For example, what is non-normal chaos?
…
…
And of course this takes the cake…
..
4) If ” climate is always changing in a log-log fractal manner due to normal chaotic-nonlinear oscillation.” then by your own definition, it is not due to natural variability
I like this one ““Half” the warming is due to AGW.” Actually, that soft pedaling could more accurately be written as, ““Half” the warming is certainly not due to AGW”.
Using their same baseless techniques with CO2 as the input knob; when/if the planet cools, their wonky models would show that CO2 caused the cooling. But of course, they had to make some tuning adjustments to get the results they expected.
Buddy sez:
1) If something is “oscillating” it is NOT “chaotic” &etc.
Maybe and maybe not. Not all oscillations are sine.
You are doing what the alarmist clique does constantly: trying to nitpick endlessly, instead of confronting the glaring error in your Belief system: there is nothing either unusual or unprecedented happening. Nothing at all. Everything currently observed, now and for the past century+, has remained well within past parameters. Therefore, the null hypothesis has not been falsified.
As Brian says:
Falsify the Null. Consider alternatives. Make “make or break” predictions from each. Observe.
If you can falsify the null hypothesis, Dr. Spencer would like to hear about it. But so far, neither you nor anyone else has managed to do that. The null hypothesis is a corollary of the Scientific Method, and as such it is either ridiculed or avoided by your ilk. You choose to ridicule it.
We have been very fortunate to have lived through a real “Goldilocks” climate. Despite our good fortune, climate alarmists are trying to convince people who know better that “carbon” will cause climate disruption.
But you have exactly zero evidence for your nutty belief. All the wild-eyed gloom & doom predictions by the always-wrong alarmist contingent have been debunked. Now you have nothing left but to nitpick what others say, while avoiding the central fact: the claims of CO2 controlling the climate are baseless nonsense.
You hide out from commenting on this paper, because that is in essence what it says: there is no indication of human activity affecting the climate. What, you know more than the authors? As if. You don’t even understand oscillation.
You refuse to argue your belief that CO2 is the control knob of the planet’s temperature, because you probably know that is nonsense. Certainly you have no empirical measurements to support your repeatedly debunked CO2=CAGW conjecture. If you did, you would have posted them by now.
And you have certainly failed to falsify the null hypothesis. It is clear from your comments here that you do not even understand the concept.
“Everything currently observed, now and for the past century+, has remained well within past parameters.”
…
..
Really? Can you please tell me when, in the whole history of the Earth, prior to the 19th century, has a biological organism had the ability to dig down through 2 miles of solid rock to extract the hydrocarbons? This is certainly outside of “past parameters”
RE:beckleybud@gmail.com September 23, 2014 at 5:02 pm
“Everything currently observed, now and for the past century+, has remained well within past parameters.”
…
..
Really? Can you please tell me when, in the whole history of the Earth, prior to the 19th century, has a biological organism had the ability to dig down through 2 miles of solid rock to extract the hydrocarbons? This is certainly outside of “past parameters”
+++++++++++++
You do not understand how to ask questions. Your question is wrong.
You well know DBSTEALEY’s statement was regarding the topic of this post. He he specified the past century plus, not the entire history of Earth before we had any sort of climate information.
We’re talking temperature record, not whether or not we drill for hydrocarbons.
You should try to learn something here, rather than intentionally misinterpret what was being stated by others.
@ur momisugly Mario Lento
…
I commented previously on the word salad. He’s making ridiculous statements about “normal chaotic non-linear oscillations” as being the cause of climate He needs to learn how to write.
…
Secondly, he is confused about “past parameters” because the ability to drill through two miles of rock is well outside “past parameters” and may have a significant effect on climate.
Buddy,
Mario is right. You are deliberately obfuscating the issue, and for a very transparent reason: you cannot post any measurable evidence showing that human activity influences the climate. You are incapable of refuting the fact that human activity causes no measurable change in the global climate.
Next, here is an example of psychological ‘projection’: buddy here says I need to “learn how to write.” No, bud needs to learn how to read. Because after 4,800+ comments here, that is the very first time anyone has said they cannot comprehend what I’ve written. Obviously, the problem is with bud’s reading comprehension. No one else seems to have a problem understanding. [Maybe now bud can go find a sockpuppet somewhere to say they can’t understand, either. Time stamps will tell the story.]
Bud simply has no credible argument to make. That’s why his comments are so ad-hom. That’s all he’s got, because for sure he doesn’t have any verifiable measurements.
As a skeptic, all I’m saying is: produce testable measurements showing the specific fraction of a degree of global warming directly attributable to human emissions. Bud cannot do that, because he has no such measurements. His entire belief system is predicated on a baseless conjecture. No wonder he’s losing the debate.
Finally, bud says;
the ability to drill through two miles of rock is well outside “past parameters” and may have a significant effect on climate.
That statement is straight from outer space; from beckley’s Mother Ship. It has nothing whatever to do with past climate parameters such as temperature, humidity, extreme weather events, etc. Past climate parameters have all exceeded current parameters, therefore the Null Hypothesis remains as Dr. Spencer says, ‘Unfalsified’.
Buddy won’t go argue with a real climatologist like Spencer, because even if the good doctor responds, it will only be to put bud in his place — with a dunce cap on. So please, enough with the deliberate misdirection. Bugs in rocks are not climate parameters. Period. Full stop.
We have had this same conversation repeatedly on WUWT for the past several years. Everyone else understands what ‘parameters’ means — and it isn’t bugs 2 miles deep in rocks.
If we are going to have a rational science-based discussion, I am all for it. I keep asking that we confine it to the article, and not go off on outer space tangents. So, one final good faith attempt:
These scientists admit that they can find no evidence of human activity causing climate change. If anyone else has any evidence that human activity causes global climate change, the time and place to post it is here and now. Otherwise, the default position is that human emissions have no effect… and the Null Hypothesis remains unfalsified.
Challenge those unequivocal statements. If you think you can. Otherwise, I guess it’s back to the Mother Ship, for some new talking points.
[PS: Enough with ‘Smokey’. I have only one screen name. TIA.]
” any measurable evidence showing that human activity influences the climate. ”
..
Oh, I guess you’ve never heard of the urban heat island effect. Didn’t Tony write a paper about it?
…
PS, I apologize for calling you out on your word salad.
From their
Table 1. NE Pacific temperature trends
Temperature index Original SLP1 SLP1 residuals
SSTARC 0.47* 0.53* −0.06
SATARC 0.81* 0.66* 0.14
Western US SAT 0.75* 0.62* 0.13
Washington SAT 0.69* 0.66* 0.03
Oregon SAT 0.67* 0.64* 0.02
Northern California SAT 0.53* 0.51* 0.02
Southern California SAT 1.13* 0.69* 0.44*
Legend: Linear temperature trends (°C/century) for NE Pacific and western US
regions (July–June annual means,1901–2012). Original trends, trends predicted
by SLP1 based on linear regression, and trends of SLP1 regression
residuals (Fig. S4).
*Statistically significant (P < 0.05) values.
The key point I see is in the residuals. For example, the Western US SAT has a 0.13 deg C residual out of the 0.75 deg C total. Thus Anthropogenic component of warming is no more than ~17% of the total delta T from 1901 to 2012. That ought to keep a few CAGW scientists awake at night as their cherished CO2 demon is reduced to near noise in the dynamics of the climate system.
Further, the Southern California SAT, with a significant residual of ~39% of that original delta T, would make sense as that SoCal climate likely has been impacted by anthropogenic smog, UHI, and land use changes to a much greater degree over the previous 111 years than the other areas the authors broke out.
Finally, I really like the authors subtlety drive another wooden stake into the heart of the IPCC’s GCM beast, where they write,
“We conclude that internal variability is the
most likely source of the observed SLP decline and that current
GCMs may not adequately capture the underlying processes. It
is also notable that the strongest changes in NE Pacific circulation
and temperature occurred before 1940, when the combined
natural and anthropogenic net radiative forcing changes are
thought to be smaller than those in recent decades (42). Modest
regional warming since 1940 and a possible reversal of long-term
SLP and regional surface temperature trends between 1980 and
2012 suggest that low-frequency circulation changes in the NE
Pacific have not responded in a robust linear manner to anthropogenic
net radiative forcing.”
Joel, the authors answered part of my questions in the Supplementary Info. They used NOAA;s ERSST.v3b primarily, but I can’t find the coordinates for the sea surface temperature data.
Joel, I’ve downloaded their data, which was free, but they did not identify the coordinates or the dataset they were using. It appears you have access to the paper. If you would, please let me know which sea surface temperature dataset they used, along with the coordinates.
Thanks.
Materials and Methods
The primary SST data for this study consist of monthly 2°-gridded and fully
interpolated fields from the ERSST (23). Primary SLP data come from the
monthly NCAR Northern Hemisphere 5° analysis (24). The NCAR SLP dataset
is a quality-controlled compilation of daily surface map analyses from various
sources. Comparisons with other SST and SLP datasets are illustrated in
Fig. S3.
To objectively isolate large-scale modes of NE Pacific variability, EOF analysis
was first performed separately on normalized monthly matrices of SLP and SST.
The primary modes in each field were then compared, first by correlation, with
statistical significance estimated fromaMonte Carlo simulation using synthetic
random SLP1 series with observed levels of autocorrelation and low-frequency
variance. A stochastic time series model was created to estimate the monthly
SST1 response to a combination of SLP1 forcing and monthly lag − 1 SST
persistence, an approach originally developed in ref. 47 and applied in ref. 48
to describe atmospheric forcing of the extratropical oceans. This method has
been used successfully to explain the evolution of the PDO (9, 10, 14, 15),
although none of these prior studies have included the century-long trends in North Pacific circulation and SST. Monthly SLP1, SST1, SSTARC, and SATARC
indices are included in Dataset S1.
Monthly atmospheric and surface data obtained from 20CR (1900–2012)
include net turbulent heat fluxes (both latent and sensible), surface radiation
(solar and longwave, upward and downward), near-surface (10-m height)
winds, boundary-layer (2-m height) temperature, and specific humidity
(used to calculate relative humidity). Upper ocean dynamical and thermal
advective responses from SODA (1900–2008), which is forced with 20CR
surface winds, include near-surface (5-m depth) temperatures and horizontal
currents and subsurface temperatures and vertical velocities.
Linear regression was used to estimate monthly responses to a +1σ anomaly
of the leading pressure mode SLP1. Regressions were performed on monthly
indices over the 1920–2008 period during which both datasets are available
and 20CR circulation variability agrees well with the primary NCAR SLP
dataset (SI Text). Because century-long trends in 20CR heat fluxes and SODA
advection depart substantially from observed SST changes, regressions were
performed on indices treated with a 120-mo high-pass Hamming filter,
capturing the short-term responses reflected in the time series model. Statistical
significance was determined from Monte Carlo simulations using
random, identically filtered SLP1 series matching the observed level of
lag − 1 autocorrelation. Anomaly responses were computed separately
for each calendar month, and the overall responses were estimated as
the annual means of the monthly regression coefficients.
SATs around the NE Pacific margin were investigated with monthly station
data from the US Historical Climate Network, version 2 (USHCNv2) (49) and
the Global Historical Climate Network, version 3 (GHCNv3) (50), using adjusted
versions of both datasets. A NE Pacific Arc SAT index (SATARC) was
constructed from all 51 USHCNv2 and GHCNv3 coastal stations with at least
960 mo of available data (Fig. 1A). Monthly anomaly series were first calculated
for subregions of coastal Alaska (12 stations), British Columbia (3),
Washington-Oregon (19), California (14), and Hawaii (3). For each station,
missing data were infilled by monthly regression from up to three nearest
neighbors, defined by correlation coefficient. A small number of remaining
missing subregional estimates were filled by regression on neighboring subregions.
The final SATARC index was calculated as the unweighted mean of the
five subregional series, expressed in monthly degree Celcius anomalies with
respect to the full 1900–2012 period. Temperature indices were similarly
constructed for the US Pacific coast states, using all USHCNv2 stations to
produce monthly anomaly series for Washington, Oregon, and northern and
southern California, the latter divided at 37°N.
replied with their Methods and Materials section. It is stuck in moderation.
From the Results:
Leading Modes of NE Pacific SLP and SST
Empirical modes of NE Pacific (60°N–20°N, 180°W–100°W) SST
and SLP variability were initially determined by separate EOF
analyses of gridded normalized monthly anomalies for the 1900–
2012 period. The primary SST data come from the 2°-gridded
National Oceanic and Atmospheric Administration (NOAA)
Extended Reconstruction SST dataset, version 3b (ERSST)
(23). The leading SST mode (SST1) explains 30% of the total
monthly variance, primarily reflecting coherent SST variations
within an ∼1,000-km–wide band around the NE Pacific coastal
margins. This mode spatially resembles the PDO, but shows a
stronger relationship to SSTs near the North American coast and
a weaker connection to those in the central Pacific (Fig. 1A). The
monthly SST1 time series correlates most strongly with local SST
off northern California (r = 0.82 at 42°N, 128°W).
We formally define the NE Pacific Arc as the area within the
study domain where local monthly SST correlations with SST1
exceed 0.6 (Fig. 1A). The time series of SST1 expansion coefficients
is nearly identical (monthly r > 0.99) to an index of areaaveraged
SST anomalies within the Arc. This temperature index,
SSTARC, is used as a physically based metric of the statistical
EOF pattern. A 1 SD (σ) anomaly of the SST1 index corresponds
to an SSTARC deviation of 0.46 °C, with individual monthly relationships
deviating from this value by less than 10%. The monthly
SST1 index is positively correlated with the PDO index (monthly
r = 0.53), but displays considerably lower values before 1930,
partly due to the absence of the global SST trend in the PDO
index (Fig. 1B).
Primary SLP data come from the 5°-gridded National Center
for Atmospheric Research (NCAR) monthly analysis (24), previously
used in other studies of North Pacific low-frequency
variability (1, 2, 25, 26). The leading mode of NE Pacific SLP
(SLP1) explains 22% of overall variance, capturing coherent
anomalies over the central NE Pacific and most of the study domain
(Fig. 1C). The SLP1 index, oriented with positive values
reflecting lower pressure, correlates most strongly with SLP NE
of Hawaii (monthly r = −0.84) at 35°N, 150°W. These coordinates
lie near the center of the summertime North Pacific High, so that
SLP1 reflects variability of the subtropical anticyclone. In winter,
the center of the pattern lies between the climatological centers of
the Aleutian Low and North Pacific High, capturing southeastward
extensions of the cyclonic Aleutian Low circulation. The SLP1
index displays a positive long-term trend, signifying SLP reductions
over the NE Pacific from 1900 to 2012 (Fig. 1D). A comparison
with the inverted North Pacific Index (NPI) of Aleutian
SLP (27), developed from the same NCAR dataset indicates
stronger relative SLP changes in the east than in the center of the
North Pacific (Fig. 1D).
Thanks, Joel.
Cheers
We recently plotted and discussed the recent warming of that portion of the Northeast Extratropical Pacific…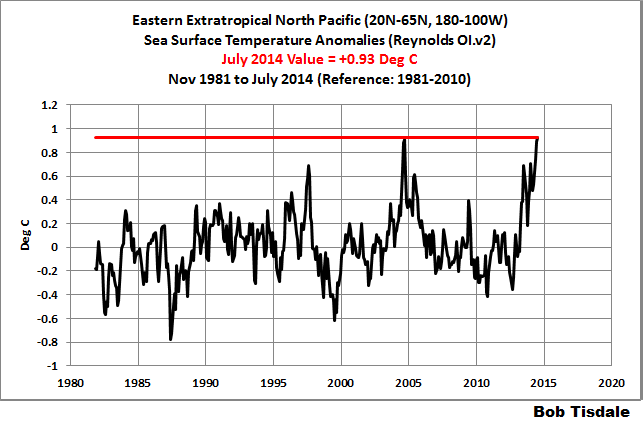
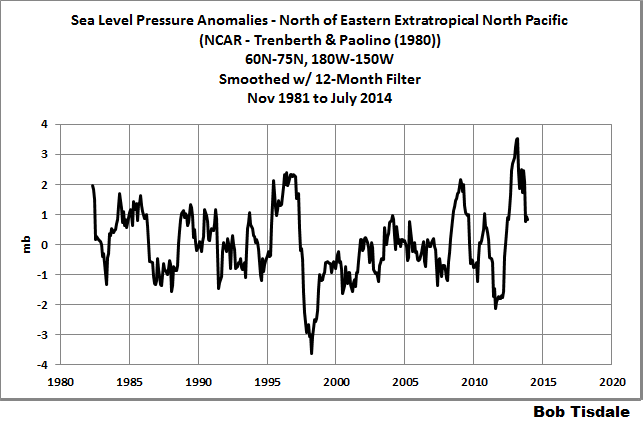
…in the following post:
http://bobtisdale.wordpress.com/2014/08/16/on-the-recent-record-high-global-sea-surface-temperatures-the-wheres-and-whys/
Not too surprisingly, I showed that the likely reason for the high sea surface temperatures there in 2013 and 2014 was a shift in sea level pressure (a blocking high):
I used a different region for the sea level pressure, though, than the authors of this paper.
Regards
Help wanted: Seeking new editor for prestigious scientific journal. /sarc
Lest you all forget, the usual suspects make the usual comments at the article end ( Seattle paper ) :
The UW’s “climate agenda” mouthpieces fall all over themselves to repeat the mantra that nothing is changed, that evil CO2 has set in motion doom for mankind AND that they are waiting for their monthly grant check to continue the fraud.
“Both authors were quick to point out that their study does not in any way refute that temperatures globally are on the rise or that humans are responsible for that trend.”
So is this caveat added to mitigate against agw abuse?..
YES!
It’s not a finding of the study; rather . . it’s an after-burp.
It would be interesting to know if the peer review process demanded the caveat, or if the authors were cagey enough to include it ahead of time. The observation was pretty much cost free. After all, to date no one has offered (outside of UHI and other micro to regional scale effects) evidence of human effects on climate. In fact the prospect of making a valid scientific argument for global scale effects is very poor, and getting more remote with time.
They seem to be implying that the wind has heated or changed the ocean, rather than the other way around.
Yes, increased wind and lower barometric pressure increase evaporation which cools the ocean. Evaporation is the primary way the ocean cools.
A warm surface creates circulation. Circulation does not make the surface warmer.
“The vast majority of coastal temperature increases since 1900 are the result of changes in winds over the eastern Pacific Ocean, the authors found. But they could find no evidence that those weather patterns were themselves being influenced by the human burning of fossil fuels.”
Speaking as a CAGW supporter, I would like to remind everyone that lack of evidence does not mean that human CO2 emissions are not the root cause of this change in climate.
/End of role play
JohnWho: However, zero evidence, or better yet, observational evidence that refutes your supported position hurts doesn’t it? Predictions and projections were made… they failed already. The only supposed evidence was in the models, and they can’t be made to show the correlation. In conclusion, you have no case by which to believe in CAGW.
Mario, you missed his /sarc
JohnWho: I’m sorry I did not understand “End of role play/” as sarcastic. Thank you Robert of Ottawa September 22, 2014 at 4:19 pm, for translating for me. I trust I was not rude.
No problem, Mario.
It just shows that I can play the role of a CAGW supporter very well.
Uh, not something I would put on my resume, that’s for sure!
/grin
Can I role-play a bucket of ice water over your head? 😉
Might help convince me never to “role play” as a CAGW supporter again.
At least, not here.
LOL
“Absence of evidence is not evidence of absence”
I seem to recall Tony Blair using that one w.r.t. WMD in Iraq.
How did that work out again?
Coalition forces only found about 600 or so weapons of mass destruction, which had not been successfully convoyed to Syria, but found no currently operating production program. Saddam himself declared that after the 1st Gulf War, his strategy had been to make the Western powers think that Iraq had an arsenal of nasty weapons and a program to create more. He did that in order to deter any future invasions. How did that work out again?
Alan Robertson September 22, 2014 at 7:35 pm
I concur. The al-Tikriti Mukhabarat strategy for comprehensive thinking, or too big to fail. Fanny Mae & Freddy Mac. Why on earth is simple arithmetic too difficult for erstwhile intelligent people? As a last resort bankers, read the instructions. The same applies to the climate change grifters. In the end, there can be only truth (for a given definition of truth). ;<]
Remember that super cannon they found and destroyed? I think it worked out well.
Absence of evidence in a court of law or any rational discussion means you have no case.
In the arena of public opinion absence of evidence means you can just make stuff up based on your hidden agenda.
Remember that super cannon they found and destroyed? I think it worked out well.
=============
not so well for the Canadian designer.
http://en.wikipedia.org/wiki/Gerald_Bull
Lack of evidence certainly does not mean that human C02 emissions are not the root cause of this change in climate.
Similarly it does not mean that the prevalence of black cats, witches, surfers or cafes with good coffee are not the cause either.
No evidence is needed to prove CAGW claims, eh? Here’s an exercise for you: From any of the many temperature data sets out there in the world, find and link to one which shows a clear CO2 signal affecting temperature.
Hint: there isn’t a modern data set which shows a clear link between atmospheric CO2 concentration and temperature. That’s certainly absence of evidence.
Alan Robertson and others who have made similar points.
For the reason stated above by dbstealey,
GregK makes a true and important point when he writes
THIS EMPHASISES THE IMPORTANCE OF THE NULL HYPOTHESIS.
Absence of evidence is not evidence of absence and is not evidence of presence.
Absence of evidence means nothing pertinent is known.
The scientific method requires that the Null Hypothesis must be adopted in the absence of evidence, and the Null Hypothesis is
Nothing is seen to have changed so it must be assumed that nothing has changed.
Forget WMD and etc.. This discussion is supposed to be about the scientifically defined threat of global warming. We assist scare-mongers when we allow them to define the global warming issue in political terms instead of scientific terms.
Richard
Pascal warned you about that. Pretended faith can quietly morph into the real thing, if you’re not careful!
The SI is viewable and has nice figs
http://www.pnas.org/content/suppl/2014/09/16/1318371111.DCSupplemental/pnas.201318371SI.pdf
Why did they need to say they found the facts “surprising”? This monstrous myth of AGW should never have been seen by ethical scientists as anything more than what it was, a theory that failed true scientific testing..
Game over, back to work!
The PNAS was surprised to find itself doing actual science, and was discombobulated.
The riposte to the engineered demonstration in NYC this weekend. The PNAS!
It’s
worsemore complicated that we thought.Exactly.
Heresy
Bishop A. Gore of the Church of AGW will not be pleased at their blasphemous work.
Spread the word throughout the land (especially in New York) … man’s done nothing of note to the climate.
Getting warmer. Yes, climate change comes from the oceans.
I wonder what effect this will have on California politics.
What about all the hot air? Population is like 5X or more. It is all in the BTUs. Has nothing to do with CO2.
Living in Bellevue, I was wondering why moans of disbelief and betrayal were rolling across Lake Washington from the Peoples’ Commune of Seattle. This Times article explains it. 🙂
Honestly, I’m shocked the Times ran it at all. I would be even more shocked if the editors haven’t been verbally threatened or physically accosted.
See my Judith Curry post on Shell Games. Better yet, read the underlying and forthcoming ebook.
A whole chapter takes on the junk science behind the Seattle Times Sea Change series.
Beyond bad science. Multiple indicia of scientific misconduct.
Now that’s the Times I’ve come to know and loathe. I get handed a free copy when I go to have my oil changed, and I politely say, “no, thank you.” The paper is even going to great lengths to leave free, unsolicited copies on driveways.
Sadly, though, I don’t think it’s the laughable, fraudulent, outright-dogmatic coverage of climate change that is doing them in here. Seattlites not only drank the Kool-Aid long ago, but were also the ones dumping in the powder.
Okay maybe we didn’t make the temperatures hotter But the droughts, the floods, the wildfires, the ocean acidification, the Earthquakes, the increase in sea ice extent, the locusts… The hurricanes, the polar vortex …. The glaciers, the ice sheets, The smell of deodorant free hippies marching in New York… Those are all caused by mankind, right?:/
Reblogged this on JunkScience.com and commented:
So, do you suppose that the State of California is going to back off all its climate change regs and activities? Probably not.
I can verify that increased wind levels lower the oceans surface temperature and lower wind speeds result in higher surface temperatures. I have made hundreds of measurements over the last several years in the Bahamas and Caribbean.
latent heat of vaporization naturally cools the waters!
And perhaps more importantly does not warm the air immediately above the surface.
Yes – It does not warm the air, but the energy is still there held up in the water vapor as it soaks up heat energy. It’s simply amazing how much energy it takes to convert water to vapor.
The Chinese will be pleased not to be blamed for outgunning the EU in emissions:
http://www.bloomberg.com/news/2014-09-21/china-beats-u-s-in-per-capital-pollution-for-first-time.html
Each person in China produced 7.2 tons of carbon dioxide on average compared with 6.8 tons in Europe, 16.4 tons in the U.S. and 1.9 tons in India in 2013, according to the study by the Tyndall Center and the University of Exeter’s College of Mathematics and Physical Sciences.
Suspect they mean tonnes, not tons.
Every day several trains pass thru Houston powered by stinky old diesel, carrying 100+ railcars with 100-110 tons EACH of grain bound to feed those less-CO2 producing folks. Yeas, we make a lot of CO2 in the USA. But we sure feed a lot of folks with it.
the conclusion is obvious. the average chinese is now better off than the average european.
Science axiom:
In Theories of Science it’s never ever possible to prove a thesis right. Only to falsify a thesis.
When a thesis has been proven wrong, that thesis has fallen.
A new thesis needs to be formulated in words or figures.
Remember:
Consensus is a political term with no connection whatsoever to Theories of Science.
Doesn’t matter Who put forward a thesis that’s once been proven wrong. If there is a black dot on a white paper the paper can’t be said being white any more – only to show some degree on scale white-grey to grey.
It’s sad to realise that so many scholars never understood what Theories of Science is nor what the implication of using subjective assumptions and/or fallacies instead of hard sound facts in their papers.
Reblogged this on Sierra Foothill Commentary and commented:
For years we have been told by California Air Resources Board that the states warming and drought are the result of CO2 emissions. The legislature passed AB-32, the Global Warming Solutions Act to control CO2 emissions. Now we learn that CO2 emissions are not the cause of warming in the state. The question is, will the CARB and the Legislature recent the economy killing policies based on the proposition that CO2 emissions caused the warming. Call your legislator. Send copy of the paper. Take action!
Russ,
Re: Call your legislator. Send copy of the paper. Take action!
Agree. I’m curious to see if Washington state Gov. Jay Inslee and Senators Murray and Cantwell can respond with anything more than a form letter response: “ Thank you for expressing your concerns for our precious environment…….. yadda bladda blabba, ad nauseam.
Even their evasions from examining the ‘unsettled science’ have value in this political season however. Ask every candidate, from dog catcher on up, where they stand on the unsettled science of global warming, CO2 emissions controls, ‘carbon’ taxes and trading schemes, and their adverse impacts on low cost energy production, jobs, our state and national economies, and the future well being for citizens of all nations, rich and poor.
Mac
Russ, you will enjoy the renewables sequelae essay in the next book. Essay is titled California Dreaming. Exposes how lobbyists for not yet practical renewable storage alternatives almost guarantee rolling blackouts by 2015. Those blackouts might finally get voter attention. Even in Governor MoonBeam’s state.
I am preparing for the rolling blackouts, we have a generator and lots of diesel.
Moonbeam and the Sacramento Democrats surely already have a plan to blame the power industry.
1. They will hurl accusations of spot market manipulation (a la references to Enron-esque tactics) to raise prices and “extort the good people of California for corporate greed.”
2. They will blame the drought somehow, maybe by claiming it is requiring more pumping to keep SoCal with Sierra Nevada drinking water, thus consuming more electricity. Cal does use a tremendous amount of electricity to pump water over the Tehachapi Mtns.
Cheaper version of an uber expensive research proposal:
Ask a fishing business about decades long oscillations. Type it up. Submit here.
AND…regarding the surprising research paper, I’ve been sayin it and sayin it. Guess who I got it from? Hitch your wagon to Bob Tisdale. THE man of the hour.
Pamela,
I have a deep appreciation for the work Bob Tisdale does. I have learned a great deal from his communiques here at WUWT.
That said (and meant), in this political season, a research paper from PNAS is a club of sizable weight and heft. Use it to best effect… and swing for the bleacher seats.
Mac
Pamela, could not agree more. Bob seems to have understood and explained more about ocean oscillations (especially in the Pacific) than all the government funded ‘scientists’ put together.
Maybe we should fire all of them, and just hire him?
Seems to me the Glibbering Climb Down has begun, sure the twit who proposed GCL wanted it to replace Climate Change, AKA Global Warming with Global Climate Disruption but these public manipulators have lost the cause.
As many commenters note, a soft landing paper, essentially the old will be made new, its surprising news to the Team IPCC ™ that their predecessors had it right and after adding nothing useful to the study of climate for 3 decades, they now have to acknowledge they know nothing and their past certainty only identified them as fools. Never happen of course, instead with louder cries for more funding, they will discover we live on a water world, which creates weather.
I have my suspicions that the majority of these Climate Experts cannot verbally explain the phase changes of water to a 12 year old.
There has to be a reason they airily dismissed the importance of clouds, their inability to “model” them as not important to the understanding of climate.Unfortunately I suspect that reason is they, to a mann, do not understand the physics and like egotists everwhere, “What I do not understand is not important.”
Study links changing winds to warming in Pacific
The study does establish some correlation; however, as pointed out by others in this article, the authors have not definitively established causation. Previous studies have also concluded that Pacific temperatures were affected by winds. However; due diligence was taken in determining the cause for such changes. One study released in August of 2014 established that rapid warming of the Atlantic basin had resulted in a sort of turbo charging effect on Pacific equatorial trade winds. “The increase in these winds has caused eastern tropical Pacific cooling, amplified the Californian drought, accelerated sea level rise three times faster than the global average in the Western Pacific and has slowed the rise of global average surface temperatures since 2001.” Another study released in February of 2014 essentially established that Pacific trade winds had stalled global surface warming. I think that this research adds to the overall bigger picture; however, sensational news headlines such as the one run in the ST titled “Study: Emissions not cause of West Coast warming” are at best misleading and will almost certainly sow the seeds of doubt in an already confused public that more often than not will go little beyond the headline. I suppose the Heartland Institute and James M Taylor will have some more data to misrepresent in their efforts to mask the impacts of the fossil fuel industry and role back progressive progress on renewable energy sources. I’m sure we’ll see a James Taylor authored article in Forbes within a day or two.
Read more at: http://phys.org/news/2014-08-atlantic-turbocharges-pacific.html#inlRlv
Read more at: http://phys.org/news/2014-02-pacific-stall-global-surface-warmingfor.html#inlRlv
“…Sort of turbo charging…” – are we talking cars or climate? It is speculation based on correlation. Seems you don’t like it when the “What came first the chicken or the egg” argument is not slanted to go your way.
“…an already confused public…”
Climate scientists are more confused than the public.
…the authors tracked land and sea surface temperatures there going back 113 years. They found that virtually all of the roughly 1 degree Celsius average temperature increase could be explained by changes in air circulation.”
The two papers to which James (at 10.22 pm) refers only go back 13 years. By cutting out the previous 100 years the authors of the papers to which James refers are able to associate the recent cooling with changes in air circulation and ignore the fact that the latest paper associates the century’s warming also to changes in air circulation.
Thus are facts twisted.