Note that the original October report on WUWT from a press release issued accidentally by UAH is superseded by this report. – Anthony
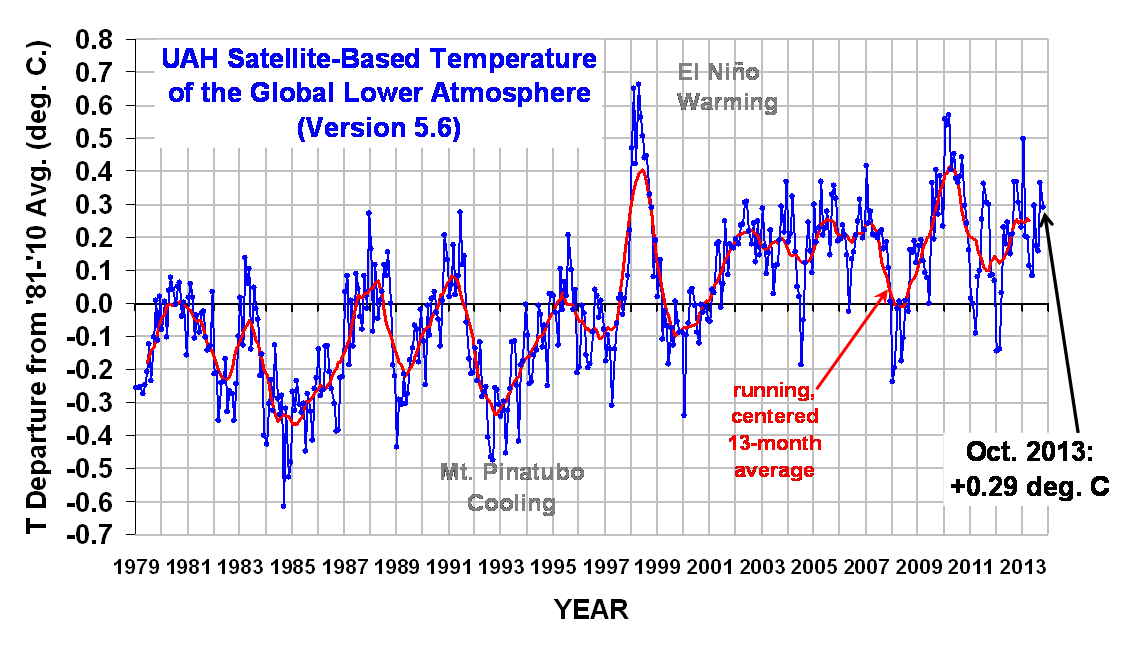
UAH v5.6 Global Temperature Update for October, 2013: +0.29 deg. C
By Dr. Roy Spencer
We finally received the missing NOAA-19 and Metop2 AMSU data from NESDIS, resulting from the government shutdown, covering the first half of October. For some reason we got all of the NOAA-15 and NOAA-18 data, but the other two satellite feeds were stopped.
So, the numbers below supersede the UAH October temperature press release, which was sent out by accident. (The global anomaly map for October was approximately correct, though, because it was based upon the 2 satellites which had complete data coverage for the month).
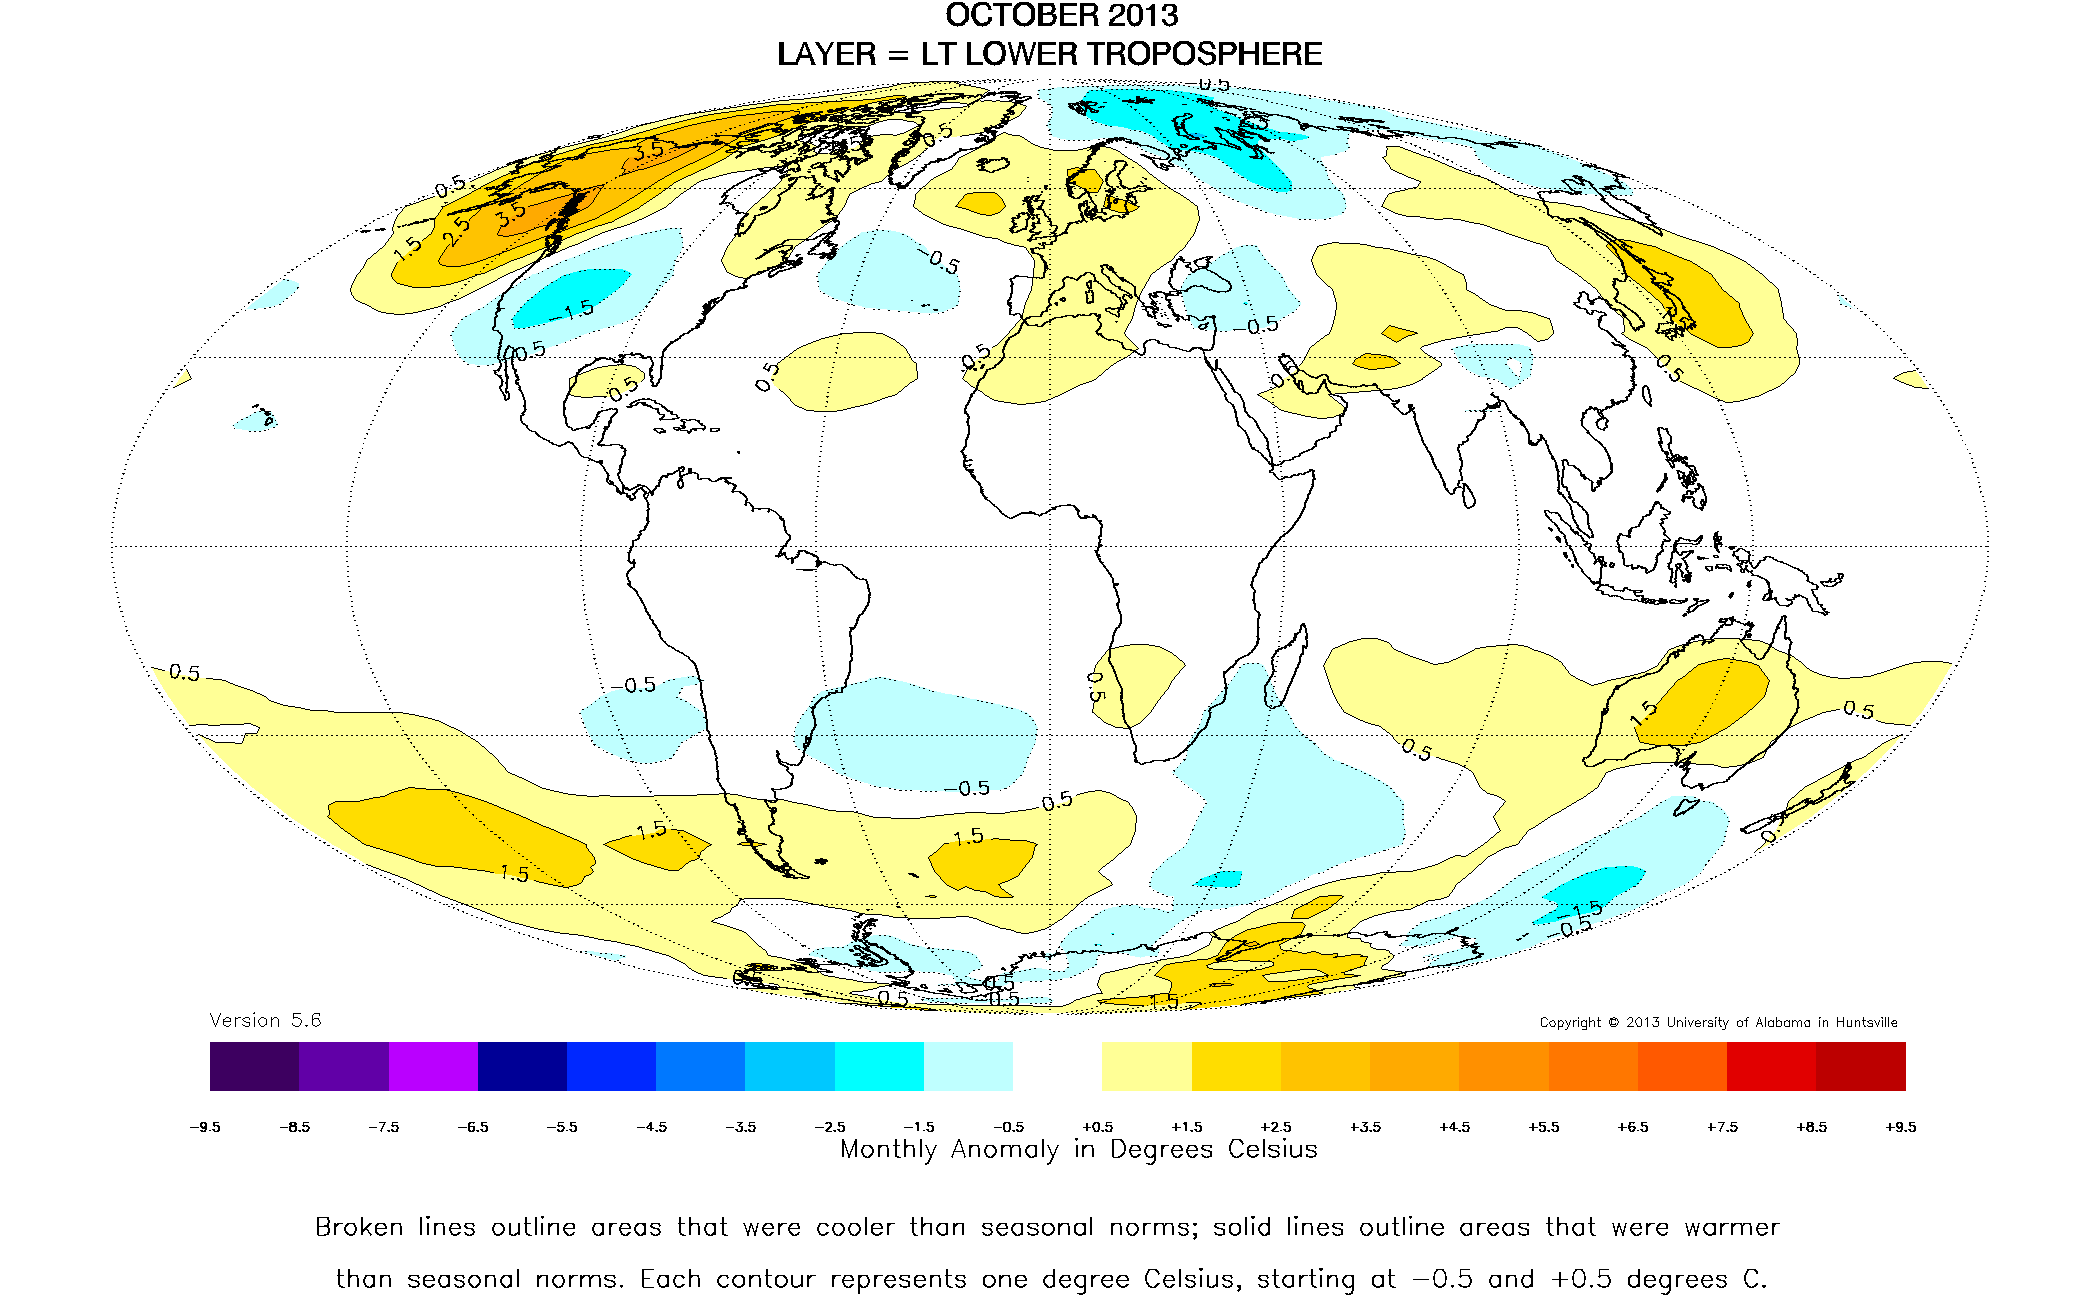
The Version 5.6 global average lower tropospheric temperature (LT) anomaly for October, 2013 is +0.29 deg. C (click for larger version):
The global, hemispheric, and tropical LT anomalies from the 30-year (1981-2010) average for the last 10 months are:
YR MON GLOBAL NH SH TROPICS
2013 01 +0.496 +0.512 +0.481 +0.387
2013 02 +0.203 +0.372 +0.033 +0.195
2013 03 +0.200 +0.333 +0.067 +0.243
2013 04 +0.114 +0.128 +0.101 +0.165
2013 05 +0.082 +0.180 -0.015 +0.112
2013 06 +0.295 +0.335 +0.255 +0.220
2013 07 +0.173 +0.134 +0.211 +0.074
2013 08 +0.158 +0.111 +0.206 +0.009
2013 09 +0.365 +0.339 +0.390 +0.189
2013 10 +0.290 +0.329 +0.250 +0.032
Popular monthly data files:
uahncdc_lt_5.6.txt (Lower Troposphere)
uahncdc_mt_5.6.txt (Mid-Troposphere)
uahncdc_ls_5.6.txt (Lower Stratosphere)
As usually is the case…. more data is recommended.
Does someone know why UAH gives their numbers to 3 significant figures in their blog posts, but only 2 on their data page?
And how does RSS publish 3 significant figures when UAH can only publish 2?
Wonder whether they stopped listening to Merkel’s telephone during the shutdown as well.
Move that zero (normal??) line up 2/10th of a degree….and you have no anomaly at all
whether I list 2 or 3 significant figures mainly depends upon my mood.
Roy Spencer says:
November 12, 2013 at 11:20 am
whether I list 2 or 3 significant figures mainly depends upon my mood.
Yeah, climate change has that effect on all of us.
🙂
Roy
Interestingly, that anomaly is slap bang on the anomaly for CET. CET of course was started in this Met office data base in 1772.
http://www.metoffice.gov.uk/hadobs/hadcet/
0.3C of an anomaly over 240 years is pretty scary
tonyb
The “popular monthly data files” only go to Sept …
Based on gut feeling but with some very indirect evidence, I would predict a significant fall in global temperature over the course of 2014-215. For instance
1. The temp record seems to proceed in 7-8 year jumps, we are near the end of one;
2. Monckton’s recent post referred to wprk by Salby on correlation between a time integral of solar output – which seems a very sensible metric – and global temps; this approach, like sound testable science, predicts a significant cooling in the next 5 years;
3. The Equatorial Pacific has been trying unsuccessfully to start a La Nina for most of the year. The annual phase-locking of ENSO meams that the right time for a La Nina-initiating Pacific cooling would be Jan-March;
4. An AMO downturn is due any time now.
Can we talk about the weather we are experiencing today, here in the USA? This is the earliest severe cold snap that I have experienced. Here in SW Virginia, we are dropping about 20 degrees in about 6 to 8 hours. I have seen this sort of thing in St. Louis, but rarely earlier than Thanksgiving. And the cold snap seems to cover most of the US. Amazing.
Tonyb,
That Met Office CET graph is particularly troublesome for warmistas. The dramatic fall-off in the last couple of decades while CO2 climbed like a homesick angel – priceless!
Brian
JJ, John Christy will update the “popular data files” soon…he is a busy guy.
Dr. Spencer, I enjoyed your appearance on CNN with Piers. Did you? (wink) For the record, you came off quite smartly against a poseur mouthing known drivel.
brians356 says:
November 12, 2013 at 12:44 pm
Yes, it is priceless! – but the real advantage of the fast drop is that it completely negates the fast rise – I don’t mean in the direct countering of the temperature rise sense. I mean in the perfect demonstration of how an uptick and a corresponding roughly ‘equal’ downtick shows that both are most probably due to natural causes. This large up and down movement (irrespective of the various ‘adjustments’, or where they decide to put the ‘zero anomaly line’) almost perfectly RULES OUT CO2 as the major cause of either the uptick OR the downtick. In a way, for us skeptics, it is indeed priceless, because they cannot hide it (all the adjustments have brought terrible scrutiny on the ‘data’ nowadays!), and if it was currently the same as per the early half of 20th century, merrily bumping along, up and down in small cycles, they could have continued the scam for quite some time.
As it is, the large up and down movement clearly destroys a direct majority link to CO2 and also fully demonstrates that there can be (as we know full well anyway, just from history!) significant climatic temperature changes WITHOUT human intervention at all. Even better, the slight upward trend, begun even before the modern CO2 measurements probably still reflects the LIA recovery?
They cannot even argue that the uptick is unprecedented, i.e. has been exacerbated by CO2, because even the ‘adjusted’ early data shows similar sizes of up/down changes (and of course, if CO2 GHG effect is logarithmic, the earlier up/down changes would likely have been larger?)
Roy
I kept a daily record to see if your first 10 day forecast for Europe that you posted several weeks ago was correct . How did you feel you did?
Tonyb
Kev-in-Uk,
Of course, a warmista will be tempted to say “But, but … that’s localized only to a tiny patch of the planet, and does imply anything about global temperature!” Well, if that’s true, then we can trot out the same retort when we hear “Aha! Warmest temperature ever recorded in Dismal Drain, Iowa! More proof of global warming.” After all, Occam’s Razor (as it were) cuts both ways.
“… doesn’t imply …”
Dr.Spencer
I send your monthly plot to about a dozen people many of which previously believed the MSM on global warming. Your diligent effort has enlightened many.
Thanks for your outstanding contribution to science and the country.
Roy, thanks for all you do. I also would like to congratulate you on your composure during the CNN interview. Your response that you too were in the 97% really took your opponent by surprise and made him look foolish as he tried to continue with that line of thinking.
Dr Spencer, No scientist should have to put up with the deplorable treatment you got on CNN. Thanks for taking on such a thankless task.
Theo, where in SW Virginia? I was born & raised in Radford. I knew some Goodwins, too, if that’s your real name.
Thanks for tipping us off about Dr. Spencer being on CNN. That reporter was just an ignorant bully.
That’s what one side does.
1. Repeat the same biased stuff and source……… the IPCC
2. Repeat the ridiculously unscientific and biased study that uses that extremely misleading 97% of climate scientists number.
3. Use every extreme weather event as evidence of climate change caused by humans. Whether its a huge cyclone, drought, flood or even blizzard.
4. Make accusations/attacks like this one:
“Do you deny that you stand in opposition to the overwhelming scientific consensus on this? If so, you need to read more scientific papers.”
What an absurd, rude and ignorant statement from this reporter, directed at Dr. Roy Spencer one of the worlds most knowledgeable authorities on this.
brians356 says:
November 12, 2013 at 12:44 pm
“Tonyb,
That Met Office CET graph is particularly troublesome for warmistas. The dramatic fall-off in the last couple of decades while CO2 climbed like a homesick angel – priceless!”
What is even more delicious is the fact that they have systematically added a few tenths on to the recent warming decade and pushed the pre- 1940s down a few tenths to get rid of the pesky stubborn 1930s records which were higher than the 1998 spike until they decided that 1998 was their best chance at a new global record. Now with the warming enhanced by adjustments, they only throw into higher relief the downward trend since the turn of the millennium. Its like what happens with an escalator as it approaches the next floor. Now that all eyes are on them and the data, and they are being constrained and disciplined by satellite records and perhaps some scruples at some level. The last adjustment that the data keepers made was the creation of Hadcrut 4 to try to bend us out of the pause in the last years after Phil Jones’s candid moment about the lack of warming about 4 years ago. Yeah, without the heavy-handed adjustments we would be experiencing a decrease in up-slope, perhaps instead of an inflexion downwards. S’truth, the stress on these guys must be terrific. They have even buckled on taboo topics like PDO, AMO Enso, sunspots and the dreaded natural variability in their squirmings. “Sauve qui peut” as they say (the wartime signal when all is lost – save what you can; every man for himself) when the end is near.
Just loved this from Roy
Roy Spencer says:
November 12, 2013 at 11:20 am
whether I list 2 or 3 significant figures mainly depends upon my mood.
I have to note down various figures every 4hrs and I will round up to one decimal place with many as it doesn’t make any difference as the readings float by anything up to a whole unit in 1min.
James Bull
Gliese 581d says:
November 12, 2013 at 10:12 am
> Does someone know why UAH gives their numbers to 3 significant
> figures in their blog posts, but only 2 on their data page?
>
> And how does RSS publish 3 significant figures when UAH can only publish 2?
The 3-digit data file is http://vortex.nsstc.uah.edu/public/msu/t2lt/tltglhmam_5.6
Dr. Spencer, please include it in your list of “popular files”.