From ICECAP
By Joseph D’Aleo CCM, AMS Fellow
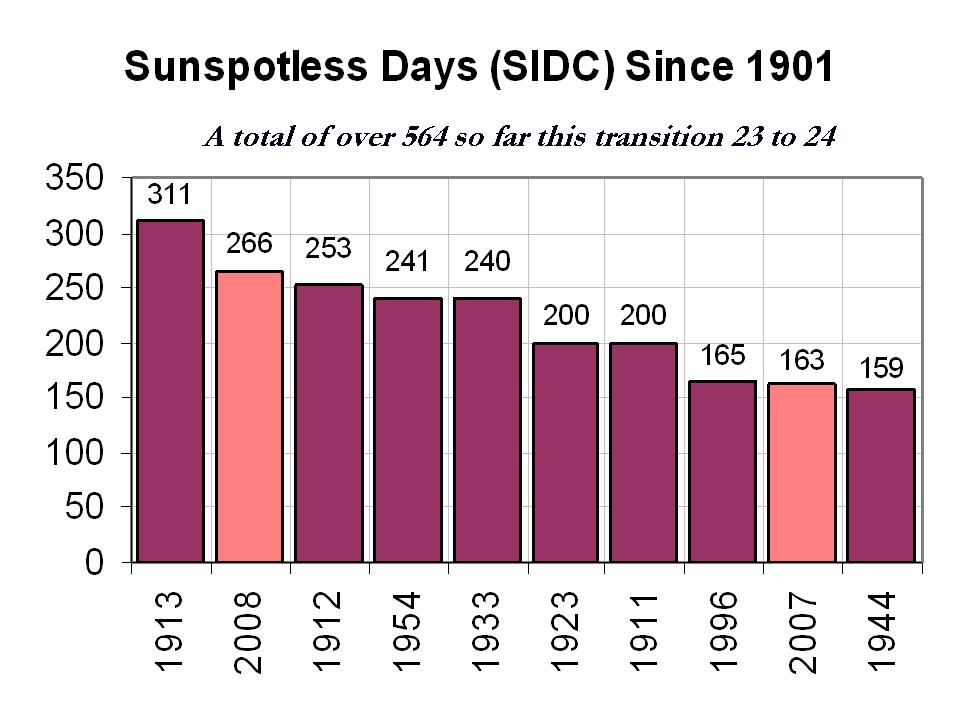
2008 will be coming to a close with yet another spotless days according to the latest solar image.

This will bring the total number of sunspotless days this month to 28 and for the year to 266, clearly enough to make 2008, the second least active solar year since 1900.

See larger image here.
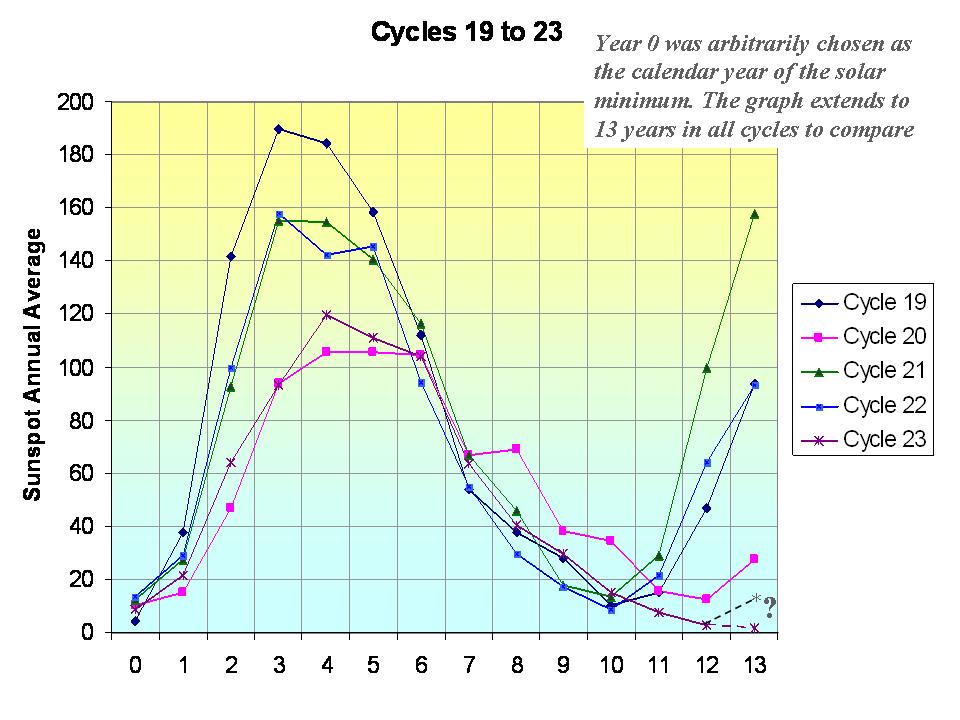
The total number of spotless days this spolar minimum is now at around 510 days since the last maximum. The earliest the minimum of the sunspot cycles can be is July 2008, which would make the cycle length 12 years 3 months, longest since cycle 9 in 1848. If the sun stays quiet for a few more months we will rival the early 1800s, the Dalton Minimum which fits with the 213 year cycle which begin with the solar minimum in the late 1790s.

See larger image here.
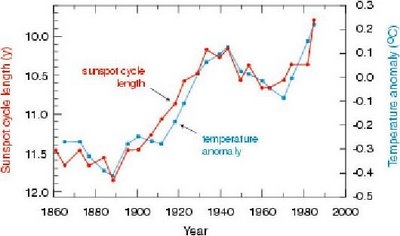
Long cycles are cold and short ones like the ones in the 1980s and 1990s are warm as this analysis by Friis-Christensen in 1991 showed clearly.

See larger image here.
In reply to the arguments made that the temperatures after 1990 no longer agreed with solar length, I point out that it was around 1990 when a major global station dropout (many rural) began which led to an exaggeration of the warming in the global temperature data bases. Also the length from max to max of 21 to 22 was 9.7 years and cycle 22 length min to min 9.8 years, both very short suggesting warm temperatures in the 1990s. The interval of cycle 22 max to cycle 23 max centered in the mid 1990s began to increase at 10.7 years and the min to min length of cycle 23 is now at least 12.3 years.
With the Wigley suggested lag of sun to temperatures of 5 years and Landscheidt suggested 8 years, a leveling of should have been favored around 2000-2003 and cooling should be showing up now. Looking ahead, put that together with the flip of the PDO in the Pacific to cold and you have alarming signals that this cooling of the last 7 years will continue and accelerate.
Please ignore this article and continue investing money in Al Gore’s green fund and paying him huge speaking fees. We need the money to pay for our huge electric bills.
Thanks – Tipper
That can’t be right, because the British Met Office says we’re in for warming, and they’re always right. Yes, that is sarcasm – and thoroughly deserved sarcasm at that. Hope you’re reading, Met Office! I know a lot of people won’t agree with me, but I actually really hope that we’re in for cooling. Because I just want to see so many people being shown up as complete idiots. There was a time when I hoped my warming scepticism was wrong, as no one could wish for a colder climate. But I’ve had enough of the Warmists, and I’ve had enough of the leftist green movement too. Here’s hoping for a freeze! [my apologies to all those who still hope they’re wrong – and a happy new year].
Steve
I’m pretty sure that 2008 is the most spotless year since 1900 by far. Did we have the instruments we have now to monitor the sun back in 1913? Was there the same interest in counting the spots in 1913 that exists now? No on both. Back then only a few astronomers and some amateurs would do that. Now everybody seems to be doing it. Why, some people would count bad pixels as spots if the could get away with it.
and what does the Sun have to do with heating the Earth?
Drudge links this story to a Investors Business Daily editorial: The Warm Turns
“this cooling of the last 7 years will continue and accelerate.”
No need to worry, John Philip notes in the Pielke thread that 7 years is just weather so warming will continue as unabated as it has.
Can someone point me to a good paper (good = readable by a layman + plausibly true) on the dynamics of solar cycles, and what might contribute to it’s cyclical behavior? It will make interesting reading while I freeze my tucas off here in Saskatchewan.
Maybe we’ll get low solar activity also next year, and SC24 ramps up at late 2009 or 2010. This diagram was published in the solarcycle24.com forum:
http://farm4.static.flickr.com/3213/3146817105_af25c0ca5f_o.jpg
(The important difference between this cycle and the one ending 1913 is that SC23 is the longest since late 18th century, before the Dalton Minimum, or?)
—
BTW, and offtopic: An snapshot of the current status on the AGW side, which is best analyzed with a couple of glasses of champagne.
Thanks Magnus. A great laugh to round off 2008. No-one did it better than Monty Python, Peter Cook, Rowan Atkinson et al. Where are the comedians today to take the p**s out of AGW like they did? Any volunteers?
It’s actually pretty scary. I really don’t want to see a little ice age in my lifetime and it’s starting to look more possible. We’re all going to be hoping the AGW guys are right.
On another topic I just did a post on the practicality of algae biodiesel, if you’re interesed.
http://noconsensus.wordpress.com/2008/12/31/what-about-algae-biofuel-hype/
I suggest you replace the erroneous graph by Friis-Christensen (1991) by the corrected one, the original contains some ‘convenient’ arithmetic errors!
The corrected graph doesn’t have the the impressive agreement since 1980, quite the contrary.
http://stephenschneider.stanford.edu/Publications/PDF_Papers/DamonLaut2004.pdf
From the Sun to the Earth. This is OT a bit, and not related to sunspots (as far as I have ever heard), but I thought that this was interesting. What it portends I cannot say. I’d like to say it’s unsettling too, but it may not even be that big of a deal. Looks like we may have a movement of magma in some shape given the cluster of quakes, but it might also be steam driven. I haven’t done much looking into it since I am on my way to work soon, but I thought I would post it for others to investigate. The strongest of the temblors looks like a 4 on the scales. Anyway, take a look for yourselves.
The Druge Report headline says: Earthquake swarm continues beneath Yellowstone…
Here is the Link: http://www.seis.utah.edu/req2webdir/recenteqs/Maps/Yellowstone.html
Steve Berry wrote:
“There was a time when I hoped my warming scepticism was wrong, as no one could wish for a colder climate. But I’ve had enough of the Warmists, and I’ve had enough of the leftist green movement too. Here’s hoping for a freeze!”
I agree with you Steve. I don’t want AGW to be proved “true”, whether it is or not, as I don’t want to have our economy ruined (more than it is now) by activists who know not, what they will have wrought. But, on the other hand, I don’t want to live through a drastic, or “Little Ice Age” type global cooling scenario.
Either way, human beings will be harmed.
Nothing like a good old Dalton or Maunder Minimum to gag forever the likes of Hansen, Gore, Mann and company. The hubris of these so called scientists (Gore, excepted) is breath taking. They should all be crawling under rocks and never be heard from again.
Looking at the 10 most sunspotless days that were noted in the post above and using CRUTEM 3 annual global surface temperatures I note that 6 of the 10 years mentioned were colder than the previous year, 4 were warmer.
O f the 4 that were warmer, strong El Ninos from 1911 to 1912 and moderate El Nino of 1913 -1914 seem to over-ride the apparent cooling of the higher sunspotless days of the years 1913 and 1912. The year 1944 was neutral but still warmer than 1943. Perhaps the lower number of spotless days[159 and the lowest of the 10 years noted] may be insufficient to cause cooling. The year 2007 was a mix of La Ninas and neutral and the warming was very slight from 0.654 to 0 .679 C [ year 2006 to 2007]
It would appear that the oscillations of both the sun and earth together need to be considered unless there are sustained number of consecutives years with low sunspot years like the Dalton, Maunder and Sporer minimum periods
The year 2008 [ mostly ENSO neutral] is good case to illustrate that for significantly more spotless days, the lower the global surface temperature is lower[ like 1933]
Phil,
While the original may contain errors, I really don’t have the experience with this yet, the link you reference uses temp curves from Mann98 as well as references to papers by Mann 99.
It is hard for me to trust anything by that guy or his group. A scientist who would reference it as recently as 2004 is in question to me as well. Are there cleaner articles available?
Phil:
I wonder if there are any graphs comparing suns cycle length and “global temperature” (whatever that is) that go past the year 2000? I always find it suspicious when I am being presented with a graph that proves a point one way or another when it conspicuously omits current or recent data.
The PDF you linked to goes on a length about the arithmetic errors in the previously presented graph, but doesn’t say what the error was other than the data used was improperly “filtered”. I’m confused on this point – the length of a cycle seems like a pretty straightforward thing to measure – and the corrections have the cycle lengths reduced dramatically in favour of their “no correlation” stance (disregarding the striking correlation in the other 80% of the graph). But these cycle lengths have been reduced why, and by what means?
The article then goes on to discuss political and sociological implications of the “incorrect” graph rather than merely discuss the matter in a purely scientific / mathematical manner. Sorry, but for me, this paper (already 4 years old) doesn’t pass the sniff test. Also, what was the response from Friis-Christensen to this questioning of their methodology and conclusions? Have there been any more recent papers or graphs from either side to prove or disprove correlation?
This is an incomplete picture, for me.
Phil. the paper you link too looks pretty dramatic except for the fact the data ends in early 2001 or 2002.
I think Friis-Christensen are redeemed by the recent cooling.
Thanks Magnus:
“Not quite the conflagration we’d been banking on”. Ha ha ha.
It’s not just the PDO. The AMO looks to have achieved maximum and is now starting to decline. The AMO decline/negative PDO look to be about in the same alignment as they were around 1950. The difference between that period and now is that 1950 was the last hurrah of lower solar activity and while AMO/PDO plunged in the following periods, solar activity increased. Right now, as AMO/PDO plunge, we look to be in the early stages of lwoer solar activity.
I addressed these observations in a post on my site:
http://digitaldiatribes.wordpress.com/2008/12/23/a-look-at-the-atlantic-multidecadal-oscillation-amo-index/
Personally, I want global warming back, I’m getting too old for prolonged cold, much as I’d like to see Hansen et al with egg on their faces.
DaveE.
Mr. Hastings-Trew — The website http://www.co2science.org has a subject index that includes papers on solar-terrestrial effects. Some of the papers have a short abstract (‘what it means’) by the Idso team of climate scientists here in Arizona.
The Idso site deserves more mention here; it is very good on biological topics such as growth stimulation by CO2, which they study. Planktonic dimethylsulfide production may be a strong negative feedback, for example, and means that biologic factors can be a major factor in world temperature.
Right now, the CO2 science site home page has a submission to the EPA which gives the skeptical case on that matter.
Re:Steven Hill (09:55:46) :
This should be interesting, Gore and Hansen will look like morons.
Eventually perhaps, but not in the near-term. We have to keep in mind that the AGW hysteria has never been about climate or science in the first place, but about foisting a new social agenda upon America. The Hansens and the Gores see themselves as so close to the brass ring now that they won’t allow a silly thing like reality to stand in their way. Any cooling in the short-term will simply be brushed off as noise in the overall warming signal. Take a look at the GISS global temperature trend graphs. It will take many years of deep cooling before a trend line, no matter how it is averaged or smoothed, can no longer maintain a positive aspect. Unfortunately, I think we will be suffering the AGW fools for many years to come.
Solar irradiance also correlates well with sunspots: click
Notice that global warming and increased solar irradiance both ramped up beginning in the early 1900’s, when even rich countries were still mostly agrarian and therefore produced very little carbon dioxide compared with current levels. Today, CO2 continues to rise — but now the planet is beginning to cool.
It is clear that CO2 is [if at all] a very minor player in climate dynamics. But if the warm mongers continue to insist that “carbon” [meaning CO2] is the primary culprit, then the obvious way to counter global cooling is by encouraging the use of fossil fuels.
The fact that this straightforward solution to planetary cooling is never mentioned is more evidence that the AGW hypothesis is based on a political agenda, not on objective science.
Phil. (11:08:02) : [provided a link to Stephen Schneider’s home page at Stanford]The corrected graph doesn’t have the the impressive agreement since 1980, quite the contrary.
I wonder, is this the same Stephen Schneider who said in Discover magazine, OCT 1989:
???
If he is, I wonder, why should he be trusted? Interestingly, the PDF paper at the link has a section entitled “Public Impact of Misleading Information”.