A Guest Post By Steve Goddard
In my most recent article in The Register, and also posted here on WUWT, I incorrectly speculated that NSIDC graphs appeared to show less growth in Arctic ice extent than had actually occurred. My calculations were based on counting ice pixels from Cryosphere Today maps. Since then, I have had further discussions with Dr. Walt Meier at NSIDC and William Chapman at Cryosphere Today, to try to understand the source of the problem. Dr. Meier has confirmed that counting pixels provides a “good rough estimate” and that NSIDC teaches pixel counting to CU students as a way to estimate ice extent. William Chapman has confirmed that the projection used in CT maps is very close to what it appears and to what I had assumed it to be. It is an astronaut’s view from about 5,000 miles above the north pole.
What I have learned
In 2008, CT and NSIDC maps show excellent agreement – as can be seen in this video which overlays an August 14 NSIDC map on top of the August 14 CT map. The borders of ice extent are nearly identical in the two maps. (The videos show overlays of the two maps.)
The discrepancy occurred in August, 2007, when agreement between NSIDC and CT was not so good. The equivalent video from August 15, 2007 shows that the CT map was missing a significant amount of low concentration ice on the Canada/Alaska side. I have since confirmed from AMSR maps and NASA satellite photos that the NSIDC map is probably more accurate than the CT map.
The reason that CT provides their side-by-side image viewer is apparently to encourage visitors to make a visual comparison of two dates, which is exactly what myself and others here did when we observed the discrepancy vs. NSIDC graphs. The human brain is quite good at making estimates of relative areas from images, and pixel counting is nothing more than a way to quantify what has already been observed. Since writing The Register piece I have made adjustments to the CT pixel counts for map distortion, and as I expected that makes the discrepancy slightly larger.
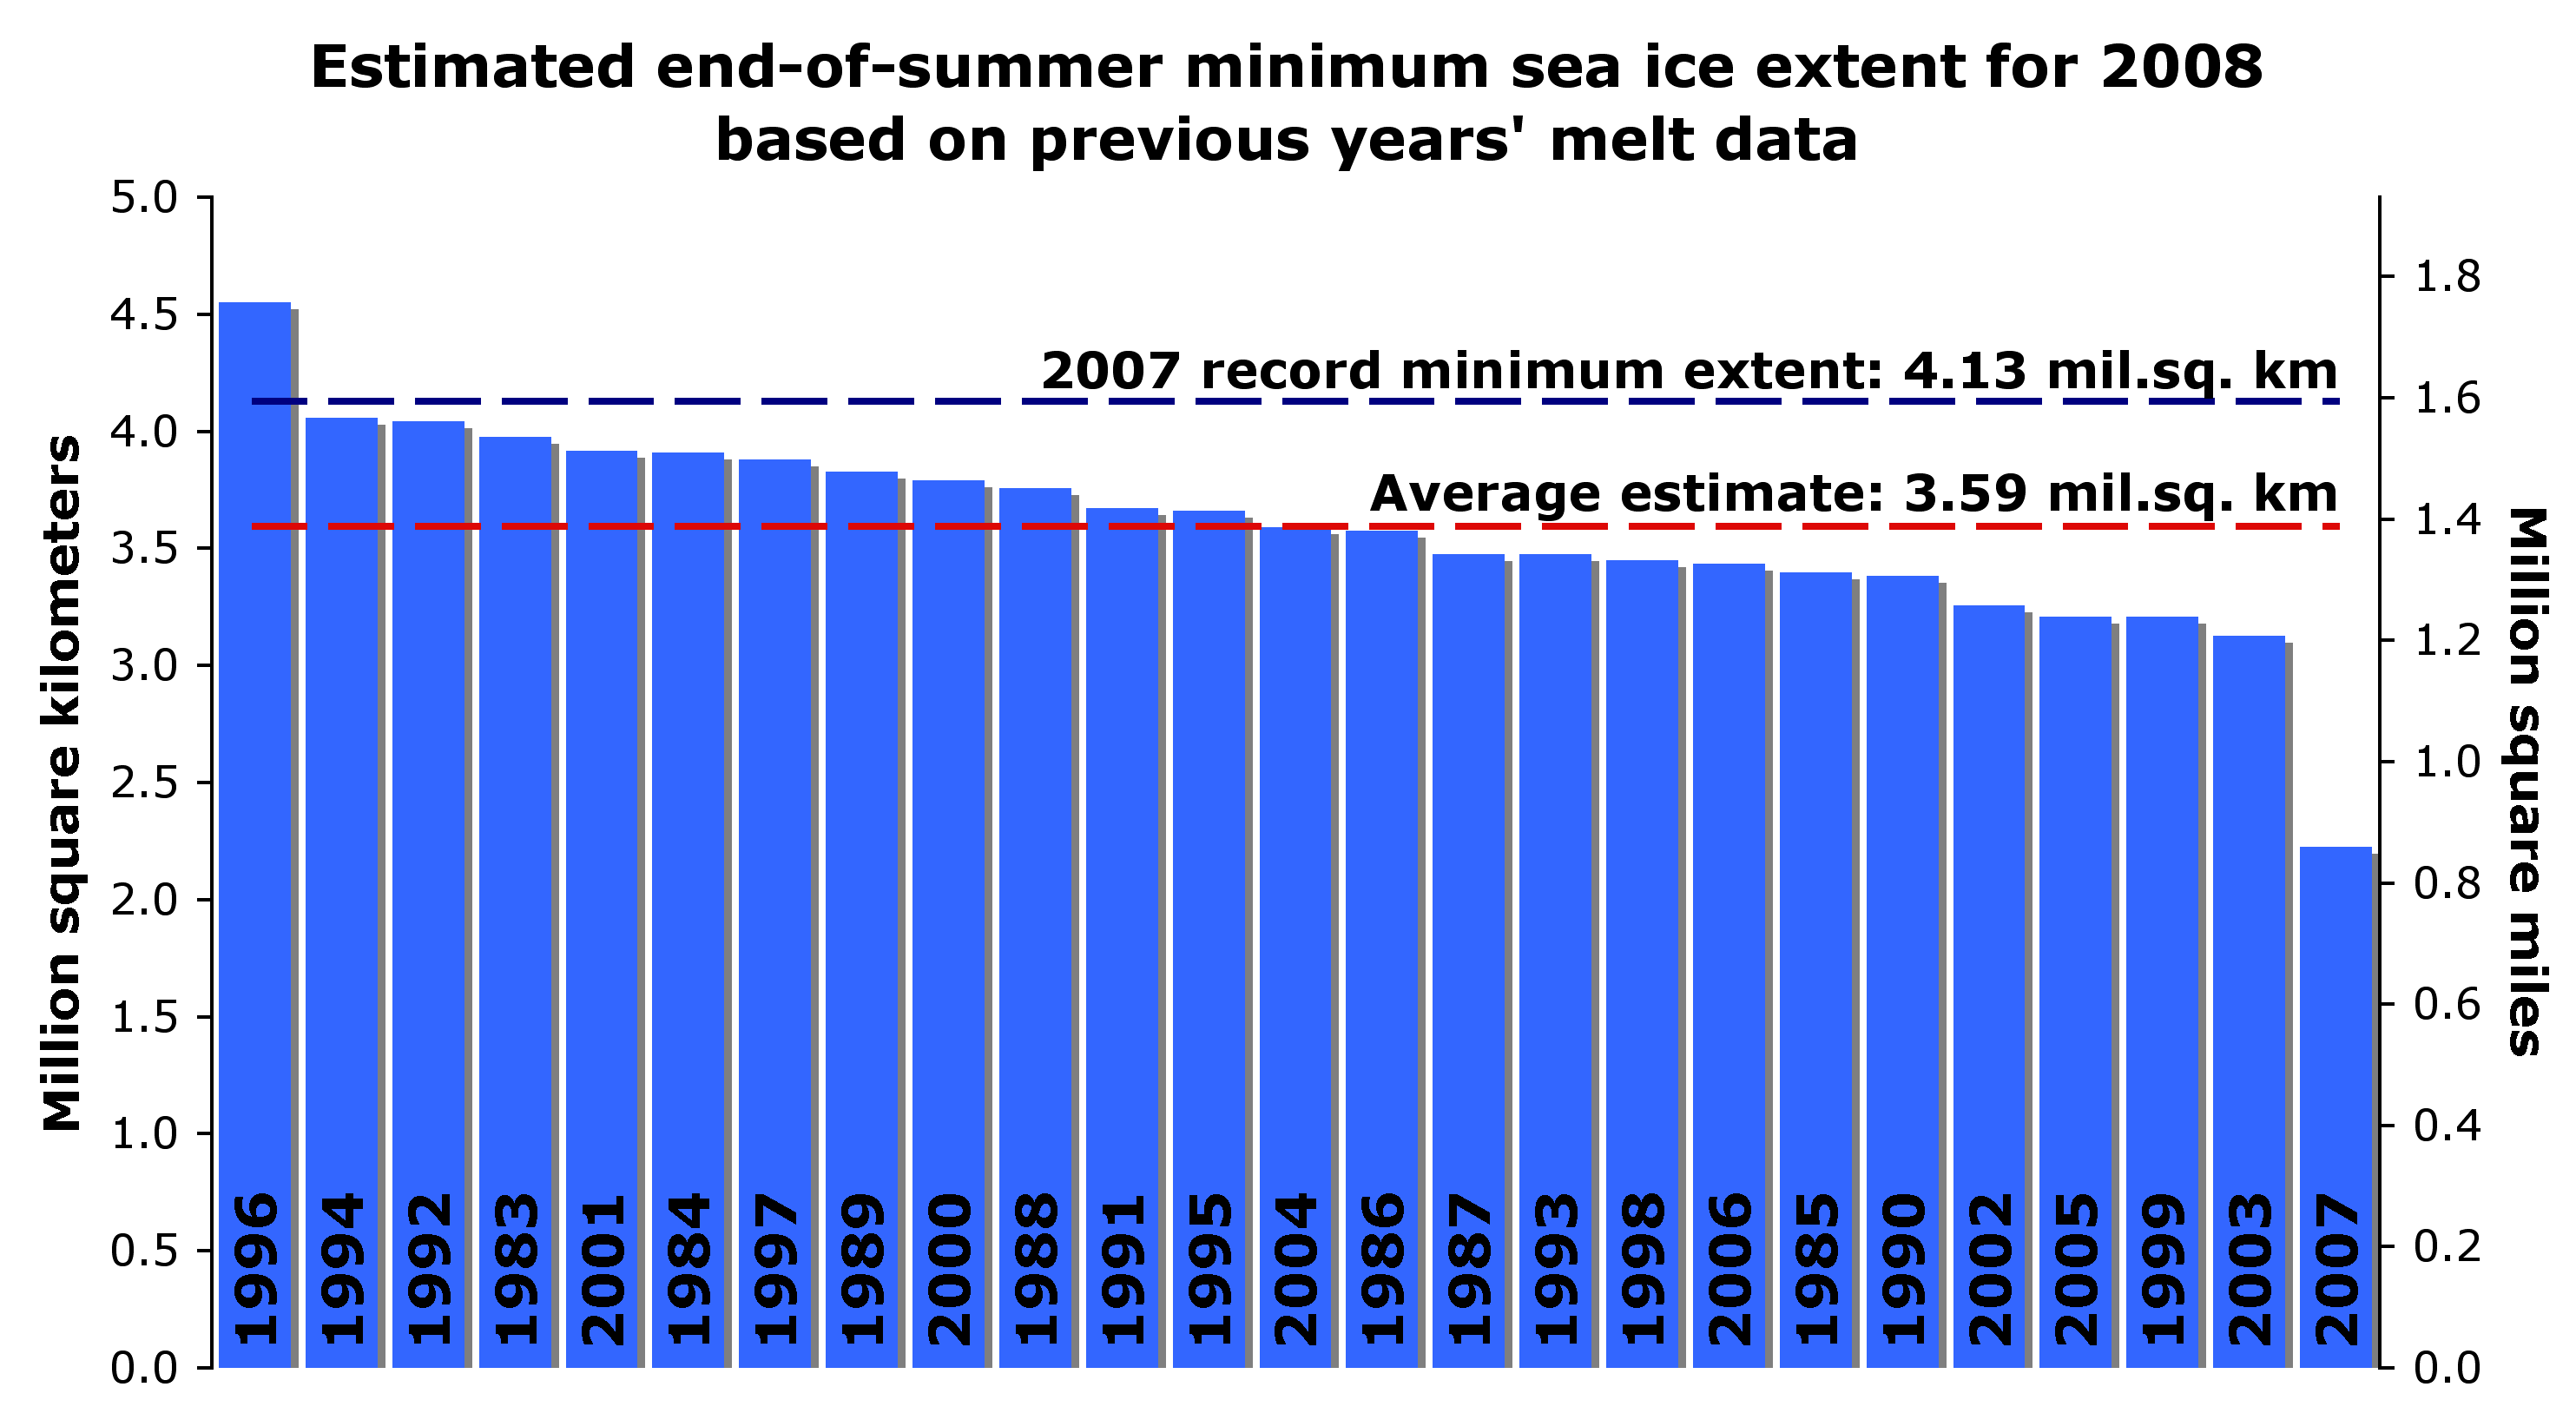
Because CT maps showed less ice in 2007, the increase in 2008 ice extent appears to be much greater. There is little doubt now that the NSIDC reported ice growth is absolutely correct. But wasn’t the ice supposed to shrink this year due to an excess of “thin first-year ice?” In May, NSIDC’s mean forecast (based on previous year’s melt) was that Arctic ice extent would be 13% lower than last year. (NSIDC has more recently posted on their web site some reasons why they believe the May estimates didn’t work out.)

Click for a larger image

Click for a larger image
Secondly, while Arctic ice is well below the 30 year mean, it is above expectations and nowhere near gone. NSIDC graphs show Arctic ice extent at greater than 70% of normal – hardly a six sigma event. As of August 1, NSIDC was even considering a possible return to normal extent this summer. If not for a few weeks of stormy Siberian weather, the map (and story) would be quite different today.


Click for a larger image
Is it possible that the 30 year satellite record coincidentally represents only one leg of a waveform? Greenland temperature records would hint at that. If you examine only one leg of a waveform, you will absolutely come to the wrong conclusion about the long term behaviour – just as some did during the 1970s ice age panic.

Click for a larger image – original source image from NASA GISS
Is there cause for concern? Perhaps. But unfortunately much of the press coverage has been little more than science fiction so far. How do we separate the science from the fiction? Dr. Meier has graciously agreed to answer that question (and others) in my next article.
One thing we can state with a degree of certainty, is that there likely will be more multi-year ice in 2009 than there was in 2008. This is because the 2008 melt season is ending with more ice area than 2007. Barring asteroid impact, after the winter freeze there will be (by definition) more multi-year ice than what we started with this year. Any ice which survives the summer will be classified as multi-year ice in 2009. If next year is cool like this year, is it unreasonable to hypothesise that ice extent will again increase? Or are we on a non-linear trend which will lead to ice-free summers and a collapsing Greenland ice sheet? Hopefully Dr. Meier can help sort this out for us.
I may have missed it in the previous thread but did we ever get an explanation as to why the earlier CT images were dramatically different to the NSIDC images but the later ones match fairly well
For the first time in human history, the North Pole can be circumnavigated.
http://www.independent.co.uk/environment/climate-change/for-the-first-time-in-human-history-the-north-pole-can-be-circumnavigated-913924.html
True or not?
REPLY: You might want to qualify that, human history goes back hundreds to thousands B.C. And I don’t think such navigation attempts were made or recorded then.
Anthony – while you are reporting a growth of Arctic ice in 2008, other sources continue a ceaseless drone of doom. Note the article here: http://blog.wired.com/wiredscience/2008/08/arctic-ice-on-t.html. Could someone qualified to rebut this well offer one? For my part I notice a strong dependency on “models” for the scare material provided here as opposed to more thorough discussion of empirical data, and a sleight-of-hand in changing the subject to methane.
REPLY: I suppose we are the “glass half full” optimists here.
Steve, checking the historical records of the NSIDC is difficult because in January and May 2007, they restated all the historical data (which included revising the Maps on CT). No explanation of the changes was ever provided.
This Before and After animation of Northern Hemisphere Sea Ice Anomaly from CT captured through the Wayback Machine illustrates the point very clearly (shocking that is.)
http://img401.imageshack.us/img401/2918/anomalykm3.gif
Couple of points.
I don’t understand the End of Summer minimum ice extent graph as the bar chart doesn’t seem to relate to either of the axis nor the predicyion.
Second – is the fact that the latest NIDC graph http://nsidc.org/data/seaice_index/images/daily_images/N_timeseries.png seems to show a flattening of the melt rate of any significance
Jimmy here is a sampling of a few of the most recent studies and posts that should easily refute such stories. – Anthony
1) July 25, 2008 – M.I.T. Scientists: Warming Will Actually Reduce Number of Hurricanes
American Meteorological Society report contradicts claim tropical activity increases due to climate change. http://www.businessandmedia.org/articles/2008/20080725183719.aspx
2) Recent U.S. Senate report featured latest science on Hurricane and climate link. See full report here:
http://epw.senate.gov/public/index.cfm?FuseAction=Minority.Blogs&ContentRecord_id=37AE6E96-802A-23AD-4C8A-EDF6D8150789
3) Prominent hurricane expert Kerry Emanuel reconsiders global warming’s impact http://www.chron.com/disp/story.mpl/tech/news/5693436.html
Scientist refutes his own theory, finds warming does not increase hurricanes – Excerpt: Emanuel was not disappointed that the research seemed to undercut his old results. “One gets used to being mistaken, and we follow the evidence and sometimes the evidence is contradictory and then we have to sort it out.”
http://www.canada.com/montrealgazette/news/story.html?id=909e4b84-eb40-4088-950e-e7ed8200e880
4) ) Another hurricane expert reconsiders view: Study says global warming not worsening hurricanes Meteorologist Tom Knutson: http://wattsupwiththat.wordpress.com/2008/05/19/hurricanes-to-global-warming-link-blown-away
Excerpt: What makes this study different is Knutson, a meteorologist with the National Oceanic and Atmospheric Administration’s fluid dynamics lab in Princeton, N.J. He has warned about the harmful effects of climate change and has even complained in the past about being censored by the Bush administration on past studies on the dangers of global warming. He said his new study, based on a computer model, argues “against the notion that we’ve already seen a really dramatic increase in Atlantic hurricane activity resulting from greenhouse warming.”
5) Other scientists like Hurricane expert Dr. Bill Gray and Dr. Chris Landsea have steadfastly refuted the alleged warming hurricane link. See:
http://www.bestandworst.com/v/112507.htm
and also
http://www.chron.com/disp/story.mpl/metropolitan/5789245.html
Excerpt: By suggesting a marked decrease in activity, the new work bolsters the views of Chris Landsea, science and operations officer at the National Hurricane Center, who has argued that the apparent recent increase in Atlantic storm counts is due solely to better observational tools — satellites and the like — which blanket coverage of the Atlantic hurricane basin. “After taking into account the changes in monitoring, the number of storms we’re seeing now is on par with previous busy periods in the Atlantic,” Landsea said.
6) A recent issue of Journal of Climate showing there is little or no evidence of an increase in hurricane numbers or intensity. Paper Excerpt: Little evidence was found that mean individual storm intensity has changed through time, but it is noted that the variability of intensity has certainly increased. Any increase in cumulative yearly storm intensity and potential destructiveness is therefore due to the increasing number of storms and not due to any increase in the intensity of individual storms.
Full study here:
http://ams.allenpress.com/perlserv/?request=get-abstract&doi=10.1175%2F2007JCLI1871.1
The paper was authored by Climate statistician Dr. William M. Briggs, who specializes in the statistics of forecast evaluation, serves on the American Meteorological Society’s Probability and Statistics Committee and is an Associate Editor of Monthly Weather Review.
In addition, extreme weather and global warming have been refuted as well.
1) Climatologist dismisses extreme weather predictions due to man-made warming as ‘complete nonsense’ – By Hydro-climatologist Stewart Franks, an Associate Professor of Environmental Engineering at the University of Newcastle in Australia.
http://www.theaustralian.news.com.au/story/0,25197,23979327-5017586,00.html
2) Another scientist dismisses fearmongers: Midwest Floods and ‘Completely Unjustified’ Climate Change Fear Mongering – June 22, 2008 – By Mike Smith is a certified consulting meteorologist and a Fellow of the American Meteorological Society He is CEO of WeatherData Services, Inc., based in Wichita.)
http://wattsupwiththat.wordpress.com/2008/06/22/midwest-floods-and-unjustified-climate-change-fears )
3) U.S. Climate Change Science Program (CCSP) report shows Hurricanes declining, NO increases in drought, tornados, thunderstorms, heat-waves – June 20, 2008 –
http://canadafreepress.com/index.php/article/3588
4) Going Down: Death Rates Due to Extreme Weather Events
http://wattsupwiththat.wordpress.com/2008/07/05/going-down-death-rates-due-to-extreme-weather-events
http://edition.cnn.com/video/#/video/tech/2008/08/29/smith.arctic.kayaking.itn
Jimmy,
I don’t think there is any question that Arctic ice has increased vs. last year. All the data sources agree.
http://www.ijis.iarc.uaf.edu/seaice/extent/AMSRE_Sea_Ice_Extent.png
NSIDC is actually showing a flat extend trend, as of a few days ago. We could potentially be seeing 15-25% growth (relative to last year) by mid-September.
http://nsidc.org/data/seaice_index/images/daily_images/N_timeseries.png
The UK Independent is the same paper which speculated earlier this summer on an ice free North Pole “for the first time in human history.” They seem to like that term.
Today’s NSIDC map shows no route across either the Northwest or Northeast Passage.
http://nsidc.org/data/seaice_index/images/daily_images/N_daily_extent_hires.png
Not sure how one would circumnavigate the Arctic, when both sides are frozen up.
Anthony,
Just a thought, but have you considering making some sort of “AGW FAQ” with sections like the comment you posted here? Sometimes it’s hard to find the original sources after awhile or while you’re in a discussion with someone that’s never looked at the “other side” of the AGW story. There are a wide variety of claims about the effects of “man-made climate change” and it can be difficult to keep up with the “flavor of the day” and all the relevant material.
REPLY: Sure I’ll add it to my already bone-crushing workload 😉
Pierre Gosselin (10:23:59) :
http://edition.cnn.com/video/#/video/tech/2008/08/29/smith.arctic.kayaking.itn
Observe you can see land in the background. That means it was recorded at Svalbard (78N)
“But it is the simultaneous opening – for the first time in at least 125,000 years – of the North-west passage around Canada and the North-east passage around Russia that promises to deliver much the greatest shock. Until recently both had been blocked by ice since the beginning of the last Ice Age.”
How can The Independent make such a statement? How do they know that those passages were not open during the MWP and the Holocene Optimum?
Easy. They just “pucker their lips and blow”.
Just a thought, but have you considering making some sort of “AGW FAQ” with sections like the comment you posted here?
There is a RESOURCES section that has a lot of sources on a variety of climate topics. Look at the very top of the page.
[…] is a graph of all time arctic temperatures taken from Watts Up With that HERE. It shows the entire HISTORY of arctic ice measurement. So the longest in HISTORY isn’t too […]
Here are a few sat pictures of Svalbard and Spitsbergen Island from today.
Mr. Pugh will not get very far before running into the pack ice. The pack ice is right up against Spitsbergen on the northeast side of the island and only 50 miles away on the northwest side.
(Is he going to sleep in the kayak? Probably just another propand-photo-op.)
http://rapidfire.sci.gsfc.nasa.gov/realtime/single.php?2008244/crefl1_367.A2008244144501-2008244145001.4km.jpg
The 250M resolution visible sat picture, however, shows the ice is pretty broken up and one could just keep going in a kayak.
http://rapidfire.sci.gsfc.nasa.gov/realtime/single.php?2008244/crefl1_143.A2008244144501-2008244145001.250m.jpg
Steven Goddard writes: – Not sure how one would circumnavigate the Arctic, when both sides are frozen up
Well…
http://www.iup.physik.uni-bremen.de:8084/amsr/NorthWestPassage_visual.png
http://www.iup.physik.uni-bremen.de:8084/amsr/NorthWestPassage_visual.png
http://www.iup.physik.uni-bremen.de:8084/amsr/NorthWestPassage_visual.png
Do you call that frozen up?
The map at NSIDC(and you should know this) shows anything with more than 15% ice as white. Slush will appear as white there, but you wouldn’t have any problem navigating through it…
MV Polarstern has just gone through NW passage. You can read report here:
http://www.awi.de/en/infrastructure/ships/polarstern/weekly_reports/all_expeditions/ark_xxiii/ark_xxiii3/24_august_2008/
And they’re headed for the NE passage later
And these are the guys that so cheerfully was cited with this: “…this year, there was an exceptional amount of ice -”…remember?
Anthony, thanks for shedding light over this discrepancy of iceextend.
If im not wrong, the MAIN course of this confusion is that Cryosphere maps actually showed too little ice extend? This must have been quite a discrepancy last year?
So last year when we had the big attention to the low arctic ice extend, all pictures on Cryosphere for 2007 showed much too little ice extend?
So last year everybody looked at misleading pictures?
And now this year when its not in favour with low extend 2007, we correct it?
But still Anthony, if you say everything is at it should be, you are properly right. It just not the first time a data set seems to over estimate the effect of global warming, as you may agree.
K.R. Frank Lansner
It appears that the sea ice will finish with a greater extent than last year. Also the multi-year ice will be greater. I don’t think I am the first one to point this out but it appears that the trend is up.
Mike Bryant
Let me get this clear: Greater extent in 2008 than in 2007 which was a record low means “trend is up” according to you?
Have you watched this?:
http://arctic.atmos.uiuc.edu/cryosphere/IMAGES/sea.ice.anomaly.timeseries.jpg
Is that an up-trend?
Or this?:
http://nsidc.org/data/seaice_index/n_plot.html
Is thar an up-trend as well?
Didjeridust ,
Many adventurers have successfully navigated through the Northwest Passage ice over the last 105 years. The crew of the Australian yacht Berrimilla described their harrowing trip through a couple of weeks ago, occasionally getting stuck in ice. It has long been possible to get through or under the ice if one has the ability and inclination to do so. Submarines have been circumnavigating the Arctic for decades.
“Mark Serreze of the National Snow and Ice Data Center in Boulder, Colorado told SPIEGEL ONLINE. “The route that Roald Amundsen navigated in 1903 has been open for the last few days.” ”
http://www.spiegel.de/international/world/0,1518,574815,00.html
“The Northeast Passage (indicated in green on the map), now called the Northern Sea Route, winds from Murmansk on the Kola Peninsula in the west past Petropavlovsk in Kamchatka, Magadan, Vanino, and Nakhodka to Vladivostok on Russia’s Pacific seaboard. Following either of the routes would necessitate navigating through the Arctic Ocean for much of their lengths, dodging icebergs and sea ice floes that threatened to sink or stop a ship dead in its path.”
http://www.wunderground.com/climate/NorthernPassages.asp
Didjeridust,
Do you believe that trends never reverse?
Do you believe that the sea ice will disappear?
Do you believe that sea levels are rising?
Do you believe that there will be eco-refugees all over the world?
Do you believe that Nations will be under water?
Do you believe the UN?
There is more multi-year ice this year than last. I believe it.
The crazy reporting of this non-story made my head want to explode. How can we have crossed the tipping point if there is more ice?
I let the pressure out here-
http://noconsensus.wordpress.com/2008/08/31/arctic-ice-grew-in-2008-agw-what-they-dont-want-you-to-know/
[snip], but the claim that there has been an “increase” is utterly absurd.
we experienced a dramatic loss of ice last year. the second lowest extent on record is NOT a sign of an “increase”.
both passages open. why don t you simply tell us the last year, when this was the case?
Sod
You must understand: More this year than last year is an increase!
Period!
Simple as that!
It’s optimism for … anyone’s sake…
Just see what Watts wrote in a comment further up in this debate:
– “I suppose we are the “glass half full” optimists here.”
Think that says it all…
sod,
If last year was lowest and this year is second lowest, then of course there has been an increase from last year. That is basic primary school mathematics.
The 30 year trend is clearly downward.
Opinions differ as to whether Arctic ice will ever recover from its dramatic shrinkage. Christian Haas is inclined to moderation. “There is still obviously a chance for recovery,” he said, pointing out that last winter was colder than usual. A part of the young ice which froze last winter was even able to survive the summer melting season. But the ice will certainly not soon recover to its 30-year average. “There is too much heat in the water and the atmosphere for that,” he said.
Mark Serreze is still more pessimistic. “An Arctic Ocean that is ice-free in summer is inevitable,” he said. Any recovery made by the ice sheet, he said, wouldn’t last “more than a couple of years in the best case scenario.” By the summer of 2030, he says, the Arctic will be completely ice free for a few weeks at a time.
http://www.spiegel.de/international/world/0,1518,574815,00.html