
Update 2: Reader Jesse Michael forwarded me this animated image above, which does a better job than the flawed NASA image or it’s replacement I found below. It takes about a minute to complete the whole sequence, patience.
While looking for something else, I came across this image from the NASA visualization website. I located the hires TIFF image and annotated it as seen below. I also made a desktop wallpaper out of the TIFF file for those interested. It reminded me to remind you all about perspectives, so here is some perspective on size, solar luminosity, and on our planetary energy budget.

Click here for a larger (TIFF format without annotation) image from NASA
Click here for a desktop wallpaper image (1280×1024 JPEG)
UPDATE: It appears that the NASA provided image above , the source of which is from this NASA page, unbelievably, is wrong. As reader Erik points out, the sun is too large. I initially had some misgivings about the solar size also, but figured NASA wouldn’t possibly botch such a basic comparison. Shades of the Hubble mirror fiasco.
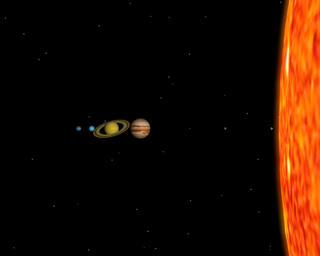
Here is another image from NASA JPL that appears to be correct:

Click for larger image from JPL
Note: image above is L-R mirrored for comparison to first image.
Note that distance is not to scale, but planetary and solar size is. To get an idea of distance scale, read this excellent example from Kitt Peak Observatory.
A few factoids:
- It would take about 109 earths to equal the width of the suns diameter (Sun=1.39 million km Earth=12,700 km)
- Over 1 million Earths would fit inside the Sun’s volume
- The sun has a total luminosity output of 386 YottaWatts
(386,000,000,000,000,000,000,000,000 watts, some background here and here)
- The total luminous energy output received by earth from the sun is 174 PETAWATTS (174,000,000,000,000,000) watts.
- A 0.1% increase in luminosity dumps an extra 174 trillion watts (174,000,000,000,000) watts into our planetary energy balance.

Data source for graph: http://www1.ncdc.noaa.gov/pub/data/paleo/climate_forcing/solar_variability/lean2000_irradiance.txt
Note: In the graph above, the low flatline from 1645-1715 is the Maunder Minimum, a period of virtually no sunspots, where the historical reports from the northern hemisphere tell a story of dramatic climate change: harsh winters, cools summers, crop failures, famine and disease.
From the abstract referenced above: “Estimated increases since 1675 are 0.7%, 0.2% and 0.07% in broad ultraviolet, visible/near infrared and infrared spectral bands, with a total irradiance increase of 0.2%. “
So its not just 0.1 %, it is 0.2% which translates to a 348 TeraWatts global irradiance increase.
Now lets put 348 trillion watts into perspective:
Hurricanes: the heat energy released by a hurricanes category 1-5 equals about 50 to 200 trillion watts or about the same amount of energy released by exploding a 10-megaton nuclear bomb every 20 minutes.
Katrina, released about 200 trillion watts over its life cycle.
Now imagine double that amount of extra energy being added to earth’s atmosphere every second by small increases in the suns output that have been documented to exist. That’s what the increase in solar irradiance is doing. Since 1675, after the depths of the Maunder Minimum, we’ve seen an increase in solar irradiance of about 2.5 watts per square meter.
Climate modelers say that the extra CO2 equates to a forcing of about 2 watts per square meter, which totals about 1.12 Petawatt (1,120,000,000,000,000 watts). The problem is, they can’t always recreate that reliably between all of the different models out there, with the positive and negative feedback mechanisms, and other variables involved. There’s disagreement on the total contribution. A lot of it. Nonetheless they seem all to agree that CO2 makes some contribution, and that’s likely true. But compared to the sun, I believe it’s minimal.
Now lets look at us: 13.5 TeraWatts is the average total power consumption of the human world in 2001.
Compared to solar variance, do you think we could change the planets atmospheric energy balance with that if we squeezed all the power we made that year together and radiated it into our atmosphere ?
What is very clear though, when you look at history, and the graph above, is that our earths atmosphere and resulting climate is extremely sensitive to variations in solar output. The sweet center point seems to be about 1365 watts per square meter of irradiance…what we consider as “normal” climate. Take 1.5 watts/sq. meter away, and we get significant cooling, harsh winters, cool summers, and increases in ice and glaciers. Add 1.5 watts,/sq. meter and we get hotter summers, mild winters, and melting of ice and glaciers.
Now irradiance aside, as it’s only one component, there’s also the chnage in the suns dynamic magnetic field and solar wind, which according to Svensmark, which modulates the number of cosmic rays that enter our atmosphere (I think there may be some possible effect also due to modulation of the earth’s magnetic field), which modulates the number of clouds that form, hence changing the net surface irradiance. Plots of changes in the suns magnetic field line up very well with climate change.
Here is a little more on perspective and our place in the universe:
There’s a tendency to view ourselves, our endeavors, and our accomplishments as the pinnacle. Yet, compared to whats in our solar system, whats in our galaxy, and whats in our universe, we are but a mere speck in the vastness of time, space, mass, and energy.


“Katrina, released about 200 trillion [b]watts[/b] over its life cycle.”
Should be ‘Joules’, yes? One Watt is one Joule/s, and we’re talking about the whole shebang, so it should be in ‘total energy’ not ‘energy per second’. If it isn’t Joules, it might be expressed in Watt-hours, but that should also be converted to something sane – like Joules :D.
Excellent post. And we presume to think we can know enough to predict our future…
I should point out, in case someone gets the wrong idea, that the elephant is an allegory for the sun, and its methane expulsion are coronal mass ejections.
REPLY: Too late, sorry. I already deleted the previous comment because it was OT and made no sense that I could resolve.
Thanks for the post, perspective is everything. There’s a neat little java program that sums things up in much the
I hate to be nerdy, but I am pretty sure that the planetary-solar-perspective image does not have the right scale for the sun. The diameter of the sun is about 10x the diameter of Jupiter, (which in turn is about 11x the diameter of earth).
Based on a radius-of-curvature fit in GIMP, that sun image shows a sun at least 10x too big.
Otherwise, I love the post.
Sorry to be pain, but It’s my skeptical nature that makes me a fan of the blog. (And your good work)
-Erik
REPLY: Well, the source of this image is NASA, you’d think as the world’s leading space agency, they’d get it right. But, it is worth double checking. -Anthony
Update: You are correct. Unbelievably, the NASA image I first used is wrong. I’ve provided a second one. I initially had a bit of misgivings about it, but then I figured that NASA wouldn’t make such a basic mistake in a web presentation. But they did, yikes!
An excellent way of putting this whole thing in perspective. Here’s another way ~ the total amount of CO2 in the atmosphere {as a percentage of the atmosphere} has risen .01%, from .03% to .04%. I know that usually this is represented as a 33% increase, but that’s just as a measure of CO2, not the total atmosphere. That’s one way I manage to keep that small detail in perspective.
Alan,
I believe you are correct.
Katrina did not use a total of 200 trillion watts of energy, Katrina was using 200 trillion joules of energy per second. I would assume the 200 trillion watts is the average power used by Katrina over its lifetime.
Watt is a unit of power, or of a measure of joules per second.
As it takes 4.19 joules of energy to heat up a gram of water 1 degree centigrade, this would indicate Katrina was capable of heating 47.7 trillion grams of water 1 degree centigrade every second.
The heat of fusion for ice is 30.1 x 10**7 joules per meter**3.
This means the energy expended by Katrina, every second, could melt 6.64 x 10**5 cubic meters of ice, or 664,000 cubic meters of ice.
Divide 200 x 10**12 joules by 30.1 x 10**7 joules per cubic meter of ice for the above calculation.
There are roughly 3.0 x 10**16 cubic meters of ice in the arctic.
It would take the Katrina equivalent of energy production 4.5 x 10**10 seconds, or, 1,426 years to melt the arctic ice cap.
Divide 3.0 x 10**16 cubic meters by 6.64 x 10**5 cubic meters of ice per second.
I always love to sit back and try to put things in perspective, which is why this particular topic is so fascinating. Numbers lose their power when they are just viewed as numbers. We always need to ask, “Just how big is big”?
Those comparisons of the different celestial objects really brings the point home.
So its not just 0.1 %, it is 0.2% which translates to a 348 TeraWatts global irradiance increase.
Per year?
Otherwise very good. Well done.
Great post Anthony !!
Since we are wandering around Mars……….. Antares in perspective…….
http://en.wikipedia.org/wiki/Image:Redgiants.svg
Very well explained – thank you
How is irradiance measured? Can we trust teh measurements for 1611?
Do the irradiance numbers show what is hitting the Earth or leaving the Sun?
If it is showing what is hitting the Earth than the lattitude of the instrument would need to be considered. I suppose that more recent numbers are from satellites and would therefore need to be adjusted (here we go again) to be equivalent to ground based numbers.
“So its not just 0.1 %, it is 0.2% which translates to a 348 TeraWatts global irradiance increase… Now lets put 348 trillion watts into perspective….:”
Thank you for some hard numbers that laymen can understand. When I hear algorean science believers scoff at “a mere .1% change in solar irradiance”
I now have the ammunition to show them what it really means.
the total amount of CO2 in the atmosphere {as a percentage of the atmosphere} has risen .01%, from .03% to .04%. I know that usually this is represented as a 33% increase, but that’s just as a measure of CO2, not the total atmosphere.
I believe that 33% increase in C02 has been shown to be incorrect, as it is based on data from ice cores which had clathrates, which take up C02: Climate Change: Incorrect information on pre-industrial CO2. The average pre-industrial C02 in the air was actually more like 335ppm, not the 290ppm the Alarmists like. Taking todays’ level as 390ppm gives an increase of about 55ppm, or a 16.4% increase in C02, about 1/2 what the alarmists claim. Funny, how what the alarmists claim now that it isn’t the C02, per se that’s causing the warming, but the feedbacks. They are simply grasping at straws now.
Antares; isn’t that the sun where “Altair-4”, the planet from “Forbidden Planet”, was orbiting; it must have been a hell of a distant orbit!
Anthony,
Excellent post, but (don’t ya just love excellent… but comments) a couple of things
I got a tad confused about the irradiance figures because you do not specify a time period, I’m assuming /sec for the sun’s output, but I’m not sure what it is, especially the reference to the 10 megaton bomb. If it is /sec, then, as a previous poster indicated, it is joules.
Do you have a reference to Dr. Svensmark’s work because the idea that the sun would modulate the earth’s magnetic field is new to me. I’ve read heis book, “The Chilling Stars”, and it indicates he believes that the earth’s magnetic field plays little role in stopping the GCR involved in cloud formation because the GCRs involved contain too much energy. Has he modified his theory recently?
REPLY: You are correct, Svensmark didn’t say it, that is my take on it. I should have been clearer, and I’ll label that as such.
As for irradiance, see this: http://physics.lakeheadu.ca/courses/Astro/2330/Props/Lumi.htm
Why do all of the TSI graphs stop at 2001-2005? What are the current numbers?
….. Everything is a matter of perspective. If you can’t get yer head around something…. There’s little chance of understanding the full implications.
… That Antares is certainly, a big arsed star!
so the question must be . . . How does human caused CO2 influence Solar Irradiance ? there must be a TBD link between my SUV’s tailpipe and the Sun
Talk about perspective. Thanks for the insight.
Forgive me if this is a question with an answer inherently obvious to all except me. It has been 30 years since I took calculus and physics.
Under “factoids”
• The sun has a total luminosity output of 386 YottaWatts
(386,000,000,000,000,000,000,000,000 watts)
• The total luminous energy output received by earth from the sun is 174 PETAWATTS (174,000,000,000,000,000) watts.
• A 0.1% increase in luminosity dumps an extra 174 trillion watts (174,000,000,000,000) watts into our planetary energy balance.
It is my understanding that a “watt” is a unit of work/energy and the sun produces that energy at a certain rate per unit time, i.e. watts/second (or hour, day or year).
I think that the time units are missing in the factoids. Otherwise, these numbers would seem to be the total energy provided by the sun over its lifetime to date.
Oh, and Anthony.
Thank you.
Yours in bewilderment,
Steamboat Jack
REPLY: See these, it may help in your understanding:
http://physics.lakeheadu.ca/courses/Astro/2330/Props/Lumi.htm
http://physics.uoregon.edu/~soper/Sun/luminosity.html
http://ircamera.as.arizona.edu/NatSci102/sunlab.pdf
Antares is actually smaller than Betelgeuse.
I think that is a labeling error.
One thing overlooked in the Cosmic Ray cloud formation model is that clouds are CONDENSED water droplets from WATER VAPOR.
Water vapor holds a lot of heat that it has to give up when it condenses. If CR causes that process of condensation to occur at a higher rate, then more heat is released of which some will radiate into space.
What happens when you make the condenser on your AC system more efficient? The working fluid gets a lot colder and then the working fluid ( in a natural sycle system ) pumps faster.
The working fluid in the Earth is the air.
“How is irradiance measured? Can we trust teh (sic) measurements for 1611?”
It’s inferred from isotope ratios, Leif Svalgaard posts here and at Climate Audit occasionally, his research (and his links) cover that topic in detail.
Oho!
I did some checking around and discovered that Antares is now considered bigger than Betelgeuse.For many years it was the other way around.
This link is a list of the largest known stars:
http://en.wikipedia.org/wiki/List_of_largest_known_stars
I discovered that Antares is now considered bigger than Betelgeuse.
OOps.
At one time it was the other way around.
REPLY: Proof yet again that science is not static.