
Update 2: Reader Jesse Michael forwarded me this animated image above, which does a better job than the flawed NASA image or it’s replacement I found below. It takes about a minute to complete the whole sequence, patience.
While looking for something else, I came across this image from the NASA visualization website. I located the hires TIFF image and annotated it as seen below. I also made a desktop wallpaper out of the TIFF file for those interested. It reminded me to remind you all about perspectives, so here is some perspective on size, solar luminosity, and on our planetary energy budget.

Click here for a larger (TIFF format without annotation) image from NASA
Click here for a desktop wallpaper image (1280×1024 JPEG)
UPDATE: It appears that the NASA provided image above , the source of which is from this NASA page, unbelievably, is wrong. As reader Erik points out, the sun is too large. I initially had some misgivings about the solar size also, but figured NASA wouldn’t possibly botch such a basic comparison. Shades of the Hubble mirror fiasco.
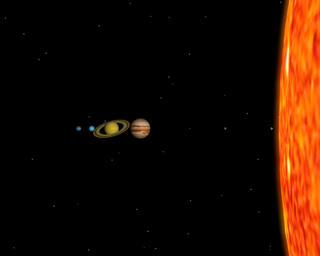
Here is another image from NASA JPL that appears to be correct:

Click for larger image from JPL
Note: image above is L-R mirrored for comparison to first image.
Note that distance is not to scale, but planetary and solar size is. To get an idea of distance scale, read this excellent example from Kitt Peak Observatory.
A few factoids:
- It would take about 109 earths to equal the width of the suns diameter (Sun=1.39 million km Earth=12,700 km)
- Over 1 million Earths would fit inside the Sun’s volume
- The sun has a total luminosity output of 386 YottaWatts
(386,000,000,000,000,000,000,000,000 watts, some background here and here)
- The total luminous energy output received by earth from the sun is 174 PETAWATTS (174,000,000,000,000,000) watts.
- A 0.1% increase in luminosity dumps an extra 174 trillion watts (174,000,000,000,000) watts into our planetary energy balance.

Data source for graph: http://www1.ncdc.noaa.gov/pub/data/paleo/climate_forcing/solar_variability/lean2000_irradiance.txt
Note: In the graph above, the low flatline from 1645-1715 is the Maunder Minimum, a period of virtually no sunspots, where the historical reports from the northern hemisphere tell a story of dramatic climate change: harsh winters, cools summers, crop failures, famine and disease.
From the abstract referenced above: “Estimated increases since 1675 are 0.7%, 0.2% and 0.07% in broad ultraviolet, visible/near infrared and infrared spectral bands, with a total irradiance increase of 0.2%. “
So its not just 0.1 %, it is 0.2% which translates to a 348 TeraWatts global irradiance increase.
Now lets put 348 trillion watts into perspective:
Hurricanes: the heat energy released by a hurricanes category 1-5 equals about 50 to 200 trillion watts or about the same amount of energy released by exploding a 10-megaton nuclear bomb every 20 minutes.
Katrina, released about 200 trillion watts over its life cycle.
Now imagine double that amount of extra energy being added to earth’s atmosphere every second by small increases in the suns output that have been documented to exist. That’s what the increase in solar irradiance is doing. Since 1675, after the depths of the Maunder Minimum, we’ve seen an increase in solar irradiance of about 2.5 watts per square meter.
Climate modelers say that the extra CO2 equates to a forcing of about 2 watts per square meter, which totals about 1.12 Petawatt (1,120,000,000,000,000 watts). The problem is, they can’t always recreate that reliably between all of the different models out there, with the positive and negative feedback mechanisms, and other variables involved. There’s disagreement on the total contribution. A lot of it. Nonetheless they seem all to agree that CO2 makes some contribution, and that’s likely true. But compared to the sun, I believe it’s minimal.
Now lets look at us: 13.5 TeraWatts is the average total power consumption of the human world in 2001.
Compared to solar variance, do you think we could change the planets atmospheric energy balance with that if we squeezed all the power we made that year together and radiated it into our atmosphere ?
What is very clear though, when you look at history, and the graph above, is that our earths atmosphere and resulting climate is extremely sensitive to variations in solar output. The sweet center point seems to be about 1365 watts per square meter of irradiance…what we consider as “normal” climate. Take 1.5 watts/sq. meter away, and we get significant cooling, harsh winters, cool summers, and increases in ice and glaciers. Add 1.5 watts,/sq. meter and we get hotter summers, mild winters, and melting of ice and glaciers.
Now irradiance aside, as it’s only one component, there’s also the chnage in the suns dynamic magnetic field and solar wind, which according to Svensmark, which modulates the number of cosmic rays that enter our atmosphere (I think there may be some possible effect also due to modulation of the earth’s magnetic field), which modulates the number of clouds that form, hence changing the net surface irradiance. Plots of changes in the suns magnetic field line up very well with climate change.
Here is a little more on perspective and our place in the universe:
There’s a tendency to view ourselves, our endeavors, and our accomplishments as the pinnacle. Yet, compared to whats in our solar system, whats in our galaxy, and whats in our universe, we are but a mere speck in the vastness of time, space, mass, and energy.


Anna,
Captain of your soul?
But what about your brain?
A single cosmic ray
could make you quite insane.
Anna, just one more thing, girl …
Yes, we should always do our best but a little perspective helps one to remain calm. Calmness is counterintuitive to many but the history of combat (of all things!) shows it to be imperative.
With my limited understanding, it seems that CO2 mostly absorbs reradiated light from the Earth itself. It and H2O suck up all the incoming from the sun and have done so for quite a while. The only thing left is what the earth produces as a result of absorbing other wavelengths. CO2 absorbs at a couple of points in the near IR, reradiates around 10 microns.
So, what happens to the 10u wavelength? Other things must absorb it in order to warm up. If CO2 is really getting 97% of what it can (I need to find a source for this) then how much more can it do? Hard to absorb more than 100% of something unless you are a government program.
wow, this is amazing, great post!
Here is a good article that lays out the solar system, to scale in a baseball field… http://www.noao.edu/education/peppercorn/pcmain.html
It’s probably written for kids, so I must be a kid at heart. Pretty amazing.
Dav:”Think of it as a blanket. A blanket keeps you warm by preventing the loss of heat”
This description of the “greenhouse effect” on Earth is completely wrong. There is no barrier that seperates two air masses of differenent temperature as you describe. The Earth’s “greenhouse effect” is more like a car. When sunlight passes through the glass windows it’s wavelength is changed to infra red. The inra red energy cannot pass back out through the glass and accumulates inside the car. However, if you open the windows the trapped energy escapes that way. Since water vapor is the major greenhouse gas, a clear, dry night is like opening up the car windows allowing much of that energy to escape back out into space. If our atmosphere acted the way you describe, we would indeed have an unlivable planet ala Venus. But it doesn’t so we don’t.
Found this little exercise that gives some idea of the scale of the solar system.
Sun-any ball, diameter 8.00 inches
Mercury-a pinhead, diameter 0.03 inch
Venus-a peppercorn, diameter 0.08 inch
Earth-a second peppercorn
Mars-a second pinhead
Jupiter-a chestnut or a pecan, diameter 0.90 inch
Saturn-a hazelnut or an acorn, diameter 0.70 inch
Uranus-a peanut or coffeebean, diameter 0.30 inch
Neptune-a second peanut or coffeebean
Pluto- a third pinhead (I know it’s no longer a planet)
You will have found in advance a spot from which you can walk a thousand yards in something like a straight line.
Put the Sun ball down, and march away as follows.
10 paces. Place Mercury
Another 9 paces. Venus puts down her peppercorn.
Another 7 paces. Earth
Another 14 paces. Mars
Another 95 paces to Jupiter
Here is the “giant planet”-but it is a chestnut, more than a city block from its nearest neighbor in space!
Another 112 paces. Saturn
Another 249 paces. Uranus
Another 281 paces. Neptune
Another 242 paces. Pluto
You have marched more than half a mile! (The distance in the model adds up to 1,019 paces. A mile is 1,760 yards.)
Zeke,
Think of it this way. When you place a pot filled with 70C water on a stove and turn on the burner (assuming it is gas so the max temp reached is immediately) does the temp of the flame have to increase for the temp for the water temp to increase? This is why the fact that irradiance has been relatively steady over the last 30-40 years is irrelevant as to whether it is responsible for the heating we’ve experienced over the last 30 odd years. The level of irradiance has been high enough to heat the earth. I don;t know that this is still true though. Anyone have measurements of the irradiance as of 2008?
Zeke:”… there is strong evidence that a good portion of early-20th century warming is in part caused by increasing TSI… And there seems to be no trend in TSI or cosmic rays over the past forty years that could explain the modern warming trend.”
“No trend” assumes the temperature data has been correctly adjusted in the past forty years and the early 20th century.
Zeke-this issue is more complex than Judith suggests. Certainly not all of her colleges would agree with her-For instance, Richard Willson and Alexander Mordivinov:
http://acrim.com/Publications/JGRL2002/2002GL016038%20Secular%20total%20solar%20irradiance%20trend%20during%20solar%20cycles%2021%9623.pdf
With Cosmic Rays, its important to look at the correct energies. Unfortunately, Neutron chambers are way to low. However, if you look at ion chambers, the result is different:
http://www.sciencebits.com/files/pictures/climate/ionChamber.png
The reference is:
Ahluwalia, H. S.: 1997, ‘Galactic Cosmic Ray Intensity Variations at High Latitude sea Level Site
1937–1994’, J. Geophys. Res. 102, 24,229–24,236.
re: no trend in cosmic ray measures.
This is a statement that may reveal a lack of understanding regarding cosmic ray affects on ozone and water vapor. You would not need a trend of “more intense rays”. You would only need to show that at certain levels and increased length of time, rays can penetrate deeper into the atmosphere, thus causing a trend in temperature or cloud formation when the atmosphere is ripe for such seeding. The cosmic ray graph shows interesting shapes: 1. pointed and flat, maximum highs and lows, and peak time. It is possible that these shapes can have more or less influence on climate, depending on the shape.
The Lean TSI chart has reared it’s head again. It is also prominently featured in this article:
http://co2sceptics.com/news.php?id=1396
and is the only one referenced in the resources (I think).
Now according to Leif this chart has been discredited by his chart Leif 2007 and others especially Dora. Others like Krivova and Wang show somewhat the same pattern as Lean. Lean’s graph shows what appears to be a good correlation with sunspots. Leif/Dora show absolutely no correlation with sunspot number. Shades of let’s get rid of the MWP (sorry Leif but it tweaks my BS meter – unfairly I would think).
Now I think the article linked makes a very good point. The TSI has gone up during the 20th century and it has stayed at an elevated level for an extended time. The fact that it has not been constantly increasing is irrelevant. The sun has dumped a lot of heat into the system. (May there be an upper and lower limit to TSI?). Another thought – is the area under the curve indicative of the amount of energy transmitted by the sun? – just vaguely remembering some math.
Can we have a discussion of why the TSI graphs vary so much? Are they using different proxies? Has this article any validity?
Anthony.
You say
———–
“Now lets look at us: 13.5 TeraWatts is the average total power consumption of the human world in 2001.
Compared to solar variance, do you think we could change the planets atmospheric energy balance with that if we squeezed all the power we made that year together and radiated it into our atmosphere ?
————
This sentence means could be somewhat misleading to the less-than-strictly scientific mind. While it puts in perspective the total amount of energy we put into Earth’s surface system(1), the figure does not take into account the long term greenhouse effect of the CO2 liberated by the combustion of sub-terranean fossil fuels (which, fortunately, you discussed somewhere else in the post).
The post could have been improved by discussion / comparison of anthropogenic CO2 vs naturally occuring CO2.
Nevertheless, this post is so good I forwarded the URL to a lot of people.
Keep up the amazing work!
JFA in Montreal, Canada
(1) in fact, a little less that the quoted figure, since we use, apart from fossil fuels and nuclear, some renewable energy like hydro-electricity and wind which, ultimately, derive their energy from the Sun, adding nothing to the Earth’s surface thermodynamic reservoir
Bill (06:05:18):
First: I’m no scintist in this field.
Svensmark don’t say that the magnetic field of the earth isn’t stop GRC, but it stop a less amounts of high energy GCR. The amount of high energy GCR is lower when magnetic solar winds as a shield — an umbrella — “protect the earth”. These two phenomenon means a noticable difference depending on the sun activity in the GCR impact on the earth’s surface. (Low energy GRC wont reach the earth surface anyway, and a difference of these reaching the earth surface then makes no bigger difference.)
Well, my comment is simple and no heavy science (since I’m on scientist) anyway, but let me add these two pictures from The Chilling Stars.
Picture 5, showing how little of the original energetic GRC that reach the surface of the earth:
http://farm4.static.flickr.com/3194/2563732330_e898d3b45e_o.jpg
Picture 6, which shows the effect of the earth magnetic field on high-, intermediate-, and low energy GRC respectively:
http://farm4.static.flickr.com/3033/2563732418_a06ab835ba_o.jpg
Finally: The GCR-low level cloud connection is extremely good! See the figures in this document by Palle, Butler and Brian from 2004 (where the conclusion I think as usual somewhat downplay the actual result):
http://www.arm.ac.uk/preprints/433.pdf
Avfuktare Krypgrund VIND: I guess You’re not even close to be a scientist, so how can You claim you have knowledge in this subject? Oh, of course! You are not at all a scientist. That’s why You can do it! Excuse me.
Avfuktare Krypgrund VIND: Sorry my rudeness, but isn’t this graph
http://farm4.static.flickr.com/3194/2563732330_e898d3b45e_o.jpg
show that modulation of the magnetic field of the earth — also driven by the sun’s magnetism — should have some impact on the GCR’s which is assumed to affect low level clouds, even if it isn’t a major one? (Isn’t, also, the impact on low level clouds from by GRC ionized particles created from reactions between GRC and the magnetic field of the earth? But I’ve got almost no knowledge here!!!!!)
Zeke Hausfather (12:21:39) :
you said:”However, by 2100 we will likely have an atmospheric CO2 concentration that is modeled to produce an amount of radiative forcing that exceeds that of Milankovitch cycles. If CO2 levels remain high indefinitely, the arguement goes, it would be nearly impossible for a new ice age to occur (barring something unseen in the climatic history of the past few million years).”
Isn’t it interesting though that CO2 has not managed the last decade to overcome the effects of PDO? I wonder what the scale of PDO “forcings” versus Milankovich “forcings” is. Maybe we can put another nail down on the anthropogenic CO2 theory coffin.
That said, I have an inherent dislike to the concept of “forcings”. I keep getting the picture of a finger pushing an elephant and expecting to move it backwards or forwards. Or expecting that by jumping up and down the earth moves. The whole heat capacity and inertia of the atmosphere/land/ocean system is trivialized.
Hmmm. It looks like the Earth Sciences have a way to go before their numbers line up:
I’ve run into this rule a few times:
1.0 degrC = 3.3 w/m-2 over the Earth’s surface (I’ve seen it cited a few times)
OK, we’ve seen roughly 0.8 degrC warming since the late 17th C.
So then:
( 3.3 * 0.8 ) =’s 2.64 w/m-2 warming since the 17th C. (roughly)
So if the change in solar rad. since the 17th C. was 2.5 w/m-2,
Then:
( 2.5 / 2.64 ) =’s 92% was due to solar radiance increase
OR
8% increase due to non-solar effects
Then:
( 0.8 * 0.07 ) =’s 0.06 degrC due to non-solar effects (human-caused)
That’s not jibing with the climatologist’s claim of 2 w/m-2.
They’re claiming a 60% CO2 effect of that 0.8 degrC (2.64 W/m-2) temperature rise, or 0.48 degrC CO2 effect.
Also I can’t get the 384 tW value to work with 510T m-2 Earth’s surface to get the 2.5 w/m-2. Am I missing something? 3.3 w/m-2 comes to ~1.7 PW, so I think I’m doing something right. Is this an apples vs. oranges issue?
Anna poses an excellent question.
We must first note that Milankovich cycles have induced glaciations for only the prior 2 million years or so. Before then the same orbital eccentricities happened, but not ice ages. Imbrie makes an excellent case, in his Ice Ages-Solving the Mystery, that the tectonic drift of Antarctica over the South Pole is the primary causal factor forcing (forgive me Anna) Ice Ages. When a continent sits upon a pole, global oceanic circulation is constrained, hence global temp moderation via watery mixing is limited, and ice builds up on the polar continent.
A solution then might be to stir the pot. We could nuke Antarctica, bust the ice shelves off, and tow them north beyond the southern circumpolar current. Eventually they’d work north toward the Equator and melt. That would cool the Tropics but warm the S. Pole, and keep the H2O in circulation instead of stuck in polar ice caps, thus counteracting the Milankovich positive feedback forcing that induces glaciations.
Go ahead and scoff, but I lay claim to this idea, and someday Mike’s Nuclear Summer will save the planet, not to mention Civilization and the Human Race. I expect a few posthumous statues, if not elaborate temples built in memorial to my genius. Be the first on your block to get on in the action, by setting up a small shrine in my honor today.
that new scale animation is really good!
Where can i find the link to it?
I would like to use it in class.
Denis
REPLY: just do right-click, “save as” and save it to your hard disk. Or “properties” to get the URL of the image.
anna v; good image with the finger; of course one may say the advocates of AGW have been giving the rest us the finger for some time; it is amazing that the mechanism by which CO2 traps heat and therefore forces temp is still not understood; CO2 interacts with a narrow part of the IR part of the spectrum; incoming IR interacts, in a very limited way, with CO2 due to the dipole inactivity of CO2 and the double degeneracy of its spectrum sensitivity; excitation of a CO2 molecule takes longer than collisional deexcitation which causes emmission of a photon from the CO2 molecule; that photon can go up or down; if it goes down it will be reemitted from the earth’s surface according to Stefan-Boltzman as IR which in turn will reinteract with the atmospheric CO2 which have been collisionally deexcited; and so on; and apart from albedo, clouds, H2O dominance of the relevant IR absorbtion spectrum and logarithmic saturation limits, there you have the CO2 mechanism for creating earth’s greenhouse effect. Is it any wander it is not commonly understood?
Robert Wood (2008.06.08 15:56)
Robert Wood is right to be puzzled by the greenhouse effect. All the usual analogies I have seen (greenhouses, blankets, cars) are nonsense.
Let’s try and forget about greenhouses. Here is a non-numerical explanation I offer for the examination of the other contributors to this excellent blog. If some genius wants to add the numbers to this account, be my guest!
First of all, let’s imagine an Earth somewhere in deep space without a sun and without an atmosphere. In this situation the temperature of the Earth would be in equilibrium with its surroundings, i.e. as cold as space (throughout this treatment let’s ignore all geothermal warming). All parts of the Earth, superficial and internal would be at the same temperature.
Now let’s see the Earth orbiting the Sun, but still without an atmosphere.
During the day the entire irradiation of the Sun would fall on the surface of the Earth.
Depending on the reflective properties of the surface material (=albedo) a proportion of this radiation would be absorbed, raising the temperature of a relatively thin layer at the surface. As the temperature of the surface layer rises, it will emit correspondingly more radiation (=Planck’s Law).
Importantly, since the surface is solid there will be no convection – even with a liquid surface, the temperature gradient would be the wrong way up for convection to take place.
Let’s ignore conduction, since the materials found at the surface of the Earth are generally very poor conductors, and, as noted, all geothermal effects are ignored.
If the Earth did not rotate on its axis the temperature of the sunny side would increase until it reached an equilibrium of energy input (solar irradiation) and
output (radiation back into space – the final heat sink).
As a consequence the temperature of the surface on the sunny side would be extremely high. The dark side of the Earth would also be in equilibrium with the temperature of space, i.e. would be very cold.
If the Earth is rotating, heated up surface from the irradiated side would pass into the dark side and radiate a proportion of its heat back out to space.
There would be a large temperature swing, but the average temperature of the rotating Earth would be the same as the stationery Earth: the body in space is
going to achieve an overall input-output equilibrium (=Planck’s Law) with its surroundings whether it is rotating or not.
Now add an atmosphere. This atmosphere has three properties of interest to us at the moment:
1) it can absorb solar radiation to some extent (but let’s not get into numbers and absorbers at the moment);
2) being a gas, it can convect, that is, it can transport heat vertically and in turn create other transport mechanisms such as winds;
3) unlike the surface, which is effectively a two-dimensional absorber/emitter, the atmosphere is a three-dimensional absorber/emitter.
During the irradiated part of the rotation, the atmosphere absorbs solar irradiation in its own right. Since this increases the temperature of the atmosphere, it also increases the radiation of the atmosphere: hotter gas molecules radiate more energy (=Planck’s Law).
Some of this radiation goes back out to space, some is absorbed by other molecules in the atmosphere, some reaches the surface. The atmosphere also absorbs a proportion of the radiation emitted by the hot surface.
There is therefore a general mixing up process – since the atmosphere is a gas – and the energy absorbed by the atmosphere is distributed (in a complex way) within
the entire three-dimensional body. Compare this with the relatively thin layer of heating that takes place on the surface of the rotating body without atmosphere.
On the dark side, the atmosphere:
1) emits some of its energy back into space;
2) absorbs some of the energy emitted by the hot surface;
3) emits some of its energy towards the surface;
4) continues convecting.
The result of all this is that the atmosphere acts as a **buffer or reservoir**.
1) During the day it soaks up a proportion of the solar irradiation, surface reflection and surface radiation, thus keeping the surface cooler than it would otherwise be.
2) During the night it continues to absorb surface radiation, but radiates and convects a proportion of its stored energy back to the surface.
The starting point of the GW argument is that if the absorption capacity of the atmospheric buffer (a.k.a. ‘greenhouse effect’) is greater – the ‘reservoir’ can hold more water, if you like – the surface temperature of the Earth will increase. But that’s another argument…
Hemst101 – re Lean 2000
This paper by Scafetta and West nicely summarises the changes in TSI as reported by Lean at various times (1995, 2000 and 2005) showing a significant reduction in TSI variability magnitude in the latest results.
http://www.acrim.com/Reference%20Files/Sun%20&%20Global%20Warming_GRL_2006.pdf
Global Warming and the Sun…
Tigerhawk makes a reference to a very good write up on planetary perspective. One part of that concerns the sun’s effect on the temperatures of the planets around it, specifically the Earth’s temps. What is very clear though, when you…
So I got a little curious and took a peak Solar flux history, shown here http://www.dxlc.com/solar/history/ and find that todays Solar Flux reading of 65 — from http://www.dxlc.com/solar/ is remarkably lower than reading from last 20 years. In 1990 the flux readings were in the 200-300, it seems to have stayed in that range until 2005 when it dropped into the 80-90 range and has drifted lower to its present range today. This seems to correspond with the precipitous drop in sunspot activity that occurred in 2005 as well.
Magnus,
I am a huge advocate of Dr. Svensmarks work, I’ve read his book “The Chilling Stars” several times and am awaiting the results of the ‘CLOUD’ experiment being run at CERN as we speak.
I think I understand what folks are talking about as far as the sun ‘modulating’ the earth’s magnetic field. The solar wind does impact the earth’s magnetic field, ‘compressing’ it on the sunward side, but that does not mean the same thing to me as ‘modulating’. By ‘modulating’ I would expect that the sun would be causing changes in the strength of the field, which I don’t think it does. The earth’s magnetic field has been decreasing for the last few hundred years, many thinking this is in preparation for a polarity change, for which we are overdue.