Analysing NASA Sea Level Data with different starting dates

by Dr. Alan Welch FBIS FRAS

Summary

This study started after considering the following question:-

“Satellite measurement of sea levels, release of data and analysis generally started in 1993. How would different models react to the analyses starting at later dates?”

A range of start dates were investigated. The main conclusions were that the concept that the sea level rises were accelerating and that the rate of acceleration is basically stable is shown to be untenable.

Having presented the different start date analyses and shown their findings, an appendix brings together all the studies showing that sea level rises follow a sinusoidal pattern. Hopefully this will reach a wider audience than WUWT and illicit a response to the work from other workers in this field.

 Changing Starting Dates

Much of the concerns regarding sea level rises has arisen following the publication of two papers by Nerem et al (Ref 1 and 2) in 2018 and 2022 respectively. In these papers they use quadratic curve fitting to derive a perceived acceleration and then extrapolate into the future. Their two main conclusions are that the sea level rise could be modelled as a quadratic curve and that the “acceleration”, derived as 2 times the quadratic coefficient, is stable after 2017. These papers are highly cited and still appear in many Google searches regarding sea level rises.

When analysing data using a quadratic curve the outcome can be greatly influenced by the start date of the study and by the length of the data set. In my previous work (such as ref 3) a sinusoidal curve variation has been considered more appropriate, that variation being about the best linear fit. In the very long term, such as with Tidal Gauge data, periods of analysis may show other long term slower changes which can be ignored in satellite data analysis.

Using August 2026 data two studies were undertaken (see notes on data sources). Firstly, analysing the actual data and secondly analysing a sinusoidal best fit. A common feature, namely the change with time of the perceived “acceleration”, was used in judging effects this being derived from fitting a quadratic curve. Using this “acceleration” does not attach a physical meaning but the way it does or does not change with time can be very revealing.

The actual data involve some short-term variations due to the annual and semi-annual signal and many random short-term variations. These had a bigger effect when the actual data are analysed compared with a sinusoidal fit curve. Analysing short NASA data sets using less than 20 years of data could produce large fluctuations in “acceleration”.

The effect of the start date can be more fully studied for the sinusoidal curve as it can be extended backwards and forwards to give a more complete investigation. Pseudo data were generated for a 27.6-year period curve with an amplitude of +/- 3.8 mm.

The “accelerations” were calculated for several starting dates from 1963 to 2007 in steps of 4 years. A selection of the more extreme results was plotted as shown in Fig 1. The plots of “acceleration” are for start dates of 1963, 1971, 1979, 1987,1999 and 2007 and being based on a sinusoidal variation produce smooth curves right back to the start date. All of these curves show a decay in “acceleration” over time reaching near zero values after about 50 years.

Also shown are the “accelerations” calculated using the NASA data and part of the1993 start curve. This 1993 start graph has appeared in many reports (Ref 3, 6, and 7) on how sea levels have been changing and has been flagged as being one of the more important graphical presentations in judging various models. It is only shown from about 2020 onwards as prior to this the curve based on the NASA data becomes more erratic when shorter time periods are used.

Figure 1

These were sufficient to show the expected repeating pattern on roughly a 28-year cycle. There were near positive peaks for starts of 1979 and 2007 of about 0.2 mm/year2 and mirror image intermediate negative dips.

Turning to the actual data it is not possible to go back before 1993 and if a start date is too far on from 1993 the range of data may be too short to be meaningful.

A 1999 start date was chosen and the plot of “accelerations” is shown in figure 2 for the actual and sinusoidal data. It has been found that it requires nearly 20 years for the graph to settle. Up to 2006 the data used readings from the Topex satellite which seemed to be less reliable when compared with the Jason 1 satellite launched in 2001. The individual

satellite readings were available on a NOAA site, but this seems to have vanished. Data from NASA and University of Colorado also changes occasionally with no explanations provided. In extreme cases EVERY data value changed. A fuller description of the data sources is provided at the end of this paper. Only the latest NASA data are available and since 2018 the University of Colorado data have also been removed except for the latest.

Figure 2

It was not possible to carry out an analysis for the first dip as this would require an approximate start date of 2014 leaving only about 12 years of data.

The 1993 start analyses has been reported many times in monthly studies and yearly reports but the 1999 start results shows a higher peak in “acceleration”. In figure 2 the two curves show a similar higher peak of about 0.13mm/year2 although the build-up is much faster for the actual data possibly due to the fact that the data starts from a low base soon after 1999 which could result in much higher “decelerations” early on.

A copy of the 1993 start date is shown in figure 3.

Figure 3

As a start date of 2014 is not possible due to the short extent of the data a start date of 2007 was considered a possibility. Figure 4 shows the results. The “accelerations” now reach a sizeable negative “deceleration” stage with the 2 curves matching well over the 2019 to 2026 period. The satellites now used are Jason 1 (2001-2013), Jason 2 (2008 –

2019), Jason 3 (2016 -) and Sentinel-6 (2020-) which showed much better correlation where they overlapped.

Figure 4

The conclusions from these analyses are that with different starting dates the same data can produce as much “deceleration” as “acceleration” reaching values in the region of +/- 0.2 mm/year2.

Figures 2, 3 and 4 show starting dates of 1999, 1993 and 2007 and all show an agreement between a best fit sinusoidal set of data and the actual data although when the sinusoidal data can be analysed back to the start date the actual data analyses only settle down after a period of about 20 years. Over the years the 1993 start has been extensively studied, and it may be informative to extend this ongoing analysis to the 1999 and 2007 start dates.

The term “acceleration” was introduced in the Nerem et al paper of 2018. This was quickly picked up by the media and public and by using extreme extrapolation, initially up to 2100 but later up to 2050, completely wrong conclusions were reached concerning long-term sea-level rises. If it had been referred to as a quadratic coefficient it would be seen to be just what it is, a mathematical term. Also, the various figures show there is a wide range of “accelerations” from -0.2 to +0.2 mm/year2 depending on the start date of the analyses. This totally negates the Nerem et al 2022 statement that accelerations are stable after 2017.

With these new findings I have decided to lay out all the previous evidence in order to question the accelerating sea level rise theory.

 Other studies

Apart from figures 1 to 4 above the following are also evidence against the accelerating sea level rise theory.

Whilst Figure 3 plotted the “accelerations” with time derived from a single data file Figure 5 plots the end “acceleration” from every data file studied. These started being studied in 2018 and most of the data sets issued by NASA and University of Colorado were used which amounts to over 60 data sets. The equivalent sinusoidal curve is also shown. In figure 5 each point gives the “acceleration” calculated at the end of each analysis. Step changes between consecutive points represent major changes in data.

Figure 5

Figures 6 and 7 are plots of the sea level residuals with best fit quadratic and sinusoidal lines shown. The residuals are the difference between the actual value and the value on a best fit linear line.

Figure 6

Figure 7

The sinusoidal curve is seen to be a much better fit. The reduction in Standard Deviation seems quite small but most of this is due to the large variation caused by the annual and semi-annual signal. The Standard Deviation of the residuals about the y=0 line is 5.83 so the improvement in Standard Deviation is 0.52 for the quadratic curve and 0.70 for the sinusoidal curve.

An Excel Workbook was developed to find the best fitting sinusoidal curve to a set of data. In this an equation of the form in Excel format

Y = CONST+AMP*SIN(((SHIFT+2*X)/PERIOD)*PI())

is used in which Y is the Residual

CONST = a vertical offset that comes about because of the start date for the data (mm) AMP   = the amplitude of the sinusoidal curve (mm)

SHIFT      = a phase shift (years)

PERIOD = the period of the sinusoidal curve (years)

An initial estimate of the 4 parameters is made and by applying small +/- changes to these parameters and calculating the square root of the sum of the errors squared the process converges on to a best fit curve.

This was applied to the 2007 Start data. The result is shown in figure 8 and is compared to the 1993 finding. There is little change in the parameters of the derived equation. The constant goes from -0.6 mm to -1.1 mm, but this has no effect on the other parameters. The amplitude increases from 3.8mm to 4.2 mm, the phase shift stays the same, and the period reduces from 27.6 years to 27.0 years. Fitting quadratic curves changes the quadratic coefficient from +0.0288 to -0.0243 equivalent to a change in the acceleration of 0.0576mm/year2 to a deceleration of 0.0486 mm/year2.

Figure 8

 And finally

What estimates of “acceleration” did the advocates of an accelerating sea level rise make over the last 8 years?

In Ref 1 (2018) a value of 0.084mm/year2 +/- 0.025mm/year2 was quoted based on 1 sigma standard deviation.

In ref 2 (2022) a value of 0.08mm/year2 +/- 0.065mm/year2 was quoted based on 5% and 95% bounds.

In ref 4 (2024) a value of 0.08mm/year2 +/- 0.06mm/year2 was quoted based on 5% and 95% bounds. This paper also stated, “the impact of the 2023 El Niño is minor, demonstrating that the currently measured acceleration is unlikely to vary significantly in the immediate future.”

Note that over 2025 the “acceleration” dropped 0.008 mm/year2 and up to the start of September 2026 the “acceleration” has already dropped another 0.008 mm/year2. In ref 5 I attempted to predict the values of “acceleration” over the next 5 years starting at the end of 2025. Four predictions were made with lower and upper bounds and both with and without a large El Niño. Figure 9 shows the lowest and highest predictions along with the September graph.

Figure 9

The predictions were made on based on the December 2025 data whereas the NASA plot was for the Sept 2026 data. The NASA Data changed in April 2026, and Figure 10 shows the differences between the March 2026 and the April 2026 data with best fit linear and quadratic curves.

Figure 10

 Conclusions

All the graphs point to the sea levels varying about the best linear line in a sinusoidal manner with amplitude of around 4mm and a period of around 27 to 28 years.

In the 2022 Nerem et al paper (Ref 2) a graph like figure 3 was included although the date range was 2006 to 2022 (figure 11). Contact was made with one of the co-authors (B.D.H) pointing out that it was an interesting presentation and could it be updated occasionally. No reply was received and as far as can be ascertained no update has been issued.

Whilst rejecting that the sea level rise is accelerating, except for a low value around 0.01mm/year2 commensurate with the long-term tidal gauges, using calculated “acceleration” values using a quadratic fit has proved very useful in following trends and showing that the concept of high accelerations is unsustainable.

Figure 11

Additional Note

After completing this paper, a presentation of the 3 plots with different start dates using a common scale was carried out.  This was found to more informative and the results are shown below.

They show the progression of the various peaks and the mirror image between the 1993 and 2007 starts.

# # #

 Notes on Data Sources

The various data sets used come from several sources.

 NOAA– The individual satellite values were found on

https://www.star.nesdis.noaa.gov/socd/lsa/SeaLevelRise/LSA_SLR_timeseries.php

although this as not been updated since Jan 2025.

Whilst listing the Global data it also gave lists for 24 sub-areas around the world.

 NASA– The latest data are found on

https://sealevel.nasa.gov

In 2018 and for many years the NASA data showed much more information such as number of observations, standard deviation of data and data with and without various adjustments. Now only 2 columns are listed both with the results including the annual and semi-annual signal but with and without the 60-day averaging. Also, NASA have resorted to a 7-day listing instead of a 10-day listing used up to 2025. 10-day listings seem more appropriate as the satellites follow 10-day repeating orbits.

 University of Colorado – The data can be found on

https://sealevel.colorado.edu

They present on average once or twice a year 2 sets of data. These are based on a 10 day spacing and are with and without the annual and semi-annual signal which is useful as without this signal it shows a much smoother plot.

Up to recently the site showed all the historic data and plots but of late only those up to 2018 and the latest are shown.

 References

  1. Climate-change–driven accelerated sea-level rise detected in the altimeter era

R. S. Nerem, B. D. Beckley, J. T. Fasullo, B. D. Hamlingtond, D. Masters, and G. T. Mitchum

https://repository.library.noaa.gov/view/noaa/26954

  • Extrapolating Empirical Models of Satellite-Observed Global Mean Sea Level to Estimate Future Sea Level Change

R. S. Nerem, T. Frederikse, B. D. Hamlington

https://agupubs.onlinelibrary.wiley.com/doi/full/10.1029/2021EF002290 3 Measuring and analysing sea levels using satellites during 2025 Alan Welch

https://wattsupwiththat.com/2026/01/14/measuring-and-analysing-sea-levels-using-

 satellites-during-2025/

  • The rate of global sea level rise doubled during the past three decades

https://www.nature.com/articles/s43247-024-01761-5

  • Technical note on the possible variation in sea level rise accelerations over the next 5-years Alan Welch

https://wattsupwiththat.com/2026/07/02/technical-note-on-the-possible-variation-in-sea- level-rise-accelerations-over-the-next-5-years

  • Measuring and Analysing Sea Levels using Satellites during 2023 — Alan Welch

https://wattsupwiththat.com/2024/03/21/measuring-and-analysing-sea-levels-using-satellites-during-2023/
# # # # #

The climate data they don't want you to find — free, to your inbox.
Join readers who get 5–8 new articles daily — no algorithms, no shadow bans.
5 8 votes
Article Rating
Subscribe
Notify of
46 Comments
Sparta Nova 4
October 14, 2026 10:07 am

Apologies for the nit picking in an otherwise informative study.

” and illicit a response to the work from other workers in this field.”

The word is elicit, to draw out evoke or bring forth a response.
Illicit means illegal, forbidden, or not permitted by rules, laws, or custom.

Mr.
Reply to  Sparta Nova 4
October 14, 2026 10:37 am

Is Nick not available?

Sparta Nova 4
Reply to  Mr.
October 14, 2026 11:04 am

It is highly unlikely Nick would have spotted that minor error.

Reply to  Sparta Nova 4
October 14, 2026 11:59 am

But if he did, he would insist the error means the whole study should be discarded and the original, alarmist nonsense is “still valid.”

Sparta Nova 4
Reply to  AGW is Not Science
October 14, 2026 12:48 pm

That assertion is well supported by observational data.

Nick Stokes
Reply to  Sparta Nova 4
October 14, 2026 1:05 pm

I did. But I illiterated it from my memory.

Mr.
Reply to  Nick Stokes
October 14, 2026 8:19 pm

🙂

Sparta Nova 4
Reply to  Nick Stokes
October 15, 2026 12:27 pm

I give you points for humor. 🙂

Alan Welch
Reply to  Sparta Nova 4
October 14, 2026 10:49 am

Sorry about that
thanks for your reply

Sparta Nova 4
Reply to  Alan Welch
October 14, 2026 11:04 am

We both know words matter.
We also both know spelling errors and wrong words are a unwanted distraction.
I am pleased you view this as help.
Cheers.

Richard Voss
Reply to  Sparta Nova 4
October 14, 2026 1:17 pm

Oh, I thought he meant “elicit an illicit response.” But this makes more sense. 🙂

Sparta Nova 4
October 14, 2026 10:18 am

Interesting.
It reminded me of the 22 year solar cycle, not that that would be a factor.
What might be: Lunar orbit (tidal effects) for short term variations and…
The earth orbits the barycenter on an eccentric elliptical orbit.
The other planets also orbit the barycenter with different orbital definitions.
The sun orbits the barycenter, although orbit might not be the best choice to describe it.

The point: When ferreting out the baseline frequencies, one must at least examine the solar system gravitational effects.

Perhaps a Fourier Analysis could help resolve the different frequencies?

If I am off, so be it, but suggestions are worth while.

Alan Welch
Reply to  Sparta Nova 4
October 14, 2026 10:49 am

The point is that it is the concept of an acceleration I am against
There is definite sinusoidal behaviour of some sort or another

Sparta Nova 4
Reply to  Alan Welch
October 14, 2026 11:06 am

I concur. The hyperbolic claims of destructive ocean rise acceleration is bogus.

My idea is that there are multiple cycles and perhaps solar cycles might be detected in the measurements. Certainly that would be grounds for another interesting article if proven valid.

Sparta Nova 4
October 14, 2026 10:20 am

If one takes a snippet of a sine wave and extrapolate the end points of the snippet, one can create any curve imaginable.

It seem that a lot of the “settled climate science” does that routinely.

Alan Welch
Reply to  Sparta Nova 4
October 14, 2026 10:49 am

I’m not snipping anything
I fit a sine curve to the residuals of the data from the best fit linear line and then calculate the “accelerations” the Nerem way and compare with the “accelerations” calculated using the full data

Sparta Nova 4
Reply to  Alan Welch
October 14, 2026 11:10 am

I apologize.
You seem to have misunderstood.
My comment was not directed to you and I should have been clear about it.
Your excellent paper triggered a divergent train of thought is all.

I have seen too many “climate trends” where that partial cycle with extrapolation was employed to get bogus results.

Your article was quite clear on your methods.

Reply to  Sparta Nova 4
October 14, 2026 4:04 pm

They take a snippet that should be a sine and apply least square regression.

Everything on this old earth in cyclic until proven otherwise.

Michael Flynn
Reply to  Jim Gorman
October 14, 2026 4:29 pm

Everything on this old earth in cyclic until proven otherwise.

Temperature doesn’t seem to be cyclic – from molten surface to now. I’m not aware of any internal physical process which will “cycle” it back to being molten again.

But anyway, my view is that everything on this old Earth is chaotic (until proven otherwise), which is why “cyclists” are generally doomed to failure. “Epicyclists” held sway for thousands of years – seemed logical, seemed to fit observations, up until Johannes Kepler came along.

Nature won again.

I’ll back nature against NASA, any time.

Reply to  Sparta Nova 4
October 14, 2026 4:08 pm

That’s why a 30 year period as the definition of “climate” is so problematic. It’s close to 1/2 of the period of major climate cycles (PDO/AMO) resulting in vacillation between fears of coming ice ages and fears of global boiling.

October 14, 2026 10:29 am

So a sinusoid has about the same deviation as a horizontal line at .05mm/yr….but thanks for pointing it out…

Alan Welch
Reply to  DMacKenzie
October 14, 2026 10:50 am

Sorry – don’t understand your point

Ron Long
October 14, 2026 10:38 am

Well, it’s a good report, and it is correct to try to set scientific standards in a way that produce the best quality results, but….jeez! …..start dates for sea level variance in 1963? Try the PreCambrian to Cambrian transition around 540 million years ago, and analyze the sedimentary record, utilizing Sequence Stratigraphy (EXXON Knew!) and get the result for about 40 meters higher and 140 meters lower as normal.

Sparta Nova 4
Reply to  Ron Long
October 14, 2026 11:12 am

Ah, but the Climate Imperialists would claim it is not possible to extract relevant data from the geological records going back that far.

I mean the Trans Reality Alarmists believe the world’s climate started in 1860.

Consider that he turned the satellite measurements into something useful and exposed the prior fraud.

Alan Welch
October 14, 2026 10:52 am

I’m adding some extra thoughts
The 3 additional graphs showing the change in “acceleration” with a common vertical scale are very revealing. They show completely different behaviours for the different starting dates. If the Nerem et al approach was correct and had been used for the 1999 and 2007 start dates the derived accelerations would have all been expected to be similar to the 1993 start values. If they were not the statement of a stable value of acceleration and the process of extrapolation would all be invalid.
If anyone associated with the stable acceleration theory would like to reanalysis with the 2 other start dates and share their findings, I would be very interested. The next few years with the 2007 start date could be very interesting as the “acceleration” has already reached a “deceleration” of 0.05 mm/year2 and is on course to reach 0.08 mm/year2 by 2034. This a complete inverse in behaviour to a 1993 start date and is a consequence of the 1993 and 2007 starting dates being roughly half of the 27.6-year cycle apart.

The 2007 start date analysis is limited by a shorter overall time-span so it is important to keep monitoring it. In 2018 the 1993 start date analyses were also hampered at first by a shortish time span but at that stage I suspected a sinusoidal content in the global data. I submitted a paper to PNAS in 2018 following the Nerem et al paper but it was rejected at Peer Review. In it I put forward the alternative analysis based on a sinusoidal variation and over the last 8 years built up a large quantity of evidence to support it.

Sparta Nova 4
Reply to  Alan Welch
October 14, 2026 11:14 am

Were you informed the basis of your paper’s rejecction?

Alan Welch
Reply to  Sparta Nova 4
October 14, 2026 12:00 pm

Yes They said they get too many papers to publish and mine wasn’t of sufficient quality.
To some extent I would agree and over the 8 years I hope I have improved,
They never said who carried out the peer review.
I’ll keep building up the evidence month on month and that is why I feel having 3 start dates is important. I hope I succeed in toppling the ideas of Nerem and his cohorts but in a couple of months I’ll be 89 and sea level rises change so slowly – fingers crossed!

Sparta Nova 4
Reply to  Alan Welch
October 14, 2026 12:50 pm

Humor alert.

I most certainly hope you succeed in your quest to publish real science…. (wait for it)… before America sinks (watched that movie last night).

Reply to  Sparta Nova 4
October 14, 2026 1:16 pm

I’m sure “Because it’s devastating to my case!” (H/t to Jim Carrey) are words too sour for them to voice, even though that is reality…

October 14, 2026 11:04 am

Three titles from Dr. R. Steve Nerem:

Why has an acceleration of sea level rise not been observed during the altimeter era? 2011

Is the detection of accelerated sea level rise imminent? 2016

Climate-change–driven accelerated sea-level rise detected in the altimeter era 2018

Could this guy be any more transparent?

And then there’s this:

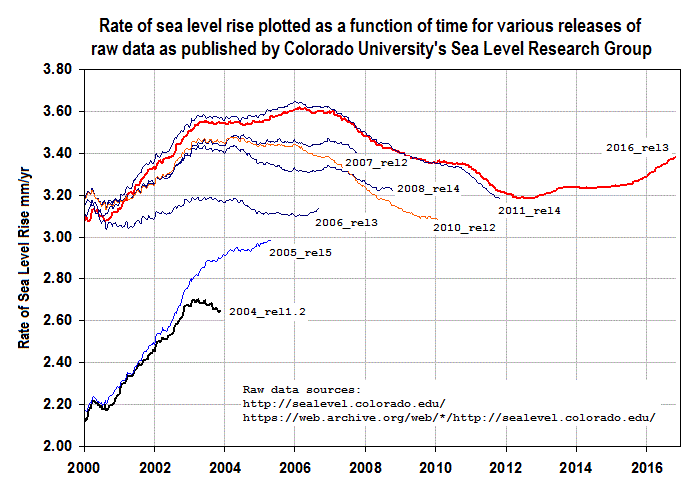
comment image

All those plotted lines should fall on top of one another, they don’t.

Alan Welch
Reply to  Steve Case
October 14, 2026 12:00 pm

Their data changes year on year. They used to show all the graphs and data files on their site but now only those up to 2018 and the latest. Luckily I have captured most of their data files and could replicate your graph covering 2018 to 2026. Watch this space. I feel another paper coming on!!

Reply to  Alan Welch
October 14, 2026 12:06 pm

Thanks for the reply, I try to visit WUWT every four hours to see what’s new. These days, climate politics & economics seems to be the lion’s share of posts.

October 14, 2026 1:51 pm

Complex analysis over near noise .
Analyzing changes of 0.00008 meters per year per year ?
Did I get that decimal right ?

Alan Welch
Reply to  Bob Armstrong
October 14, 2026 11:09 pm

You got it right.
But remember what is quoted as Global Sea Level Rise is only 95% of Global Rise due to satellite cover. What happens in the other 5% is important, especially as that 5% is mainly confined to the large N Atlantic and Arctic Oceans where decadal oscillations may have an effect. I have addressed this in a previous paper.

October 14, 2026 2:17 pm

For the layman, just display long term graphs of tidal gauge data, overlay with a straight edge and you will see no acceleration on virtually all of them.

Wish someone would write a piece on the two methods of measuring sea level rise. One is tidal gauges showing about 1.8mm/year on average after VLM is removed with no acceleration. The other is satellite measuring which averages over 3mm/year with acceleration.

This means that there is an ever increasing difference between coastal and non coastal water levels! After 10,000 years assuming current conditions, the difference would be over 20 metres!

We are told they measure different things but that also is nonsense because they are both referenced to land. Basic physics tells us that the two measurement systems produce the same on average.

Alan Welch
Reply to  Peter Rees
October 14, 2026 11:32 pm

Thanks for your comments.
We are not measuring different things when looking at Tidal Gauges and Satellite readings. We are applying a mathematical tool namely quadratic curve fitting over 2 different periods and wrongly converting this to acceleration. The long term Tidal Gauges with 100 to 200 years of data come up with so called accelerations in the region of 0.01mm/year2 but in the long run even this could be misleading. I analyzed the Brest data of over 200 years and using a spectral analysis there was a hint of a 1000+ year cycle which fitted in neatly with the known changes in climate over the last couple of 1000 years. I know it sounds like cycles upon cycles but even the long term Brest Tidal Gauge data can be matched just as good with a 1200 year cycle as with a quadratic curve. I covered this in a previous paper. When it comes to Satellite data we only have just over 30 years of data so applying a quadratic curve is dodgy if we interpret it as an acceleration. But we can make use of how that perceived acceleration changes with time to make judgements. I am showing how that perceived acceleration decays with time and judge that against the equivalent decay in a sinusoidal model. I showed this graphically in my first paper on WUWT back I think in 2022.

Izaak Walton
October 14, 2026 4:08 pm

How exactly are you calculating the acceleration. You say that you fit a sinusoidal curve to the data using excel as
Y = CONST+AMP*SIN(((SHIFT+2*X)/PERIOD)*PI())
yet the second derivate of sin(x) is -sin(x) and so the acceleration from a sinusoidal fit should also be a sin function. Yet you state that your “show a decay in “acceleration” over time reaching near zero values after about 50 years.”.

Michael Flynn
Reply to  Izaak Walton
October 14, 2026 4:38 pm

How exactly are you calculating the acceleration.

Who cares? All this sealevel nonsense is supposed to be related to the popular delusion that adding CO2 to air makes thermometers hotter, which is completely insane – because it doesn’t.

The crust moves, ocean basins change as a result, sea levels rise, sea levels fall – as do land levels. The only constants are human gullibility and ignorance.

Oh well, onwards and upwards!

Alan Welch
Reply to  Michael Flynn
October 14, 2026 11:41 pm

It does matter if a paper by Nerem et al which has over 1500 citations is used as the truth and a real physical result that is then used by the BBC and many papers to frighten the life out of the general population, their kids and Greta Thunberg.

Alan Welch
Reply to  Izaak Walton
October 14, 2026 11:38 pm

I am not calculating an acceleration of the sine curve which you rightly quote as itself being a sine curve but calculating a best fit quadratic curve to both the real data and a best fit sinusoidal curve and, wrongly, calling this acceleration. But in using a common technique between real data and a sinusoidal best fit the changes in these perceived accelerations can be revealing and do show a decay to near zero values.

Izaak Walton
Reply to  Alan Welch
October 15, 2026 2:03 pm

That still doesn’t make sense. If you fit a quadratic curve to a set of data then the coefficients are constant and so the acceleration does not vary with time. The same if you fit a sinusoidal curve — none of the fit parameters change with time. So why does the acceleration decay over 50 years?

Now you fit a quadratic y=a0+a1*t+a2*t^2 then it is natural to call 2*a2 to the acceleration since d^2y/dt^2=2*a2. And again it is constant and does not depend on time. If you fit a sinusoidal curve to the data and again take the second derivative you get another sinusoidal curve and the acceleration will vary but it will not decay.

Reply to  Izaak Walton
October 15, 2026 6:08 am

What I see are well damped sine waves. Damping will provide a negative acceleration. Is a well damped sine actually occurring? Only time will tell.

Alan Welch
Reply to  Jim Gorman
October 15, 2026 6:40 am

They look like under damped sine curves which would have an equation such as (in Excel Format)
Y = A * EXP(-C*T) * COS(W * t + B)
But the curves in Fig 1,whilst looking similar, are derived by fitting a quadratic curve over progressively longer and longer sets of data and obtaining perceived “accelerations” by doubling the quadratic coefficient. I don’t know if the curve has a derivable equation but plotting how it changes with time and comparing with the real data has been very useful.

KevinM
October 14, 2026 8:00 pm

2026-1991 = 35 years of data.
Earth’s age is at least twice that.

Yooper
Reply to  KevinM
October 15, 2026 5:44 am

Hell, my age is more that twice that…. 😉

Sparta Nova 4
Reply to  KevinM
October 15, 2026 12:34 pm

But, but, but, climate started in 1860. So you have to come up with a better calculation! 🙂