By Kenneth Richard on 26. January 2026
Decades of satellite data confirm the globe has been substantially greening – as defined by rising Leaf Area Index (LAI) values – since the 1980s.
The CO2 fertilization effect (CFE) enhances plant productivity via improved light use efficiency and water use efficiency. In other words, with elevated CO2, photosynthesis rates are not as hampered as they would be when sunlight and water availability are limited.
A new study indicates India is the second largest contributor to global greening, and that CFE has driven a “substantial expansion of global green cover over the last two decades.”
The authors found the CFE has “nearly doubled” the trend values in net primary production [NPP] across India relative to the trend values when the CFE is not considered.
Interestingly, despite the elevated CO2, much of India has been cooling since 2000. While the southern peninsula and parts of eastern India have been warming this century, “central and northwestern regions experienced a cooling trend.”
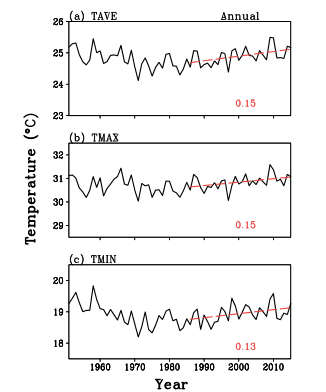
It should be noted that India’s annual mean non-warming trend has been ongoing since 1950 (as shown in Sanjay et al., 2020).

Image Source: Das et al., 2026

Image Source: Sanjay et al., 2020
CO2’s been very good to me.
You and every other living thing on the planet.
How can this be occurring when the climate alarmists have been assuring us that since India is the third largest carbon emitting nation, their temperatures would soar to nearly-unbearable levels, its agricultural productivity would rapidly decline, famines would abound, and its overall population would start falling? In reality, the temperatures have stayed steady for 75 years, their food output have risen to a point where it’s exporting its surplus rice and other grains, and its population is now the largest in the world. So once again we see the doomsday prognosticators being dead wrong because they overestimated whatever threat climate change poses and underestimated human adaptability and creativity.
You didn’t follow the link to the sited study, did you?
Otherwise you would have known that, contrary to the claim made in the article, it confirms that statistically significant warming has occurred in India.
The only way you could have missed that is by believing what this absurd article says without checking the links it provides.
If you don’t bother to make even this most basic of checks then please, please refrain from thinking of yourself as as Skeptic, because skeptics check things.
‘cited study’ (not ‘sited study’), sorry.
Graphs show no net warming since 1950… 75 years
You have presented nothing to counter that fact.
The warming since 1970s is almost certainly mostly urban warming.
India data shows maximum temps have no net warming since 1920
Slight warming in minimums due to urban effects.
Where did you get that graph?
Data from India. Unfortunately link is no an old computer that died…
but I still have the data.
1n 1900, the concentration of CO2 in air was ca. 295 ppmv (0.58 g CO2/cu. m. of air) and by 2015, it had increased to ca. 399 ppmv (0.78 g CO2/cu. m. of air), but there no corresponding increase in India air temperature except for a slight increase after 2000. Note how little CO2 there is in the air.
This is more empirical temperature evidence that CO2 does not cause warming of air and hence global warming.
Odd there isn’t more sign of urban warming..
….. here is a typical building in Delhi…
Where’s the Stevenson screen?
So AB thinks those won’t cause warming ..lol
Sorry, I forgot, the Met Office use their proximity to create warming
I think we can expect historic Indian weather sites to be in a similar condition to the Met Office sites ! 😉
Why don’t you simply make the claim that you can’t see the heat so it doesn’t really exist!
Jimbo,
The heat can be taken for granted.
The IMD thermometer not so much.
If the additional warmth can be taken for granted, then the IMD thermometer is not needed to know there will be higher temperatures.
Your comments about Stevenson screens and thermometers is nothing more than a red herring argument meant to deflect.
If whatever warming has occurred why hasn’t it affected food production and caused a population decline? Aren’t those supposedly the negative impacts of “significant warming”, or maybe humans have learned not to cringe and become petrified because the alarmist faction believes it can scare consumers into taking action that’s largely unnecessary.
In fact, India keeps getting record grain production most years,
Only IF you cherry pick the start date halfway through the series. 😉
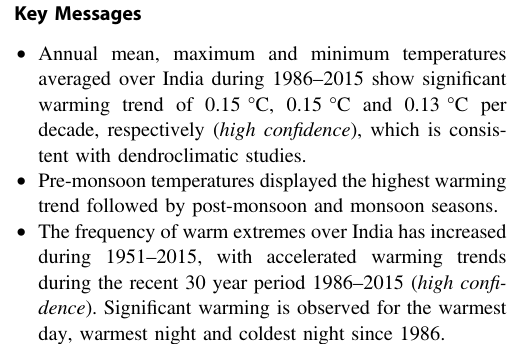
1986 to 2015. And they even cite tree rings.
I mean you did see that didn’t you?
Edward’s claim was
Your claim was
The paper actually says
Which is just 40 years. And you follow up with
This is par for the course with advocates. Claim the high ground over dumb, lazy sceptics when in fact its you that didn’t understand the claim and data.
Richard’s claim was that Sanjay (2020) said there was no warming trend since 1950. He did not say that. He said the opposite, and illustrated it with graphs. Richard doctored those graphs to remove Sanjay’s inconvenient conclusion.
Also untrue. He didn’t say it in so many words, but the graph he included in the paper said it.
The graph showed a warming trend, explicitly, in red. KR erased that bit.
Not since 1950, it didn’t.
Sanjay et al give a table of trends since 1950:
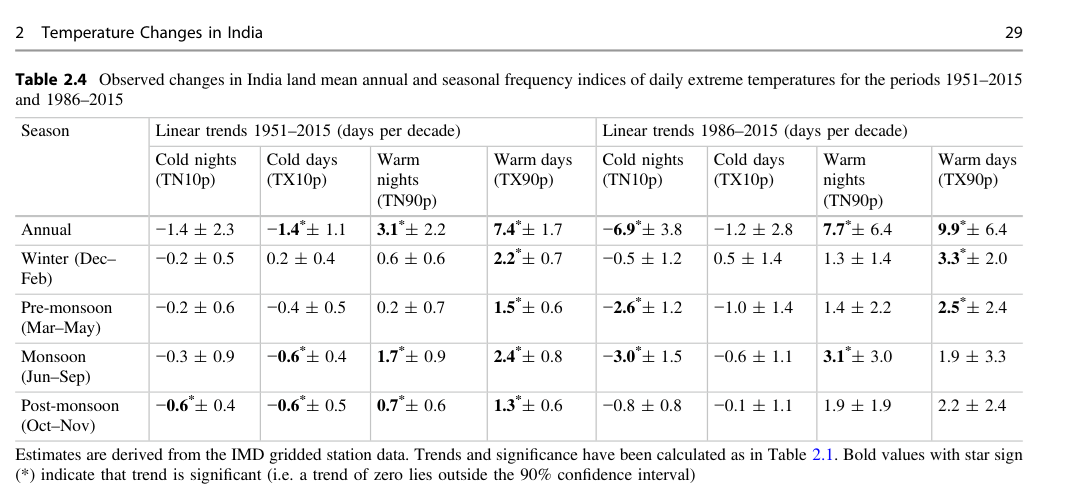
All the cools are trending down. All the warms are trending up. That is what Sanjay is really saying.
They’re not temperature trends, they’re “extreme temperature days” as per the table title.
and in the headings
He also misrepresented the Das paper on greening. What it actually says, right in the abstract, was:
“Abstract
India isthe second-largest contributorto global greening. Despite significant increase in green cover, satellite-based MODIS estimates reveal no significant increase in vegetation productivity,with major forested areas showing declines in net primary productivity (NPP), due towarming.”
What the paper says is that, yes, the leaf area index has greatly increased. But the effect of warming outweighs this to give static or declining productivity. KR doesn’t mention that point.
Overall the paper is about as convincing as Atmospheric changes through 2012 as shown by iteratively homogenized radiosonde temperature and wind data (IUKv2)
From the paper abstract
And my interpretation of that is they’re saying there is a whole lot of greening that is measured but it doesn’t “take account” of the CO2 impact. As if that needs to be individually understood. I wonder why. So they estimate the impact of that CO2 and throw in regional weather too.
And find that indeed, the CO2 is responsible
Because without CO2 the trends would have been smaller. Here is what they did
And if I’m understanding that correctly, they’re subtracting off the effect of the CO2 (and weather) to make an argument of “no significant increase in vegetation productivity“…”due to warming”
Whereas the actual result is
Which is increasing trends.
So one of us is mistaken about the “greening trend” and I dont think its me. They constructed an analysis where they could make the one lone statement in the abstract about productivity by pretending the impact of CO2 (and regional weather which they also use) somehow doesn’t count.
If you feel I’m misinterpreting this, then please let me know your interpretation.
Exactly so!
Here is something Freeman Dyson said. It is at Freeman Dyson Takes on the Climate Establishment – Yale E360
You know where I learned more about climate change than from any climate site? https://www.nature.com/articles/s41598-018-25212-2
The abstract says:
“Agroclimate indicators”. Not SST, not GAT, not Land surface temperature. Climate involves a lot of different things. Greening is one that is ignored by warmists.
KR says
“The authors found the CFE has “nearly doubled” the trend values in net primary production [NPP] across India relative to the trend values when the CFE is not considered.”
He’s being careful but misleading there. Yes, CEE has increased, which is wht you are showing. But because of warming, NPP has actually decreased. Which incidentally doesn’t do much for KR’s claim of no warming.
Here is the Das’ opening statement again:
“Abstract
India isthe second-largest contributorto global greening. Despite significant increase in green cover, satellite-based MODIS estimates reveal no significant increase in vegetation productivity,with major forested areas showing declines in net primary productivity (NPP), due towarming.”
And here is what I said:
“What the paper says is that, yes, the leaf area index has greatly increased. But the effect of warming outweighs this to give static or declining productivity. KR doesn’t mention that point.”
This paper has an agenda to find some reason why CO2 enhanced growth is “bad” and give advocates a quotable statement to refute the fact that CO2 has a massive positive benefit for the planet.
And that makes it about as bad science as the Sherwood paper that desperately looked for the missing tropical hotspot by considering wind rather than the measured temperature from the radiosondes
It’s not good science when you start from a desired result and manipulate the data to find it.
So why are ‘major forested areas’ showing declines in ‘net primary productivity’? Less deforestation? Forests overtaking primary productive land?
I’ll answer for him and if he’s not happy, then he can correct it.
The short answer is they’re not in decline, the trend is increasing “greening” as measured by leaf index.
The argument the paper is making is that if it weren’t for the CO2 fertilisation and was just about the warming (and weather in general) then the areas would be in decline.
Its kinda like saying an area is in flood. Well it would be if it rained more.
Statistics are manipulated to show what you want. If any warming that you are claiming is in the hundredths or thousandths of a degree, then you are sadly mistaken. To be “statistically significant” any change must be greater than the resolution of the measurements. Anything else means you are simply guessing, and guessing is not “statistically significant”!
Jim
Spot on. Claiming statistical significant for a change that, based on the data quality, is not statistically significant is de rigeur for climate science. The desperation to find “warming” where, if there is any, is dubious in magnitude or importance, becomes more evident with each passing year.
The Canadian Arctic has, according to borehole temperature measurements, warmed about 6 degrees C in the past 225 years. The only noticeable effect is larger caribou herds and the northern spread of trees. Nothing wrong with that. 12,000 years ago the northern half of Alberta was locked in permafrost. Now it is covered with endless forests. So much for the “methane bomb”. The appalling history of perfidy in the collection of Canada’s air temperature deserves proper exposure to the cold northern light of a mid-summer’s day.
Yes, skeptics check things, unlike climate alarmists. 🙂
The paper CITED is Environ. Res. Lett. 19 064045, 2024, which found a temperature anomaly of less than 0.02C per year for 20 years, not significant- less than 0.2 C in 20 years. The plots above are more rational showing one degree steps and cover the period 1950-2020. The greening is the size of ‘the Himalayas’; the temperature and precipitation anomalies are ‘molehills’.
India is very humid, this gives no room for CO2 to have any impact.
Easy to answer. It is being counter-balanced by the UK’s and Germany’s giddy ride to reducing emissions as they hurtle towards Net Zero.
And remember Paul Ehrlich’s doom scenario about the subcontinent.
There are so many doom predictions that no one can memorize them.
I guess his original career as Butterfly expert made him believe that every single flap of a Butterfly causes a catastrophe and that’s how he came up with so many apocalyptic prophecies.
And for the money he made by selling millions of books he bought 2 planes.
“It should be noted that India’s annual mean non-warming trend has been ongoing since 1950″
Well, I didn’t think India could get any warmer. But that by itself isn’t a surprise, because hot climates generally don’t get a whole lot warmer, if at all. The warming comes from the high latitudes, particularly in winter, and at night. The warmest climates in the world are places like Singapore, and those are climates that are lush and biologically productive. In the literature, they like to paint a picture where places in the mid-latitudes start suffering 130⁰F afternoons or something.
Maybe it’s time to revisit atmospheric residence time of CO2 used in model projections?
Dr Hermann Harde, German physicist, in 2017 already did it. The IPCC million year nonsense has been completely destroyed. They responded (without a nod to Harde whose paper they forced the publisher to withdraw) with a “5 pulse” sequence which admits the first 50% of CO2 cycles out of the atmosphere comparable to Harde’s 4-5 years but then changes “speed” dramatically,
Harde calculates that a halt in anthropogenic CO2 emissions would require 55 years to cycle out of the ATM – except for minuscule traces..(Scrutinizing the Carbon Cycle and CO2 Residence Time in the Atmosphere, 2017).
Sulpis et al explain that the CO2 entering the oceans quickly dissolve to carbonic acid and equally quick ionizes to harmless bicarbonate for thousands of years before precipitating to limestone (Calcite dissolution kinetics at the sediment-water interface in natural seawater, 2018).
s
“It should be noted that India’s annual mean non-warming trend has been ongoing since 1950 (as shown in Sanjay et al., 2020).”
As so often, a total distortion by Kenneth Richard. The Sanjay paper begins:
Plus the inevitable doctored graphs. Sanjay’s paper showed:
Richard has erased the trend line and trend value.
“since 1986”
That’s the great thing about cherry picking- it works both ways.
Just like Nick and his pals
So Nick’s pals are the guys who wrote the study being used here to (ludicrously) claim that India has not warmed?
It hasn’t warmed, according to the graphs shown, since 1950 – from the article above :It should be noted that India’s annual mean non-warming trend has been ongoing since 1950. So, adding it up since 1950… 1950 to 1986 cooling(you can add a trend line to the chart if you want), 1986 until now warming. I’ve no idea what it will do in another 40 years. Besides, the article was about greening affects of CO2
Their data ends in 2015, but the subcontinent has almost certainly warmed further since then. 2024 was the hottest year on record there.
The peak of a strong El Nino.. Much cooler now.
I see you continue to emphasize short term variability as though it were meaningful.
Please show that 1986 – 2015 is not short term.
Citing a single year (2024) is the epitome of short-term variability.
I cited it mainly to show that India had warmed beyond 2015.
Your lack of cognitive ability to recognize that you are choosing TWO individual points to compare and make a conclusion from is amazing.
One of the points being the warmest year on record, which is not something you’d typically see without an ongoing trend. But I digress…
If you’d like to see the extended time series beyond what the study provided, scroll down. Two users have shared it, and it shows clear warming since then.
Note that India is not showing uniform warming as is predicted by the CO2 hypothesis. Rather, the heat is clearly correlated with urbanization as shown in a SciTech Daily article [ https://scitechdaily.com/extreme-indian-heat-wave-nasas-ecostress-detects-blistering-heat-islands/ ] :
I would appreciate knowing why some anonymous person gave me a down-vote for an excellent illustration that demonstrates clearly that all the mid-range and high temperatures show the influence of landuse changes by humans. Do you have an aversion to evidence that doesn’t agree with how the world is?
An odd complaint, since that is exactly what you are doing.
The argument is (strangely) whether there has been net warming in the last 75 years. Answer – no.
The study’s authors also chose to emphasize the warming since 1986, which they clearly consider important.
If that warming trend continues, then using the same data at a later point, the ‘no net warming over the past 75 years’ claim will inevitably turn into a warming trend.
There’s also Anthony Banton’s post below, which presents India Meteorological Department data showing clear warming over the past 75 years.
Is 40 years shorter or longer than 80 years?
Funny how climate alarmists ignore all of the long term records. By long term I’m talking 100’s to thousands of years.
” By long term I’m talking 100’s to thousands of years.”
Incredible.
It’s climate scientsts that went out and investigated data for those self same records’ of “100’s to thousands of years”.
So they do that and “ignor” them !?
Fungle missed the “CO2 caused” ;-)…. COOLING from 1960-1980..
…the period of the “new ice age” scare.
No that was caused by increased aerosls during the ramp-up of industry following WW2, with subsequent warmng as global clean-air acts came into being.
So insolation reaching the surface is the reason for cooler temperatures in that period. CO2 played had nothing to do with it.
However, cleaning up aerosols so more insolation reached the surface didn’t cause warming, CO2 did, right?
Logic is not Bunter’s strong suit.
No my “logic” is fine cat.
It’s yours and Jimbo’s comprehension of what I said that is at fault!
Explain how you resolve the logical contradiction identified by Jim Gorman (cooling 1940-1980 due to reduced insolation from aerosols, warming from 1980 now due to CO2 rather than increased insolation after cleanup).
Don’t worry, take your time.
Then respond to Jim’s comment and show how and where he is wrong!
Posted in error
Earth’s temperature trends are determined by net radiative forcing, which includes both GHG forcing and aerosol forcing.
During 1960-1980 (period with high aerosol concentrations), their cooling effect was strong enough to temporarily offset the warming effect of CO2 and other GHGs.
But, as aerosols were reduced or cleaned from the atmosphere, the warming influence of GHGs became dominant again.
That is simply not true.
I have been wrestling with this since I got my new weather station. Here are two screenshots showing insolation and temperature. You can see that insolation is basically a sine wave from 0 to π and the max occurs at 12:29 pm. Then look at the temperature graph, it doesn’t get to max until 3:29 pm. That is a 3 hour delay. Sometimes the delay is less, even down to 1 hour, but it never proceeds or follows within minutes of the insolation.
If radiative forcing were the only forcing going on, you would see a black body response. That is an immediate response to increased upward radiation. Since that isn’t happening, there is another process taking place
I don’t have soil temperature gauges, but that may be one culprit. Another may be that the mass and specific heat of CO2 may not be large enough to intercept sufficient radiation to warm the rest of the atmosphere very quickly. Hooray for gradients that climate science ignores for averages.
Then explain how the warming in India, as shown in the thermal imagery I supplied above, is resulting in urban land cover showing strong warming despite the aerosols and CO2 being well mixed above the ground?
https://wattsupwiththat.com/2026/01/31/new-study-affirms-rising-co2s-greening-impact-across-india-a-region-with-no-net-warming-in-75-years/#comment-4161341
“So insolation reaching the surface is the reason for cooler temperatures in that period. CO2 played had nothing to do with it.”
No insolation NOT reaching the surface is the reason for cooler temperatures in that period.
“However, cleaning up aerosols so more insolation reached the surface didn’t cause warming, CO2 did, right?”
No it did cause it to warm.
I said …
“with subsequent warmng as global clean-air acts came into being.”
[ adjective
coming after something in time; following.]
Well done – You have exactly about face !
There were both +ve and -ve drivers (both man made
(I posted this few days ago)
Look at the black line.
It shows that total radiative forcing changes stayed just about static from the 30’s up to about the 1970 as post WW2 industry ramped-up and aerosols built up – then Pinatubo in ’91 with warming evident from ~ 1980.
If you haven’t seen this: https://wattsupwiththat.com/2016/02/26/analysis-of-the-relationship-between-land-air-temperatures-and-atmospheric-carbon-dioxide-concentrations/ , please take a look at it, paying particular attention to Fig. 4, which shows the correlation between population and temperatures. Correlation doesn’t establish cause and effect.
Which reinforces the fact that torturing the data to show trends in 30 years is…well torture. 100 year climate cycles would help but 1000 year cycles would be better.
0.15C/decade * 1000 years would be 15C. No one could claim it did not happen. I don’t trust the data before 1990 to do math that gets to .01C/decade or .001C/year.
That’s what those red lines on the graph are claiming: Thousandths of one degree measured accurately.
Statisticians will tell you that the more data you have the smaller and smaller is the SEM. Well the SEM only provides an interval where the mean may lay. It DOES NOT allow one to extend the resolution of the actual measurements.
If resolution is only 0.1, then an SEM of 0.001 is not applicable to the making value of the mean 0.101. Nor does it make the uncertainty ±0.001. The value of the mean remains at 0.1.
These are all statistical artifacts that warmists cling to. It is why you never see these anomalies appended to an absolute temperature value. It would kill too many people from laughing themselves to death.
0.015C per year
0.15C per ten years
1.5C per 100 years
15C per 1000 years
(Just a math check on a comment I wrote quickly. Okay got the math right, but should have added “in a thousand years” to the first sentence to remove doubt)
Between 950 CE and 1250 CE
Medieval India
The Medieval Warm Period (MWP) in India is a significant climatic event that occurred between 950 CE and 1250 CE, characterized by warmer temperatures and increased monsoon precipitation. This period was marked by a diversification of crop assemblages, indicating a warm and humid climate that supported agricultural growth.
The MWP had a profound impact on the agricultural practices and human societies in India, leading to the development of new crops and agricultural techniques that were suited to the warmer climate.
The MWP was followed by a regionally cooler period known as the Little Ice Age (LIA)
LIA brought about severe droughts in some parts of India, particularly affecting the Mughal Empire. Historical accounts indicate that during the reigns of emperors Akbar and Shah Jahan, the country faced devastating famines due to prolonged drought conditions.
For instance, Gujarat and the Deccan region experienced significant famines in the late 16th and early 17th centuries, leading to widespread suffering and economic decline
Warm period = GOOD…. Cold period= not so much !!
You missed otf this bit from the AI answer ….
If that was an initial AI response, then it should be discounted as unreliable. It has been my experience that, when challenged, the AI ‘bots will apologize profusely and admit to misstating the facts. It takes someone knowledgeable enough to challenge the ‘boiler plate’ to be able to extract the truth from the AI ‘bot.
You can’t look to history to determine temperature. (/sarc) A holistic very of climate is not allowed. History can’t provide the “data” that proxies like tree rings do. Melting glaciers don’t reveal anything to do about temperature.
Apparently, the definition of cherry picking is using any series that doesn’t prove that CO2 is going to kill us all.
I learned that in business ages ago. Linear trend lines of a phenomena that has periodic components is a joke. My bosses would have fired me. Your breaking the series into smaller segments is just the start of what is necessary.
Quote to help see JG’s pun “just the start of what is necessary“:
“Integral calculus calculates the exact area under a curve by dividing it into infinitely many, infinitely thin rectangles (Riemann sums) and summing their areas.”
1986 is the start date used by the study being sited, so…?
Data to 2015 shows no net warming in maximums since 1920.
A bit of urban warming since 1970 is the minimums.
Bnice reaches for the John Daly playbook: stretch the y-axis until the trend gets obscured. Rates might differ, but max, min, and average are all still warming.
Y-axis is extended as far as needed to so min and max can fit on the same graph.
Shows just how small any relative changes are.
Seems to me T Min has been hovering around 17 degrees since your father’s father’s father was a boy. Scary stuff! Someone call the cops!
As opposed to the AGW playbook that plots the anomaly with a zoomed x-axis and compressed y-axis to exaggerate the warming?
If the warming was plotted as a true (areally averaged) global temperature proportionally to the timescale, nobody could even see it, let alone see it as an “existential danger”.
Showing temperatures is not an unreasonable method of showing the GROWTH in temperature even if you dislike it.
Showing anomalies with a hundredths or thousandth value, which is far beyond measured resolution, on an expanded scale can be argued as propaganda.
And for those who don’t think population increase in India is a “thing”…
… it has gone up by about a FACTOR OF 5 since 1950
And?
But Tmin is still colder than in 1950-1960..
Tmax, Tavg about the same..
NO NET WARMING IN 75 YEARS.
Exactly as stated. !
And that is with extensive urban development
I remember seeing some Landsat thermal imagery of India that showed that the hottest surface temperatures were associated with urban features.
See above at https://wattsupwiththat.com/2026/01/31/new-study-affirms-rising-co2s-greening-impact-across-india-a-region-with-no-net-warming-in-75-years/#comment-4161341
Idiot #3
Nick writes
Richard’s claim was “since 1950” so the trend line wasn’t relevant. Its uncharacteristic of you to miss a (seemingly) factual claim.
Because
Is incorrect in this case.
He claimed the graphs came from Sanjay 2020. But he hacked them to erase the point that Sanjay was making, without telling us. That is a distortion, but also thoroughly dishonest.
The lead distortion was the claim that
“It should be noted that India’s annual mean non-warming trend has been ongoing since 1950 (as shown in Sanjay et al., 2020).”
Sanjay et al didn’t show that. They showed that there had been a warming trend. KR may have deduced it from the hacked graphs that he showed, but it is his claim, not Sanjay’s. And unlike Sanjay, he gives no calculation.
The point being that a cherry picked subset of the temperatures show warming but overall from the data graphed, there is no warming?
One can equally argue that Sanjay was the one who dishonestly distorted what the data was telling us with the trend line.
+100
Mr. Stokes: After reviewing the article and comments, it is clear Mr. Sanjay violated the first rule of CliSci- Don’t show contrary data. While you argue about what Sanjay siad v. what Richards says Sanjay says, the chart itself does all the talking. If Sanjay used “data” to create the chart, the data shows what it shows from the left side of the chart to the right, right? Is the charted data less reliable before 1986? A chart maker like yourself might wonder why 1986 was picked for Sanjay’s edits that Richards removed, but your comments don’t reflect that. You prefer to argue about what one said the other said, and blind yourselves to the left side of this chart.
It’s up to you and the other CliSci defenders to tell Mr. Sanjay to trim down that chart, it’s just feeding those sceptics!
Richard also erased the negative trend line from the beginning of the chart to 1980. Oh wait, the study didn’t provide that trend line, even though it is clearly relevant.
Richard was talking about the trend since 1950, you mention the trend since 1980, two completely different things.
Greening may be due to CO2.
But it may be because we have invented fertilisers.
Either way, we’re doing OK.
The NASA study that characterized the change in LAI (greening) did not restrict itself to agricultural land that might have been fertilized.
Greening is limited by the least available nutrient. Fertilizer may help in a situation but is not a panacea. CO2 has a role to as does moisture, and sunlight.
From the link provided in the text to the actual study’s very first point (published six-years ago) in its “Key Messages
I mean, it’s right there in front of you to check for yourselves.
Did any of you check?
Of course not!
You’re all too busy being ‘skeptics’ to check stuff for yourselves.
They’re too scared of reality, lol.
The whole premise is crap
Idiot #2
Idiot #1
Argue “bigger picture” by all means. But when you argue against fact, you kinda look foolish.
Study is TOTALLY CORRECT in that it says NO NET WARMING IN 75 YEARS
2015-75=1986 who knew
Richard: “No Net Warming In 75 Years”
Nail: “during 1986–2015”
1986 + 75 years = 2061
2061 – 2026 = 35 years in the future.
Waste of pixels on my screen.
Lol. Your powers of comprehension are still on vacation. Maybe they have permanently moved out?
Were those temperatures measured at that resolution? I sincerely doubt that that they were considering USCRN has an uncertainy of ±0.3°C and a resolution of 0.1°C.
Let’s see, that would make your range [-0.2°C to +0.5°C]. 0.15°C is hardly statistically significant since true value could be anywhere in that range. In fact, if stations equivalent to U.S. ASOS stations, the range of possible values is at least twice as large.
Mr. Nail: The author demonstrates what the study SHOWED, rather than getting thrown off course by what you say was said. Can you possibly hold two thoughts (graph shows from ’86; also shows from ’50) in there?
The question that isn’t asked, let alone get answered, is “Is the warming from CO2, or from urbanization resulting from the 5-fold increase in population in India?
The thermal imagery that I supplied makes a strong case for temperature being driven by urbanization, but does nothing to support the idea of well-mixed CO2 (or aerosols) having any impact.
https://wattsupwiththat.com/2026/01/31/new-study-affirms-rising-co2s-greening-impact-across-india-a-region-with-no-net-warming-in-75-years/#comment-4161341
Really HOT in India in the 1930’s
Yes, it was just as warm in the 1930’s as it is today.
And as of today, the temperature is about 0.5C cooler than the high point of the 1930’s.
There is much more CO2 in the air today than there was in the 1930’s, yet it is no warmer today than it was then. Therefore, CO2 amounts have had no measurable effects on the temperatures of the Earth’s atmosphere.
This is the reason Climate Alarmists go to so much trouble to distort the historical temperature record, because it does not support their CO2 Alarmism. It does not support the claim that today is the hottest time in human history, and it is all caused by CO2. There is no evidence supporting this. And the written, historical temperature records directly dispute these claims of unprecedented heat today.
Climate Alarmists are not operating on the facts. They have no facts to operate on.
“Yes, it was just as warm in the 1930’s as it is today.”
Yes, of course it is Tom.
After all, that’s obvious from this graph (sarc)
“Climate Alarmists are not operating on the facts. They have no facts to operate on.”
You come out with the nonsense at the top.
And say that?
The alternative Universe of this place in all it’s magnificence.
This is just more non-temperature holistic history. (/sarc)
Well, there has been warming since the 1960s, which isn’t surprising, given that the entire planet has been warming since roughly the end of the Little Ice Age. And this warming isn’t alarming at all. There can also be periods of cooling or temperature stagnation, as we can clearly see on this graph. Now, the main focus of this article is on the greening, which is undeniable, observed, and quantified. And while temperatures have generally increased since the 1980s (which, until now, represents a 45-year period usable for climatological studies), it’s also since then that we’ve observed widespread greening, which doesn’t exactly paint a picture conducive to alarmism. We undoubtedly benefit from being accurate with the facts, from every point of view.
“It should be noted that India’s annual mean non-warming trend has been ongoing since 1950 (as shown in Sanjay et al., 2020).”
This is where the confusion lies.
It’s clear that the authors of the article support the hypothesis of CO2 warming, but they also reveal the inconsistency of trends in the different regions of India, with some areas cooling and some areas warming over the same period.
The attached graph from the PDF (after clicking on Sanjay et al) shows a reconstruction of late summer temperatures from Sikkim during the period 1705-2008.
The blue line indicates low-frequency variations at the decadal scale. Green- and red-dotted lines indicate a trend for full reconstructed period and for the period 1850–2008 C.E., respectively (Borgaonkar et al. 2018).
However, if one were to choose a starting point of 1825 and an end point of 2008, then the graph shows a very significant cooling trend of around 1.8 degrees C.
However, Sikkim is the least populous and second-smallest among the Indian states. Situated in the Eastern Himalaya, Sikkim is notable for its biodiversity, including alpine and subtropical climates, as well as being a host to Kangchenjunga, the highest peak in India and third-highest on Earth.
Looks like the warmest period in the last century was around 1960, around 1C warmer than 2000
This graph is from the Indian Meteorological Department (IMD).
So we see that extending the graph back past the 1950’s shows that steady warming occurred the start of the 1900’s.
Cue the evidence free “it’s all due to UHI” from the usual suspect.
May I add that there is UHi heating in the cities/conurbations.
But it is not the entirety of continental Indian warming …..
https://www.nature.com/articles/s44284-024-00074-0#Sec1
“Cities are vulnerable to the compounding effects of both climate change and urbanization. Here we show that urbanization alone has led to an overall 60% enhancement in warming in Indian cities”
“The urbanization-driven warming (the urban effect) for each city is presented in Fig. 1b. The mean urban effect for all these cities across India was found to be 0.2 ± 0.15 °C per decade. This leads to an estimate of ~37.73% of the total urban warming being linked to urbanization—that is, ~60% enhancement of warming relative to the surrounding non-urban areas”
We assume that the observed annual warming trend over the surrounding non-urban/rural region is primarily due to large-scale regional climate change, and the same for the urban region is due to the combined effect of warming driven by both regional climate change and local-scale changes due to urbanization.
India temperature data showing how little change there has been.
No warming until around 1980 and a MASSIVE population increase in the WHOLE country + a MASSIVE increase in air-conditioning and energy usage.
And anyone that think rural areas in India haven’t had considerable population increase is totally deranged. !!
Nothing left for CO2.
I downloaded the data from your link. The attached image of the annual temperature time series shows a clear change in trend around 1985, with the warming rate nearly tripling compared to the 1901 – 2021 trend.
1985–2021: 1.8°C/ century
1901–2021: 0.6°C/ century
Looking at March–May specifically, the warming rate from 1985 to the present is 2.0°C/century. Particularly worrying, since March – May in India is basically a sauna, and it’s already brutally uncomfortable.
What increased the Tavg that you show? Tmax or Tmin? What attribution does each have toward the Tavg.
Has been shown to be mainly in the Tmin.. (see further up)
MASSIVE URBAN EXPANSION and DENSIFICATION. !
Not to mention the MASSIVE advent of air-conditioners.
I’m actually amazed there hasn’t been far more measured warming
Most people cannot even sense a 1C difference anyway, certainly not in over 100 years.
Typical alarmist graph , extent the Y-axis so you can’t see just how small the change is relative to actual temperatures.
This graph is far more instructive and shows how small the change really is relative to range in India…especially considering how much urban expansion there has been.
Also shows most warming is in Tmin.
Yeah I see Eld never answered my question.
Good ol’ nicely.
Was no need for the invite, doesn’t even see the irony.
His constant vigilance over a screen has him respond with the usual ad nauseum in a flash.
Look at your post again.
Somehow the MINIMUM temperatures were the focus of this. Are you frightened that rising minimum temperatures are an existential threat to the earth?
But it’s the wrong sort of greening, and the wrong sort of not-warming which is just more evidence of climate change – worse than we thought.
The photo of India is not an Earth-India, Maybe Pandora-India.
I did not bother to read any farther.