Bill Cahill, managing director of First Bus London, said his firm was committed to hitting the mayor’s challenging target but said it involved far more than simply buying new buses.
More than 2,600 of 9,000 buses in the capital are now “zero emission” – almost 30 per cent – but Transport for London says it will take until 2034 to convert the entire fleet without Government funding. … In an interview with The Standard, Mr Cahill said: “It’s not just about buying buses, it’s about electrifying the depots – and electrifying the depots will become progressively more difficult.
I hear more oil will be coming to the market. London once had a deal for Venezuelan oil through former far left Mayor Ken Livingstone and Transport for London, Courtesy of Hugo Chavez
Chinese-made electric buses are rapidly gaining ground across Southeast Asia as governments push to decarbonize public transport and Chinese manufacturers seek growth beyond a slowing home market, according to Nikkei Asia.
Thank you.
I wonder how many acres 81M buses would require? Can we assume 1 foot of clearance all around? How many Olympic size swimming pools is that?
BATTERY SYSTEM CAPITAL COSTS, OPERATING COSTS, ENERGY LOSSES, AND AGING https://www.windtaskforce.org/profiles/blogs/battery-system-capital…
by Willem Post
. This article shows, fires or not, battery systems to absorb midday solar and release it during evening peak hours, are absolutely not the way to store large quantities of electricity. At 40% annual average throughput, nearly impossible to achieve, the cost would be 38.1 c/kWh.
.
If we used wind, we would be dependent on Europe
If we used solar, we would be dependent on China
We would be screwed up and down and sideways with high cost/kWh energy
We would be totally uncompetitive on domestic and world markets
No energy dominance ever!! . Utility-scale, battery system pricing usually not made public, but for this system it was.
Neoen, in western Australia, turned on its 219 MW/ 877 MWh Tesla Megapack battery, the largest in western Australia.
Ultimately, a 560 MW/2,240 MWh battery system, $1,100,000,000/2,240,000 kWh = $491/kWh, delivered as AC, late 2024 pricing. Smaller capacity systems cost much more than $500/kWh
. Annual Cost of Megapack Battery Systems; 2023 pricing
Assume 45.3 MW/181.9 MWh; turnkey cost $104.5 million; 104,500,000/181,900 = $574/kWh, per Example 2
.
Amortize bank loan, 50% of $104.5 million, at 6.5%/y for 15 years, $5.484 million/y
Pay Owner return, 50% of $104.5 million, at 10%/y for 15 years, $6.765 million/y (10% due to high inflation) Lifetime (Bank + Owner) payments 15 x (5.484 + 6.765) = $183.7 million
.
Assume battery daily usage, 15 years at 10%; loss factor = 1 / (0.9 *0.9)
Battery lifetime output = 15 y x 365 d/y x 181.9 MWh x 0.1, usage x 1000 kWh/MWh = 99,590,250 kWh to HV grid; 122,950,926 kWh from HV grid; 233,606,676 kWh loss
(Bank + Owner) payments, $183.7 million / 99,590,250 kWh = 184.5 c/kWh
Less 50% subsidies (tax credits, 5-y depreciation, loan interest deduction, etc.) is 92.3c/kWh Subsidies shift costs from project Owners to ratepayers, taxpayers, government debt. . Excluded costs/kWh: 1) O&M; 2) system aging, 1.5%/y, 3) loss factor 1 / (0.9*0.9), HV grid-to-HV grid, 4) grid extension/reinforcement to connect battery systems, 5) downtime of parts of the system, 6) decommissioning in year 15, i.e., disassembly, reprocessing, storing at hazardous waste sites. Excluded costs would add at least 15 c/kWh
. COMMENTS ON CALCULATION
Almost all existing battery systems operate at less than 10%, see top URL, i.e., new systems would operate at about 92.4 + 15 = 107.4 c/kWh. They are used to stabilize the grid, i.e., frequency control and counteracting up/down W/S outputs. If 40% throughput, 23.1 + 15 = 38.1 c/kWh.
That is on top of the cost/kWh of the electricity taken from the HV grid to charge the batteries
.
Up to 40% could occur by absorbing midday solar peaks and discharging during late-afternoon/early-evening, in sunny California and other such states. The more solar systems, the greater the midday peaks.
See top URL for Megapacks required for a one-day wind lull in New England
.
40% throughput is close to Tesla’s recommendation of 60% maximum throughput, i.e., not charge above 80% and not discharge below 20%, to perform 24/7/365 service for 15 y, with normal aging. Owners of battery systems with fires, likely charged above 80% and discharged below 20% to maximize profits. Tesla’s recommendation was not heeded by the Owners of the Hornsdale Power Reserve in Australia. They excessively charged/discharged the system. After a few years, they added Megapacks to offset rapid aging of the original system, and added more Megapacks to increase the rating of the expanded system. http://www.windtaskforce.org/profiles/blogs/the-hornsdale-power-reserve-largest-battery-system-in-australia
.
Regarding any project, Banks and Owners have to be paid, no matter what. I amortized the Bank loan and Owner’s investment
Divide total payments over 15 years by the throughput during 15 years, to get c/kWh, as shown. . Loss factor = 1 / (0.9 *0.9), from HV grid to 1) step-down transformer, 2) front-end power electronics, 3) into battery, 4) out of battery, 5) back-end power electronics, 6) step-up transformer, to HV grid, i.e., draw about 50 units from HV grid to deliver about 40 units to HV grid. That gets worse with aging.
.
A lot of people do not like these c/kWh numbers, because they have been misled by self-serving folks, that “battery Nirvana is just around the corner”.
. NOTE:EV battery packs cost about $135/kWh, before it is installed in the car. Such packs are good for 6 to 8 years, used about 2 h/d, at an average speed of 30 mph. Utility battery systems are used 24/7/365 for 15 years .
EUROPE AIMS TO WEAKEN THE US WITH EXPENSIVE OFFSHORE WINDMILLS THAT PRODUCE EXPENSIVE, LOW-QUALITY ELECTRICITY https://www.windtaskforce.org/profiles/blogs/europe-attempts-to-entangle-us-with-expensive-offshore-windmills
By Willem Post
.
If we used wind, we would be dependent on Europe
If we used solar, we would be dependent on China
We would be screwed up and down and sideways with high cost/kWh energy
We would be totally uncompetitive on domestic and world markets
No energy dominance ever!!
.
Net zero by 2050 Euro elites tried to weaken the US, with help of the unpatriotic, leftist Biden clique, into going down the black hole of 30,000 MW by 2030 of expensive, highly-subsidized, weather-dependent, grid-disturbing offshore windmill systems, which would need expensive, highly subsidized, short-lived, battery systems for grid support.
.
Offshore wind full cost of electricity FCOE = 30 c/kWh + 11 c/kWh = 41 c/kWh, no subsidies
Offshore wind full cost of electricity FCOE = 15 c/kWh + 11 c/kWh = 26 c/kWh, 50% subsidies
The 11 c/kWh is for various measures required by wind and solar. Power plant to landfill cost basis.
This compares with 7 c/kWh + 3 c/kWh = 10 c/kWh from existing gas, coal, nuclear, large reservoir hydro plants.
.
Such expensive W/S electricity would have made the US even less competitive in world markets.
Any US tariffs on the European supply of wind systems would greatly increase their turnkey capital costs/MW and their electricity costs/ kWh.
.
Almost the entire supply of the wind projects would be:
1) designed and made in Europe,
2) then transported across the Atlantic Ocean by European specialized ships,
3) then unloaded at new, taxpayer-financed, $500-million storage/pre-assembly/staging/barge-loading areas,
4) then barged to European specialized erection ships for erection of the windmill systems.
5) The financing would be mostly by European pension funds, that pay benefits to European retirees.
.
Hundreds of people in each seashore state would have jobs during the erection phase
The other erection jobs would be by specialized European people, mostly on cranes and ships
Hundreds of people in each seashore state would have long-term O&M jobs, using mostly European spare parts, during the 20-y electricity production phase.
.
Conglomerates owned by Euro elites would finance, build, erect, own and operate almost all of the 30,000 MW of offshore windmills, providing work for many thousands of European workers for decades, and multi-$billion profits each year.
.
That Euro offshore wind ruse did not work out, because Trump was elected.
Trump-hating, Euro elites are furious. Projects are being cancelled. The European windmill industry is in shambles, with multi-$billion annual losses, lay-offs and tens of $billions of stranded costs.
.
Trump spared the US from the W/S evils inflicted by the leftist, woke Democrat cabal, that used an autopen for Biden signatures, and bypassed on-the-beach/in-the-basement Biden, an increasingly dysfunctional Marionette.
.
Trump declared a National Energy Emergency, and put W/S/B systems at the bottom of the list, and suspended their licenses to put their rushed, glossy environmental impact statements, EIS, under proper scrutiny.
.
Euro elites used the IPCC-invented, “CO2-is-evil” hoax, based on its own “science”.
These elites used:
.
1) the foghorn of government-subsidized Corporate Media to propagate scare-mongering slogans and brainwash the people,
2) censorship to suppress free thinking on town hall forums,
3) election interference, as in Moldova and Georgia,
4) ostracizing /marginalizing major political parties to produce desired outcomes, as in Germany.
.
Wall Street elites saw an opportunity for tax shelters for its elite clients.
Woke politicians/bureaucrats were “cut-in” on $juicy deals to pass subsidies, favorable rules and regulations, and impose government mandates.
Euro elites wanted the US to deliver electricity to users at very high c/kWh, to preserve Europe’s extremely advantageous trade balance with the US. https://www.windtaskforce.org/profiles/blogs/international-trade-is-a-dog-eat-dog-business
“Coal fired power remains the largest dispatchable source worldwide to 2035 with capacity set to peak at c. 2500GW.”
“Coal fired generation in S E Asia is projected to continue to rise through to 2040”
“Natural gas fired capacity also sees robust growth and overtakes coal”
“Oil demand in India is the largest of any country to 2035 and continues to rise to 2050”
Oil, coal and natural gas still dominate each providing over 150EJ of global energy demand with oil almost at 200EJ and coal c. 180EJ. Unreliables around 80EJ
NEW MINE-MOUTH COAL ELECTRICITY LESS COSTLY, AVAILABLE NOW, NOT PIE IN THE SKY, LIKE EXPENSIVE FUSION AND SMALL MODULAR NUCLEAR https://www.windtaskforce.org/profiles/blogs/coal-electricity-less-costly-available-now-not-pie-in-the-sky
By Willem Post
.
If we used wind, we would be dependent on Europe
If we used solar, we would be dependent on China
We would be screwed up and down and sideways with high cost/kWh energy
We would be totally uncompetitive on domestic and world markets
No energy dominance ever!!
.
It is very easy for coal to compete with wind and solar
In the US, Utilities are forced to buy offshore wind electricity for about 15 cents/kWh.
That price would have been 30 cents/kWh, if no 50% subsidies.
.
Offshore wind full cost of electricity FCOE = 30 c/kWh + 11 c/kWh = 41 c/kWh, no subsidies
Offshore wind full cost of electricity FCOE = 15 c/kWh + 11 c/kWh = 26 c/kWh, 50% subsidies
The 11 c/kWh is for various measures required by wind and solar; power plant-to-landfill cost basis.
This compares with 7 c/kWh + 3 c/kWh = 10 c/kWh from existing gas, coal, nuclear, large reservoir hydro plants.
.
Coal gets very little direct subsidies in the US.
Here is an example of the lifetime cost of a coal plant.
The key is running steadily at 90% output for 50 years, on average
.
Assume mine-mouth coal plant in Wyoming; 1800 MW (three x 600 MW); turnkey-cost $10 b; life 50 y; CF 0.9; no direct subsidies.
Payments to bank, $5 b at 6% for 50 y; $316 million/y x 50 = $15.8 b
Payments to Owner, $5 b at 10% for 50 y; $504 million/y x 50 = $21.2 b
Lifetime production, base-loaded, 1800 x 8766 x 0.9 x 50 = 710,046,000 MWh
.
Wyoming coal, low-sulfur, no CO2 scrubbers needed, at mine-mouth $15/US ton, 8600 Btu/lb, plant efficiency 40%, Btu/ton = 2000 x 8600 = 17.2 million
Lifetime coal use = 710,046,000,000 kWh/y x (3412 Btu/kWh/0.4)/17,200,000 Btu/US ton = 353 million US ton
Lifetime coal cost = $5.3 billion
.
The Owner can deduct interest on borrowed money, and can depreciate the entire plant over 50 y, or less, which helps him achieve his 10% return on investment.
Those are general government subsidies, indirectly charged to taxpayers and/or added to government debt. . Other costs:
Fixed O&M (labor, maintenance, insurance, taxes, land lease)
Variable O&M (water, chemicals, lubricants, waste disposal)
Fixed + Variable, newer plants 2 c/kWh, older plants up to 4 c/kWh
. Year 1 Cost
O&M = $0.02/kWh x 710,046,000 MWh/50 y x 1000 kWh/MWh = $0.284 b
Coal= $15/US ton x 353 million US ton/50 y = 0.106 b
Bank/Owner = (15.8, Bank + 21.2, Owner)/50 y= 0.740 b
Total = 1.130 b
Revenue = $0.08/kWh x 710,046,000 MWh/50 x 1000 kWh/MWh = $1.136 b Total revenue equals total cost at about 8 c/kWh Banks and Owners get 0.74/1.136 = 65% of the project revenues
For lower electricity cost/kWh, borrow more money, say 70%
Traditional Nuclear has similar economics; life 60 to 80 y; CF 0.9 in the US. . For perspective, China used 2204.62/2000 x 4300 = 4740 million US ton in 2024.
China and Germany have multiple ultra-super-critical, USC, coal plants with efficiencies of 45% (LHV), 42% (HHV) https://www.sciencedirect.com/topics/engineering/ultrasupercritical-plant
Beware of claims from Communist China – some sources indicate it is building coal-fired generating plants.
(I suspect it needs much more electricity because population wants to live better and manufacturing plants need power.)
If any transport can use EVs. it’s the busses. They have known routes, aren’t used on impulse and can have scheduled recharging times apart of a fleet.
Having said that, I think trolley busses with an emergency battery to get round unexpected obstacles make more sense. Batteries are generally inefficient and have a short life.
And trolley busses are cheaper to build than trams as they don’t use rails.
I am not a meteorologist. I am an engineer by training.
So when the “climate” movement began gaining traction, spreading the expectation of “warming” due to emissions of CO2, something told me, “That can’t be right.”
One of the contradictions of the narrative was about water vapor feedback, proposed as an amplifier to the direct radiative effect of rising concentrations of CO2. But we had learned about the latent heat of water vapor, and more generally, the operation of vapor-cycle heat engines. Notably, the Rankine cycle implemented in condensing steam engines and steam turbines.
The central point for today is that the latent energy in the atmosphere at 1 inch of precipitable water is about 17,600 Watt-hours per square meter. One inch of PW is the same as 25.4 kg per square meter. Another way to express the significance of the latent energy of water vapor is that therefore the intensity of conversion to internal energy in a one-inch-per-hour rainfall event is 17,600 Watts per square meter.
So for the effectiveness of energy transport from the tropics to the poles, and from low altitude to high, the boost from additional water vapor is massive. If a 1 °C increase in air temperature involves a 7% increase in saturation vapor pressure, then do the math. A 7% increase at about 25 kg per square meter is about 1,200 Watt-hours per square meter of improved energy transport.
Was there ever a good scientific reason, from fundamental energy considerations, to expect the climate system to be perceptibly influenced from emissions of CO2, due to the single-digit-Watts per square meter static radiative effect? No. That can’t be right.
This reminds me about Pat Frank’s successful emulation of CMIP5 air temperature projections in his 2019 paper, “Propagation of Error…”. His demonstration that a simplified computation from incremental “forcings” matched the model outputs was a real eye-opener for me. The “climate” “modeling” has been an inherently circular exercise all along.
Data matching algorithms trained on past data are *TERRIBLE* predictors of the future – for everything and anything. And I’ve yet to see climate science come up with a true functional relationship for future climate – they can’t even get the models to agree – but say that the average of multiple wrong models is somehow “right”.
Assuming that even one model in an ensemble is close to being accurate, there can still only be one best result. Each and every one of the inferior models that are averaged dilutes the accuracy of the average rather than improves it. The only way that averaging all the runs together can improve the accuracy is if the distribution is symmetrical about the true value. Any skewness decreases the accuracy. Yet, I have never seen anyone make the case that ensembles have a normal distribution or regression about the mean. It is an unstated, and unexamined, assumption. All the results from an ensemble could have poor skill in predicting the future and the fact that the ensemble mean tends to run warm strongly suggests that the distribution is skewed and many, if not most, are inaccurate.
It is not and never was about climate change. It is and always was about control and wealth redistribution. Facts are a weak tool against willful ignorance and ulterior motive.
Ah, there you are, Tim. Let’s see where we left your physics lesson.
You said:
“EM field strength is like pressure”
“Radiation is *NOT* radiant flux”
“Radiation is a FLUX”
I asked you many times to explain why you contradicted yourself, but you totally “whiffed” on that, didn’t you? So, to try to answer that for you, let’s just take a closer look at the description in the libretexts text that you linked. And from it, I think we can finally discern what is causing your confusion. It is all about that word “flux”, which, as others smarter than me have pointed out, was an extremely poor word choice. (I don’t think that it was originally from Maxwell, Boltzmann, or Planck, but perhaps it was. And up until now, I had been accepting Willis’s equivalence of “flux” with “power”, but not surprisingly, that turns out to be wrong, as with practically everything else he’s said on this subject, so henceforth I will not be using that particular definition any longer myself.)
In any case, regardless of who invented it, we can see from your own text that “flux” is not in fact defined as a “flow of energy”, or in other words “work”, despite what you may be tempted to think, and despite these authors’ extremely misleading analogy of a flowing river (which has exactly nothing in common with “lines” of electric or magnetic force – and no, your “buses” are not an improvement). No, instead “flux” is defined there as “field strength”, or “density of lines of force”, measured therefore in Newtons per Coulomb (over an area). Do you see any “energy flow” (i.e. Watts) in those units? Because I don’t. Instead I see force, closely related to pressure, which was the word you used. (And then apparently forgot.)
So now, having sorted that out, we might, at long last,have a way to help you resolve your self-contradiction. This one, in case you forgot:
“Radiation is a FLUX”
and
“Radiation is *NOT* radiant flux”
Let’s now clarify those apparently contradictory statements using the two different definitions of “flux” we have seen, and then see if the abhorrent (to logical people, at least) contradiction goes away:
“Radiation is a FLUX [of electric and magnetic field lines, i.e. a force]”
and
“Radiation is *NOT* radiant flux [or flow, of energy – i.e. work – this time using the colloquial English definition of flux=flow]”
Ah, that’s much better! Now we have two non-self-contradictory definitions. And both are verifiable by measurement. Do you disagree with either of these? And if so, why?
Armed with these definitions, we can also go back to the original claim you made (which I objected to), as follows:
“If a black body is isolated it radiates a flux F1”
And in order to determine whether my objection should be sustained or overruled, we need to know just exactly what you think “F1” is. I made an assumption about what you meant there, which I think was justified, but you know what they say about assumptions. In particular, would you like to denote that quantity F1 in Newtons (or Volts), which would be valid and measurable? Or, instead, in some entirely unrelated, unmeasurable, and therefore completely imaginary unit (in this context), such as, say, Watts for example?
And finally you said:
“Your word game is very tiresome.”
No, these are not “word games”, Tim. Science, of course, is all about definitions, and you had better get them right (and consistent) if you want to be taken seriously – particularly by anyone with more brains than you have. I do realize that learning physics is tiresome, yes, but that’s not my fault. Suck it up and try to focus, please.
If nitpicking quotes out of context is the best you got then GET LOST!
Heat is the flow of energy from one system to another. Enthalpy is the measure of the energy in each system. If heat flows from system1 then its enthalpy decreases. If heat flows into system2 then its enthalpy increases. Radiative flux is joules/sec-m^2. Thus in order to know how many joules flow from system1 to system2 you have to know the illuminated area in system2 and how long it is illuminated for.
Watts is power. Power per area is still power. Flux is power/area – (joules/sec) / m^2.
The fac tthat you can’t accept that simple truth just makes you a troll. GO AWAY TROLL.
“If nitpicking quotes out of context is the best you got then GET LOST”
No, Tim, I’m pointing out that your own source doesn’t agree with you. Maybe you should get lost until you can stop contradicting yourself? This is WUWT, you know. We like to engage in actual measurable science around here. Not lies, self-contradiction, hallucination, and insults.
“Radiative flux is joules/sec-m^2”
No it isn’t. That’s not what your own textbook says, is it? So where did you get that from?
And then what precisely is the relationship between “radiation” and “radiative flux”? So far you have told us that these are not the same thing. What, then, is “radiation”?
“Flux is power/area”
Well, you are certainly welcome to make this definition, contradicting your own textbook in the process. That is your right, just as it is anyone’s. However, if you define “flux” as “power”, then you no longer get to claim that “objects radiate flux [power] [based only on their own temperature]”. That’s false, and demonstrably so. Objects do not “emit power”. How do you propose to measure this “radiative flux”, so that the rest of us can be convinced that it exists, and therefore that you aren’t just hallucinating? (No, a field strength meter won’t do it.)
What’s the matter, Tim? Ran out of “malarkey” again?
“Heat is the flow of energy from one system to another”
Sure it is, but we aren’t talking about heat, Tim. We’re talking about electromagnetic radiation. That’s not the same thing, and physicists have known that for probably 150 years. Definitely for the last 100. Try to focus and stay on topic, please.
“The fac tthat you can’t accept that simple truth”
“Simple truth”, Tim? Really? Which of these claims of yours do you consider to be “simple truths”, and why:
“Radiation is a FLUX”
“Radiation is NOT radiant flux”
“I *know* that a 100 Watt signal exists”
“I can measure it! I have a meter! In Volts!!”
“Radiation is like pressure”
“EM fields are like buses”
“Flux is measured in Watts”
“Don’t read the textbook chapter I gave you about flux being in Newtons!!!!!!!!”
Obviously, none of this physics is actually “simple”, or you wouldn’t keep contradicting yourself, not to mention your ownmeasurements, and indeed your own textbook. The only “simple” thing around here is your faulty grasp of physics. How many brain cells do you have, exactly? Six? And are any of them connected to each other? Perhaps you should sit down and stay in your lane. It clearly isn’t physics, or logic, or science, or indeed rational thought.
And “Troll”? Really? Who invited you, anyway? You have repeatedly violated Anthony’s site policy on polite and respectful behaviour, not to mention Aristotle’s much older policy on non-self-contradiction. I am trying to teach you physics, and all you do is contradict yourself, lie, deflect from the question or ignore it entirely (“whiffing”, as you call it), and then insult me. Who taught you to behave like this? You are acting like both an untutored idiot and a first-class jerk. That’s an execrable and reprehensible combination. Engineers are supposed to be held to a higher standard than that. Aren’t they? I’m pretty sure it says so right in your professional engineering ethics guidelines. Have you read them?
Try Skeptical Science, or The Conversation, if you want to spew arrogant lies, hallucinations, and insults without being called onto the carpet. No, I am not going to “go away”. Not until you have learned your physics.
An amplifier requires “new” energy to experience a growth in gain due to feedback. With no new energy, the “gain” in the system, output+feedback, remains fixed. In other words, it will be redistributed within the system but no new energy. The sun supplies all the energy in the system. Positive feedback does not generate new energy, it can only reroute portions of the existing energy.
David, I think the vid you previously published here clearly shows that anywhere that is a little bit warmer results in convection, evaporation, and advection that moves the heat to a “cooler” location rather quickly, either that afternoon or within a few days I’df the weather front is bigger than convective cells. Thus IF one assumes that there are 4 watts of CO2 forcing….all it really does is move 4 out of the incoming 240 watts to a cooler area where it will be emitted to outer space. So the “cooler area” of the planet will decrease by about 2% and about 2% of the weather readings on the planet, assuming homogenous distribution which isn’t true, will go up a degree or so by the SB equation so that the heat can get into the sky above….
. . . clearly shows that anywhere that is a little bit warmer results in convection, evaporation, and advection . . ,
Unless “a little bit warmer” happens to be an arid desert, with a high pressure system suppressing convection.
Energy is lost from the surface by radiation – nothing else. Most escapes directly to space, with a small amount delayed by being absorbed and immediately reemitted by the atmosphere.
Hence the more rapid heating and cooling of arid deserts. Climate scientists seem to live in some sort of bizarre physics-free world, where dreams and fantasy rule.
I’m guessing that you want to disagree with something I said, but can’t figure out what it was you wanted to disagree with, nor how to support your disagreement.
Maybe you didn’t like me saying “Energy is lost from the surface by radiation.”?
Don’t blame me. I didn’t create the physical laws that apply to the universe.
”Energy …lost…by radiation…nothing else”. Just so completely over simplified to the point of being wrong… The surface down where we live loses heat by several means. Even the entire planet loses incoming heat by both radiation and reflection.
Just so completely over simplified to the point of being wrong . . .
But it’s not wrong, is it?
Even the entire planet loses incoming heat by both radiation and reflection.
Nonsense. An object does not “lose heat” by not receiving it. That’s the sort of silliness “climate scientists” indulge in. The energy that the Earth loses to space is lost by radiation – nothing else.
Harold The Organic Chemist Says:
“CO2 Does Not Cause Warming Of Air”!
Shown in the chart (See below) are plots of the average seasonal temperatures and a plot of average annual temperature at the Furnace Creek weather station in Death Valley from 1922 to 2001. In 1922 the concentration of CO2 in air was ca. 305 ppmv (0.60 g CO2/cu. m. of air), and by 2001 it had increased to ca. 371 ppmv (0.73 g CO2/cu. m. of air), but there was no corresponding increase in air temperature at this remote desert. The simple explanation is that there is just too little CO2 in the air to absorb enough out-going long wavelength IR light to warm up the desert air. The Tavg for 2001 was 25.1° C.
Another reason there was no increase in air temperature with increasing CO2 concentration at this arid desert is the absorption of IR light is saturated. This means that increasing the CO2 concentration of above above a certain level will not result in an increase in air temperature. For CO2 the threshold level is 300 ppmv, which was the concentration of CO2 in 1920. For info on the saturation effect, see:
“The Saturation of the Infrared Absorption by Carbon Dioxide in the Atmosphere” by Dieter Schildknecht available at: https://arixiv.org/pdf/2004/00708v1.
At the MLO in Hawaii, the concentration of CO2 is currently 426 ppmv. One cubic meter of this air has a mass pf 1,290 g and contains a mere
0.83 g of CO2. This small amount of CO2 in the air has no effect on air temperature in Death Valley. You are right to be suspicious of the claims about CO2.
PS: The chart was obtained from the late John L. Daly’s website:
“Still Waiting For Greenhouse” available at: http://www.john-daly.com. From the home page go to end and click on “Station Temperature Data. On the
“World Map”, click on “NA” and then page down to “U.S.A.-Pacific. Finally scroll down and click on “Death Valley”. Use the back arrow to return to the list of stations. Clicking on the back arrow again will redisplay the
“World Map”.
NB: If you click on the chart, it will expand and become clear. Click on the “X” in the circle to contract the chart and return to Comments.
“If a 1 °C increase in air temperature involves a 7% increase in saturation vapor pressure, then do the math.”
Sorry, no can do.
Over an air temperature range of 10-15 °C, each 1 °C increase in air temperature is equivalent to about a 6.5% increase in water saturation vapor pressure at equilibrium. However, over an air temperature range of 85-95 °C, each 1 °C increase in air temperature is equivalent to only about 3.8% increase in water saturation vapor pressure at equilibrium.
“So for the effectiveness of energy transport from the tropics to the poles, and from low altitude to high, the boost from additional water vapor is massive. . . . A 7% increase at about 25 kg per square meter is about 1,200 Watt-hours per square meter of improved energy transport . . .”
In your scenario of comparing the latent heat of condensation involved with rainfall with emphasis on “effectiveness of energy transport from the tropics to the poles, and from low altitude to high”, you have totally missed accounting for the offsetting latent heat of evaporation that is needed to add moisture content to the air at any given temperature. This is explained as being integral to Earth’s hydrologic cycle, with the total latent heat of water evaporation being in close balance with the total latent heat of water condensation over long time periods and with Earth’s total water mass being conserved.
For numerical large Q1 and numerical large Q2, when (Q1-Q2) is small the difference can still be significant compare to other independent parameters stated in the same physical units. That can be right.
1) Why are you interested in an “air temperature range of 85-95C”?
2) As evaporation occurs mainly at surface level, and condensation (with accompanying outgoing LW radiation) occurs at cloud levels, this “balanced” process is crucial to the study of energy, incoming vs outgoing, transport.
“you have totally missed accounting for the offsetting latent heat of evaporation”
No, I didn’t “miss” anything, because I wasn’t even trying to compute a balance. I was just giving an example to describe the powerful effectiveness of what happens in the atmosphere for energy transport and energy conversion.
“When your only tool is a thermometer…” nothing happens unless it can be measured as a thermometer reading change. If you spend all your time reading and averaging thermometers from different locations and times, then you can ignore the isothermal evaporation and condensation processes even though they involve orders of magnitude more energy than simple “specific heat”.
As an engineer with a chemistry degree it was the conflict between Beer-Lambert’s Law and the water vapour feedback that seemed off to me.
By Beer-Lambert’s law the impact of GHGs ought to be declining exponentially. And that includes the impact of water vapour.
But they never seemed to include the possibility of WV getting nearer to saturation in their models as it wasn’t affected by Beer-Lambert’s Law. That could only mean that the WV effect was being modelled as saturated and unsaturated at the same time.
What is not commonly appreciated is that the Clausius-Clapeyron Relationship is an upper-bound on a potential that is supply-limited. That is, in particular, the continental interiors cannot supply enough water vapor by evapotranspiration to achieve the concentration predicted by the C-C Relationship. That is why North America has high deserts in the Basin and Range province and arid grasslands in the high plains.
All modelers of our climate accept that rising levels of CO2 in the atmosphere will cause Global Warming, when, in fact, it can irrefutably be proven that CO2 has NO climatic effect.
ALL of the warming that has occurred since the industrial revolution has been due to decreases in the amount of SO2 aerosol pollution in our atmosphere, some due to the fallout of SO2 aerosols from volcanic eruptions, extended intervals (>3 years) between VEI4 and larger eruptions, and, since 1980, due to American and European “Clean Air” legislation of the 1970’s to reduce the amount of industrial SO2 aerosol pollution of our troposphere because of Acid rain and Health concerns.
As the air became cleaner, the intensity of the solar radiation striking Earth’s lower atmosphere and its surface increased, and warming naturally occurred.
In his June 23, 1988 hearing before the United States Senate Committee on Energy and Natural Resources, Dr. James Hansen erroneously attributed this warming to the “Greenhouse Effect”, without citing any proof, and this fallacy has, unfortunately, been accepted by almost everyone.
His “error” has resulted in untold misery for millions of people due to the draconian measures taken to reduce the amount of CO2 in the atmosphere, and the waste of trillions of dollars in the pursuit of a useless effort.
The point that I wanted to make is that it can be proven that CO2 has NO climatic effect, as you concluded in “That Can’t be Right”
Follow me (It is irrefutable).
ALL of the warming that has occurred since the Industrial Revolution has been due to decreases in the amount of SO2 aerosol pollution in our atmosphere.
Some was due to the fallout of SO2 aerosols from VEI4 and larger volcanic eruptions, some due to periods of ~3 years or more when there were no such eruptions, some due to American business recessions, when foundries, factories, etc. were temporarily closed because of reduced industrial activity, and, since 1980, due to American and European “Clean Air” legislation of the 1970’s to reduce the amount of industrial SO2 aerosol pollution of the troposphere, because of Acid rain and Health concerns
As the air became cleaner, the intensity of the solar radiation striking the Earth’s lower atmosphere and its surface inevitably increased and warming naturally occurred.
The case for “Greenhouse Gas” warming was made by Dr. James Hansen , in his June 1988 hearing before the United States Senate Committee on Energy and Natural Resources, where he attributed the warming at that time (0.28 deg. C) to the “Greenhouse Gas” effect, when in fact, it was due to decreased SO2 aerosol pollution of the atmosphere.
Unfortunately, almost everyone accepted his fallacy, and his “error” has resulted in untold misery for millions of people due the draconian measures being taken to reduce the amount of CO2 in the atmosphere, and trillions of dollars have been wasted in a useless effort.
Question: How many years during the period from 1999 to 2014, did NASA and NOAA describe as being the hottest year?
AI says:
“During the 1999-2014 period, NASA and NOAA identified 2014 as the hottest year on record, marking the third time in a decade (after 2005 and 2010) that a new record was set, with the trend showing most of the 10 warmest years occurring since 2000, highlighting a rapid warming streak.
Key Years Identified as Record-Breakers (within your timeframe):
2005: Became the hottest year recorded at the time.2010: Tied or slightly surpassed 2005 to become the new warmest year.2014: Became the new warmest year, breaking records set by 2010 and 2005. Context for 1999-2014:
A Significant Warm Streak: This period showcased a clear, rapid warming trend, with 1998 and all years from 2000 onward (up to 2014) making up the top 10 warmest years in the instrumental record.Data Consistency: Both NASA and NOAA independently confirmed these findings, reinforcing the long-term trend of rising global temperatures.
Now, compare these NASA and NOAA temperature Lies to the UAH Satellite chart, which shows that NONE of the years between 1998 and 2015 were hotter than 1998. So none of those years could be declared to be the “hottest year ever!’. They weren’t even close.
After the 1998, temperature high point, Hansen and NASA and NOAA expected the temperatures to continue to climb “because CO2”, but the temperatures did not continue to warm, they started to cool, and the Climate Alarmists at NASA and NOAA could not have that, which would undermine the CO2 crisis theory, so NASA and NOAA mannipulated the temperature numbers to show just the opposite of what the UAH satellite chart shows.
NASA and NOAA are lying about the temperatures.
I think a formal government investigation is warranted to expose the blatant climate change propaganda that NASA and NOAA have foisted upon the American people, causing psychological damage and economic losses because they believe the lies NASA and NOAA tell about CO2.
The Temperature Data Mannipulators started off bastardizing the regional temperature records to make things appear hotter today than they really are, and then in 1998, NASA and NOAA did another blatant bastardization of the temperature record in their efforts to promote the CO2 climate “crisis”.
Just about every year after 1998, NASA and NOAA would come out with the claim that the year was the “hottest year ever!”. They even went so far as to make successive years hotter than the previous year. By one one-hundreth of a degree! Year after year, hotter and hotter. That was NASA and NOAA’s mesage. And it is all a Big Lie, demonstrated by the UAH satellite chart.
The Trump administration needs to look into this fraud on the American people, and hold some people accountable. You have young people who are afraid to have kids because of NASA and NOAA lies about the climate and their futures. It’s criminal what NASA and NOAA have done.
That the earth warms up a few degrees is of little consequence because there will always long cold and snowy winters in many region of the earth like Canada where I live.
There may be manipulation but it is not needed to get that big difference. The surface measurements are subject to significant progressive local heat contamination from economic development. The atmospheric temps are not.
So you say. However, that is not at all clear from the listing of CRN monitoring site “location” names, most of which are associated with cities. See /www.ncei.noaa.gov/access/crn/station-listing .
One would have to look up each site location using the provided listings of latitude and longitude to see how close to urban development each station may actually be, AND THEN to actually visit each site to see if it is indeed compliant with the full set of requirements for proper monitoring of “ambient” air temperatures.
Anthony Watts has pointed out the numerous cases where so-called “good” monitoring stations have actually turned out to be worthless due (a) improper initial placement, and/or (b) surrounding developments since original siting (buildings, concrete/asphalt, vents, reflective surfaces) that detrimentally affect the local air temperature.
The question isn’t if the world is warming or not.
The question is about if the world is warming in a newsworthy manner or not.
And, frankly, if the weather folk weren’t working so very hard to detect the new records, we wouldn’t care.
We can adapt to the weather changes. And so does nature.
Don’t challenge the academics on their figures (except the stated confidence intervals, for rigour).
Challenge the academics on the importance of their figures.
They claim to be REAL LIFE BATMEN saving the whole world when they are actually just bean counting.
To help you Tom here is the latest year ranking from Roy Spencer. Be hard to argue we are not warming using his numbers.
While 1998 does feature in the top ten, it is in a sea of numbers from 2010 – 2025.
If Roy lying too?
Chinese panels are now so affordable that businesses and families are snapping them up, slashing their bills and challenging utilities.
Eskom is now planning to erect large solar arrays on the grounds of shuttered coal plants. And by 2040 it intends to shift its predominantly coal-based system to cleaner sources. “That’s where the world is moving,” said Nontokozo Hadebe, Eskom’s sustainability chief.
Numerous international cities demonstrate that a large share of cycling is possible, for example Copenhagen with a share of 28 percent, Münster with about 40 percent or Oldenburg with 43 percent.In Amsterdam, 36 percent of the inhabitants cycle on working days. However, not only large cities have great potential for cycling. In the Netherlands, there are 202 small cities where the share of cycling exceeds the car mode share.
New this year, our annual City Ratings program scored 30 European cities across nine countries, including Belgium, Denmark, France, Germany, Italy, the Netherlands, Norway, Spain and the United Kingdom. Whether they have a long history of bicycling, like Copenhagen and Utrecht, or have just turned their focus to bicycling, like Paris and Barcelona, most cities on this list outscore their U.S. peers by double digits. What’s their secret?
Depends on what you mean by improving people’s lives. Your authoritarian approach – ie 15 minute gulags etc – is naked neo-feudalism. The serfs will do as they are told – or else.
How about you inform yourself on 15 minute cities before coming to conclusions
Let’s inform the one who needs informing…
ROAD blocks stopping most motorists from driving through Oxford city centre will divide the city into six “15 minute” neighbourhoods, a county council travel chief has said. And he insisted the controversial plan would go ahead whether people liked it or not. – Oxford Mail
Bristol et al installs them in the dead of night under police protection…
‘Sneaky’ Green-led council installs LTNs at 3am under police protection Cover of darkness used after Bristol residents opposed to the roadblocks had previously protested by lying in front of machinery – The Telegraph
As I said, Your authoritarian approach – ie 15 minute gulags etc – is naked neo-feudalism. The serfs will do as they are told – or else.
Beside it being a traffic calming messure that has nothing to do with the idea of 15 minute city. I also couldn’t find an official statement from the council linking those two.
From what I found:
Beside busses, residents and cyclists could still enter
The traffic calming messure was succesful, with people describing the streets as quieter and safer
Those who didn’t work out like Marsh Road have been removed
What you gave me is more in line with “low traffic neighbourhoods”, “traffic calming” or concepts like superblocks (I think Barcelona is quite famous for that) and not 15-minute cities
You are amusing. People lying in front of construction machinery opposing something, which the councils deliberately ignore, counts for absolutely nothing in your worldview.
What you propose is wholly undemocratic – it’s neo-feudal. Authoritarian. Still want to tango on a pinhead?
What makes you conclude that those of us who disagree with your view of a future dystopia are unfamiliar with the proposal of 15-minute cities? Those who wear ideological blinders are poor judges of the pros and cons of significant social changes. I would be very surprised to discover that anyone has ever accused you of being deep thinker.
Have a look at the actual black-out in Berlin, where 50k households, 2k firms and 3 hospitals enjoy net zero with temps below 0°C and snow.
Biking warms the body, isn’t it?
Btw, it was a terrorist attack.
600,000 without power in Moscow the other day- and they’re probably not thrilled about their current low carbon emissions- but of course they won’t dare complain- after all, the Russian government said it had nothing to do with Ukraine drones- just technical problems.
I cycle about as much as I drive, about 3,000 miles per year, each. But I am not young. I can ride 100 miles a day though not very fast. The way most city riders behave I fear I’d be on the ground with broken bones in the first 10 miles if I tried mixing with them at my speed.
Other cyclists are by far the most obnoxious road users I encounter (though to be fair, the pedestrians are in second place, for different reasons). In the last 20 years I’ve had exactly one adverse encounter with a motor vehicle, and it turned out it had been stolen.
Admittedly you only need one adverse encounter with a car to end up dead, but I do not look forward to bicycle-dominated commuting nor doing my grocery shopping by bike in a howling wind.
You’re correct. I live in a very hilly area with mostly narrow and curving roads – they won’t pull over to the shoulder even if they’re barely making any headway up a steep incline.
I’ve been cycling for 70 years, wearing old shorts and a tea shirt. Why on Earth some people have to have $200 of fancy cycling clothes I never understand. Money to burn I guess and they want to look hot to the opposite sex or whichever they prefer.
If you are unfamiliar with the comic strip Pearls Before Swine, look it up at https://www.gocomics.com/pearlsbeforeswine and search for some panels featuring the ever-unrespected, Lycra-clad, helmet-wearing elitist.
I often see cyclists riding side by side- sometimes 4-5 of them, without enough common sense to stay close to the edge of the road if they hear a car approaching. I’ve had to slow down almost to nothing to get passed them – I usually will blast my horn at them too, once I get passed them. I stay close to the edge of the road when cycling and giver everyone else the right of way.
I can count on the fingers of my clenched fist the number of cyclists who acknowledge me in an average week.
I don’t know where you ride, but in the UK the Highway Code (the informal interpretation guide for the Highways Act that every road-user, including pedestrians, cyclists, and horse-riders is suppose to read) was recently revised. It happened under the supervision of Michael Gove, then minister of…something. The revised code was informed by input from the “cycling community”–the ones I described as the most obnoxious road users. They basically weaponised it.
So the conduct you describe is actually recommended now. And don’t they know it!
@MyUsernameReloaded: I think your lead paragraph is fine. A small amount of electricity probably can be very useful in a rural economy. It gives you light (via LEDs) in the evenings and probably news and music via radio. And maybe even TV if you live in range and can scrape up the cash for a set. That should be a pleasant change for areas beyond the reach of power grids. And where cash is scarce. And even if someone strung wires to your village, someone else would probably cut them down and sell the copper.
Your problem is the assumption that those benefits scale to the needs of an advanced industrial society. Solar and/or wind should work fine if you don’t need much power and not having it for a few days from time to time due to weather issues is merely an inconvenience. They are almost certainly going to work increasingly poorly the more dependent the society is on electricity. Do I think solar will work on Pitcairn Island — area about 6 square km, population about 60, no fossil fuel resource, 700km from the nearest neighbors? Probably. Do I think think they will work for Europe, California, or New York? Almost certainly not. For Canada or Siberia? You’re kidding, right?
“Chinese panels are now so affordable that businesses and families are snapping them up, slashing their bills and challenging utilities.”
Did they also buy batteries for nighttime or in the rainy season?
Sure, if I was many miles from the grid- living in a hut, I’d probably get some solar panels too- because out there I don’t need get around or do anything at night. Better than nothing I presume- but I’d be calling for the grid to deliver energy at as low a cost as possible.
But I doubt they’ll be building any factories out there with those toy solar panels.
They sure as hell won’t build them with the coal power plants they have. If you read the article you see that fossils never delivered there. Now PV steps up.
And not everything in africa is off-grid mud huts.
I was sort of joking- I don’t care for oversized status symbols either- but, they really would prefer the F150 over an E-bike if they have any serious work to do or distance to go- if that was the only choice. I had an F150 and I didn’t care for it- constantly breaking down. I now have a Toyota Tacoma- much better- and better than walking too. 🙂
Cycling? Sounds great- I’ve been cycling for 70 years- BUT- not in nasty weather all too common in much of the world. I have the option of using either my car or pickup. We just don’t want to be forced to depend on cycling. Improving bike lanes in American cities may result in more cycling- that’s OK- but American cities are spread out more than European cities- and nobody is going to cycle to visit their friends 100 miles away. Improved mass transit might help but that’ll take a few generations to develop. Unfortunately, in America, mass transportation is poorly developed thanks to bad governments, greedy unions, and many other reasons. It’s gotta get dependable and cheap for more Americans to want it.
I can remember once driving east towards Chicago in February, in my then new Subaru; my left arm was getting cold every time a gust of wind hit the car. I had to wad up my coat and put it between me and the door to prevent the wind from getting in. After I got home I took my car to the dealer and complained about the situation and they couldn’t find anything that wasn’t up to spec.
We haven’t even talked about the wind-chill factor and what it does to exposed flesh for those states north of the Mason-Dixon line in Winter. I suspect that MUR doesn’t live in, or even have experience with extreme weather conditions — or chooses to ignore reality.
I remember my parents made the decision to move from Northern Illinois to Phoenix after they had been stranded on the highway for several hours on the way home from a company New Years Eve party in Chicago. My father only had on a sport coat and my mother was in an evening gown. My father hit a patch of glare ice, spun out into a snow bank, and the fuel line froze before he could get the engine re-started.
Certainly not the kind of weather one would want to be pedaling a bike in. I suspect that people like MUR have little experience with the real world. Only with theoretical ’15-minute cities.’
Cycling in winter is not uncommon in a lot of countries.
I’m pretty sure Michel is talking about proper, continental winter. Winter where you should think twice about leaving your house.
You don’t get a lot of love on this site but I’ve kept quiet. Your words generally tell us everything we need to know; I don’t need to point out anything to anyone. But this comment, this is special.
He has no idea what a continental winter is like. Chicago, Pittsburgh, Not to mention further west. He should go spend a winter there. To really appreciate it you need a dog. Walk it three times a day, whatever the weather, however you feel. Then you understand, and the idea that anyone would cycle through those winters is stupidity squared.
The Finnish city? Who knows. As Hume said, miracles always happen a long way away and often a long time ago too.
“In most Finnish cities, the number of cyclists drops by 70-80% during the cold months as icy or snowy roads and freezing temperatures make it difficult for people to keep riding”
In the Winter, one would need either a full-length raincoat or windbreaker, and in the Summer, a change of clothes for when you get to your destination.
This is all assuming that the elderly population with arthritis, poor balance, and reduced strength can make other arrangements.
Numerous international cities demonstrate that a large share of cycling is possible, …
Have you ever tried to ride a bicycle on ice? Or carry the weekly groceries home in a rainstorm on a bicycle? There is often a big difference between what is “possible” and what is practical. Most of our technological innovations have resulted from an attempt to make life more comfortable, less arduous, and provide us with more leisure time. You, and those like you, would have us regress to a time more than a century ago before those labor-saving innovations came to be.
Remove the Earth’s atmosphere or even just the GHGs and the Earth becomes much like the Moon, no water vapor or clouds, no ice or snow, no oceans, no vegetation, no 30% albedo becoming a barren rock ball, hot^3 (400 K) on the lit side, cold^3 (100 K) on the dark. At Earth’s distance from the Sun space is hot (394 K) not cold (5 K).
That’s NOT what the RGHE theory says.
RGHE theory says “288 K (15 C) w – 255 K (-18 C) w/o = a 33 C colder ice ball Earth.”
255 K assumes w/o case keeps 30% albedo, an assumption akin to criminal fraud. Nobody agrees 288 K is GMST plus it was 15 C in 1896. 288 K is a physical surface measurement. 255 K is a S-B equilibrium calculation at ToA. Apples and potatoes.
Nikolov “Airless Celestial Bodies”
Kramm “Moon as test bed for Earth”
UCLA Diviner lunar mission data
JWST solar shield (391.7 K)
Sky Lab golden awning
ISS HVAC design for lit side of 250 F. (ISS web site)
Astronaut backpack life support w/ AC and cool water tubing underwear. (Space Discovery Center)
RGHE theory joins caloric, luminiferous ether, spontaneous generation, phlogiston, et al in the scientific trash bin of failed theories.
John Pickens
January 4, 2026 7:49 am
Was this battery fire posted on WUWT? Second fire at this location in New York. Story Tip
The dolt who wrote that was wrong in basically every sentence.
A very ignorant far-left supporter of socialist dictators and a climate wonk, who lives every second of his life supported by fossil fuels and their products.
Trump has hopefully freed Venezuela from a brutal dictator who is holding some 800+ political prisoners.
They now have a chance to Make Venezuela Great Again, on the back of oil.. like before the rabid Cuban backed socialists took over.
By the way. Were there any actual oil wars yet?
I mean, oil fields and transportation becoming major objectives in wars (real and planned), sure… but that was about means to deprive the enemy of a vital resource, not an end in itself.
Petrodollar wars, yes… but that was about controlling the market and extracting tax from everyone else (in that emission of fiat currency is but a convenient form of tax). This was not about oil at all. if USA at the time had more serious troubles in Middle East, but had some other important market controlled better, instead of the “petrodollar” there could be something else, but political and military implications would be much the same.
But wars for oil as such? Did it ever happen?
As we write it is close to O°C in the UK – colder in Scotland, a bit higher in the south and west.. Colder at night, a bit warmer during the day. This is the usual blocking high to the south west, which blocks warm air from the Atlantic and allows other systems to bring cold air from the Arctic.
And as we write there are people dying in the UK because they are not turning their heating on, and they are not doing that because they cannot afford to, and they cannot afford to because of the mad net zero policies that have raised UK electricity prices.
85% if UK homes have gas heat. But there are a lot of poorer people who are still using electricity for heating either wholly or as a supplement. Some estimates up to 30%.
There are people in the UK who, as we write, are literally deciding not to turn on their electric kettles to make a cup of hot tea because expense.
Net Zero in the UK: how to close down your gas industry, kill your old and poor, and save the planet, and get that lovely virtuous feeling.
GOODBY GLASGOW-NET ZERO
Glasgow City Council declared a climate emergency in 2019 and pursues ambitious net-zero goals by 2030, ahead of Scotland’s 2045 target, through a revised Climate Plan emphasizing rapid decarbonization. Glasgow aims for net-zero by 2030 via a “Net Zero Route Map” requiring scaled interventions in carbon removal, green jobs, and biodiversity restoration, while addressing fuel poverty and air quality.
Glasgow’s 2030 net-zero target demands an unprecedented acceleration in emissions cuts, building on past progress like a 45.7% reduction from 2006 levels by 2022, but requiring a “sharp increase in the scope, scale, and intensity” of interventions across all sectors.
Achieving this in five years necessitates profound lifestyle shifts: households face mandatory home upgrades disrupting daily routines and budgets, car-dependent residents encounter reduced parking, congestion charges, and Low Emission Zone expansions that penalize non-compliant vehicles, while meat-heavy diets and frequent air travel yield to waste reduction and active travel mandates. Gas boiler phase-outs and building decarbonization will spike energy costs initially, exacerbating fuel poverty without subsidies, forcing urban densification that curtails suburban living and long-distance mobility.
With quick wins exhausted, the plan admits reliance on sequestration alongside cuts, implying rationed consumption in heating, food, and transport to balance the math—transformative changes akin to wartime austerity, where individual freedoms yield to collective planetary imperatives.
This blueprint risks social division, with compliant urban elites thriving in walkable zones while others face rationed heat, meat, and mobility—echoing dystopian controls under the guise of salvation, where personal choices erode for unproven climate gains. Protests in Oxford and elsewhere signal rising backlash against such top-down impositions.
GLASGOW IN FLAMES?
Mass demonstrations erupt as residents, hit by soaring energy bills and vehicle bans, blockade city centers like George Square, mirroring Oxford’s 2023 uprising against 15-minute zoning; clashes with police intensify over Low Emission Zone fines, escalating to riots with arson at EV charging stations and council offices amid fuel poverty riots in winter.
Affluent suburbanites and businesses flee to car-friendly outskirts or England, depopulating Tradeston-like zones; property values crash in densified areas, triggering a brain drain of skilled workers unwilling to endure heat pump retrofits or meat rationing, leaving ghost neighborhoods policed by drones.
Online fury explodes on X and Substack, with #GlasgowNetZeroNightmare trending globally, fueling doxxing of councilors and viral hacks of city apps; non-compliance surges via black-market gas boilers and underground car meets, paralyzing enforcement and forcing policy U-turns or authoritarian crackdowns.
In the worst-case vision of Glasgow’s net-zero trajectory, enforced low-mobility zones, surveillance for compliance, and rationed resources could indeed morph compliant neighborhoods into de facto open-air prisons, trapping the non-elite while exits remain theoretically open but practically gated by fees, fines, and social credit-like penalties.
Congestion charges and LEZ expansions act as invisible bars, pricing out non-EV drivers; drone-monitored active travel paths and smart-city apps track movements, flagging “excess” carbon footprints for audits or restrictions, normalizing a panopticon where leaving your 15-minute pod incurs escalating costs.
Residents face phased lockdowns on heating, flying, and meat via digital allowances, with non-compliance risking blacklisting from jobs or services—freedom preserved on paper, but daily life confined to walkable cages under climate edicts, as mass exodus empties the compliant core.
Glasgow’s 2030 net-zero blueprint, with its mandates for zero-emission operations and circular economy enforcement, could effectively strangle free enterprise by layering prohibitive regulations on small businesses and startups.
Regulatory OverloadOwners face compulsory retrofits for heat pumps and insulation, plus bans on gas appliances, ballooning upfront costs that crush margins for independent shops and cafes in zones like Tradeston; non-compliance triggers fines or shutdowns, favoring only subsidized corporate giants with ESG compliance teams.
Market DistortionsCongestion pricing and LEZ expansions deter customers driving in for deliveries or trade, while meat and waste quotas hobble butchers, restaurants, and markets—replacing vibrant local commerce with state-vetted “green” outlets, where innovation yields to bureaucratic carbon audits and digital tracking.
Economic LockdownFreelancers and entrepreneurs abandon risk-taking as Scope 3 emissions rules entangle supply chains in endless reporting, driving survivors into gig servitude under city apps; the end result: a neutered economy where private initiative bows to collective quotas, echoing Soviet-style planning under eco-guise.
Climate terrorists have invaded private property in AB and BC to put solar panels on homes of elected officials.
An odd case of terrorism was bombing of an electrical transmission facility on Vancouver Island, as if the leftist group thought the ‘reactance’ power factor balancing system was a nuclear reactor. The ‘Squamish Five’ went on to bomb a defense equipment manufacturing facility in ON. Would be dangerous to bomb a nuclear reactor, though the group were not smart – they slept with old dynamite beside them thus inhaled some dust from it.
Violent people get elected – Stephen Guilbeault trespassed and vandalized in the name of climate, later was Environment Minister of Canada for a while.
Khan’t be done.
Bill Cahill, managing director of First Bus London, said his firm was committed to hitting the mayor’s challenging target but said it involved far more than simply buying new buses.
More than 2,600 of 9,000 buses in the capital are now “zero emission” – almost 30 per cent – but Transport for London says it will take until 2034 to convert the entire fleet without Government funding.
…
In an interview with The Standard, Mr Cahill said: “It’s not just about buying buses, it’s about electrifying the depots – and electrifying the depots will become progressively more difficult.
“You don’t plug an electric bus into a 13amp socket. It’s a very high voltage system that takes a lot of planning.
https://apple.news/AM-BplqYURuWJSmjZE6jgww
I hear more oil will be coming to the market. London once had a deal for Venezuelan oil through former far left Mayor Ken Livingstone and Transport for London, Courtesy of Hugo Chavez
Funny old world.
Southeast Asian countries also move to electric busses
Chinese Electric Buses Dominate Southeast Asia’s Decarbonization Push
Yes, there is a predicted oil glut.
Good news for sensible people like me who run petrol vehicles. Remember…
“You don’t plug an electric bus into a 13amp socket.
They have no hope of delivering.
From your own link:
https://d1o9e4un86hhpc.cloudfront.net/
China exported IRO 81,000,000 buses in 2024 of which IRO 10,000,000 were electric. In 2025 these figures are 43,000,000 and 9,000,000 respectively.
That’s a reduction, not an increase!
So China is dumping even cheaper EVs on other countries because their own people don’t want them.
Not only, but also…
Hundreds of British buses have Chinese ‘kill switch’ – The Standard
Username is keen on this stuff.
I just checked. China exported 81,000 buses not 81 million.
TBH, I didn’t check, I just went off the link provided by MyUsername.
And he apparently didn’t notice the numbers- after all, climatistas don’t worry about numbers.
Thank you.
I wonder how many acres 81M buses would require? Can we assume 1 foot of clearance all around? How many Olympic size swimming pools is that?
And imagine the fire if just one of them ignited .. the whole lot of them.
81 million buses in 2024?
…which, if placed end-to-end, would doubtless stretch all the way to China
And back! 🙂
BATTERY SYSTEM CAPITAL COSTS, OPERATING COSTS, ENERGY LOSSES, AND AGING
https://www.windtaskforce.org/profiles/blogs/battery-system-capital…
by Willem Post
.
This article shows, fires or not, battery systems to absorb midday solar and release it during evening peak hours, are absolutely not the way to store large quantities of electricity. At 40% annual average throughput, nearly impossible to achieve, the cost would be 38.1 c/kWh.
.
If we used wind, we would be dependent on Europe
If we used solar, we would be dependent on China
We would be screwed up and down and sideways with high cost/kWh energy
We would be totally uncompetitive on domestic and world markets
No energy dominance ever!!
.
Utility-scale, battery system pricing usually not made public, but for this system it was.
Neoen, in western Australia, turned on its 219 MW/ 877 MWh Tesla Megapack battery, the largest in western Australia.
Ultimately, a 560 MW/2,240 MWh battery system, $1,100,000,000/2,240,000 kWh = $491/kWh, delivered as AC, late 2024 pricing. Smaller capacity systems cost much more than $500/kWh
.
Annual Cost of Megapack Battery Systems; 2023 pricing
Assume 45.3 MW/181.9 MWh; turnkey cost $104.5 million; 104,500,000/181,900 = $574/kWh, per Example 2
.
Amortize bank loan, 50% of $104.5 million, at 6.5%/y for 15 years, $5.484 million/y
Pay Owner return, 50% of $104.5 million, at 10%/y for 15 years, $6.765 million/y (10% due to high inflation)
Lifetime (Bank + Owner) payments 15 x (5.484 + 6.765) = $183.7 million
.
Assume battery daily usage, 15 years at 10%; loss factor = 1 / (0.9 *0.9)
Battery lifetime output = 15 y x 365 d/y x 181.9 MWh x 0.1, usage x 1000 kWh/MWh = 99,590,250 kWh to HV grid; 122,950,926 kWh from HV grid; 233,606,676 kWh loss
(Bank + Owner) payments, $183.7 million / 99,590,250 kWh = 184.5 c/kWh
Less 50% subsidies (tax credits, 5-y depreciation, loan interest deduction, etc.) is 92.3c/kWh
Subsidies shift costs from project Owners to ratepayers, taxpayers, government debt.
.
Excluded costs/kWh: 1) O&M; 2) system aging, 1.5%/y, 3) loss factor 1 / (0.9*0.9), HV grid-to-HV grid, 4) grid extension/reinforcement to connect battery systems, 5) downtime of parts of the system, 6) decommissioning in year 15, i.e., disassembly, reprocessing, storing at hazardous waste sites. Excluded costs would add at least 15 c/kWh
.
COMMENTS ON CALCULATION
Almost all existing battery systems operate at less than 10%, see top URL, i.e., new systems would operate at about 92.4 + 15 = 107.4 c/kWh. They are used to stabilize the grid, i.e., frequency control and counteracting up/down W/S outputs. If 40% throughput, 23.1 + 15 = 38.1 c/kWh.
That is on top of the cost/kWh of the electricity taken from the HV grid to charge the batteries
.
Up to 40% could occur by absorbing midday solar peaks and discharging during late-afternoon/early-evening, in sunny California and other such states. The more solar systems, the greater the midday peaks.
See top URL for Megapacks required for a one-day wind lull in New England
.
40% throughput is close to Tesla’s recommendation of 60% maximum throughput, i.e., not charge above 80% and not discharge below 20%, to perform 24/7/365 service for 15 y, with normal aging.
Owners of battery systems with fires, likely charged above 80% and discharged below 20% to maximize profits.
Tesla’s recommendation was not heeded by the Owners of the Hornsdale Power Reserve in Australia. They excessively charged/discharged the system. After a few years, they added Megapacks to offset rapid aging of the original system, and added more Megapacks to increase the rating of the expanded system.
http://www.windtaskforce.org/profiles/blogs/the-hornsdale-power-reserve-largest-battery-system-in-australia
.
Regarding any project, Banks and Owners have to be paid, no matter what. I amortized the Bank loan and Owner’s investment
Divide total payments over 15 years by the throughput during 15 years, to get c/kWh, as shown.
.
Loss factor = 1 / (0.9 *0.9), from HV grid to 1) step-down transformer, 2) front-end power electronics, 3) into battery, 4) out of battery, 5) back-end power electronics, 6) step-up transformer, to HV grid, i.e., draw about 50 units from HV grid to deliver about 40 units to HV grid. That gets worse with aging.
.
A lot of people do not like these c/kWh numbers, because they have been misled by self-serving folks, that “battery Nirvana is just around the corner”.
.
NOTE: EV battery packs cost about $135/kWh, before it is installed in the car. Such packs are good for 6 to 8 years, used about 2 h/d, at an average speed of 30 mph. Utility battery systems are used 24/7/365 for 15 years
.
EUROPE AIMS TO WEAKEN THE US WITH EXPENSIVE OFFSHORE WINDMILLS THAT PRODUCE EXPENSIVE, LOW-QUALITY ELECTRICITY
https://www.windtaskforce.org/profiles/blogs/europe-attempts-to-entangle-us-with-expensive-offshore-windmills
By Willem Post
.
If we used wind, we would be dependent on Europe
If we used solar, we would be dependent on China
We would be screwed up and down and sideways with high cost/kWh energy
We would be totally uncompetitive on domestic and world markets
No energy dominance ever!!
.
Net zero by 2050 Euro elites tried to weaken the US, with help of the unpatriotic, leftist Biden clique, into going down the black hole of 30,000 MW by 2030 of expensive, highly-subsidized, weather-dependent, grid-disturbing offshore windmill systems, which would need expensive, highly subsidized, short-lived, battery systems for grid support.
.
Offshore wind full cost of electricity FCOE = 30 c/kWh + 11 c/kWh = 41 c/kWh, no subsidies
Offshore wind full cost of electricity FCOE = 15 c/kWh + 11 c/kWh = 26 c/kWh, 50% subsidies
The 11 c/kWh is for various measures required by wind and solar. Power plant to landfill cost basis.
This compares with 7 c/kWh + 3 c/kWh = 10 c/kWh from existing gas, coal, nuclear, large reservoir hydro plants.
.
Such expensive W/S electricity would have made the US even less competitive in world markets.
Any US tariffs on the European supply of wind systems would greatly increase their turnkey capital costs/MW and their electricity costs/ kWh.
.
Almost the entire supply of the wind projects would be:
1) designed and made in Europe,
2) then transported across the Atlantic Ocean by European specialized ships,
3) then unloaded at new, taxpayer-financed, $500-million storage/pre-assembly/staging/barge-loading areas,
4) then barged to European specialized erection ships for erection of the windmill systems.
5) The financing would be mostly by European pension funds, that pay benefits to European retirees.
.
Hundreds of people in each seashore state would have jobs during the erection phase
The other erection jobs would be by specialized European people, mostly on cranes and ships
Hundreds of people in each seashore state would have long-term O&M jobs, using mostly European spare parts, during the 20-y electricity production phase.
.
Conglomerates owned by Euro elites would finance, build, erect, own and operate almost all of the 30,000 MW of offshore windmills, providing work for many thousands of European workers for decades, and multi-$billion profits each year.
.
That Euro offshore wind ruse did not work out, because Trump was elected.
Trump-hating, Euro elites are furious. Projects are being cancelled. The European windmill industry is in shambles, with multi-$billion annual losses, lay-offs and tens of $billions of stranded costs.
.
Trump spared the US from the W/S evils inflicted by the leftist, woke Democrat cabal, that used an autopen for Biden signatures, and bypassed on-the-beach/in-the-basement Biden, an increasingly dysfunctional Marionette.
.
Trump declared a National Energy Emergency, and put W/S/B systems at the bottom of the list, and suspended their licenses to put their rushed, glossy environmental impact statements, EIS, under proper scrutiny.
.
Euro elites used the IPCC-invented, “CO2-is-evil” hoax, based on its own “science”.
These elites used:
.
1) the foghorn of government-subsidized Corporate Media to propagate scare-mongering slogans and brainwash the people,
2) censorship to suppress free thinking on town hall forums,
3) election interference, as in Moldova and Georgia,
4) ostracizing /marginalizing major political parties to produce desired outcomes, as in Germany.
.
Wall Street elites saw an opportunity for tax shelters for its elite clients.
Woke politicians/bureaucrats were “cut-in” on $juicy deals to pass subsidies, favorable rules and regulations, and impose government mandates.
Euro elites wanted the US to deliver electricity to users at very high c/kWh, to preserve Europe’s extremely advantageous trade balance with the US.
https://www.windtaskforce.org/profiles/blogs/international-trade-is-a-dog-eat-dog-business
“Coal fired power remains the largest dispatchable source worldwide to 2035 with capacity set to peak at c. 2500GW.”
“Coal fired generation in S E Asia is projected to continue to rise through to 2040”
“Natural gas fired capacity also sees robust growth and overtakes coal”
“Oil demand in India is the largest of any country to 2035 and continues to rise to 2050”
Oil, coal and natural gas still dominate each providing over 150EJ of global energy demand with oil almost at 200EJ and coal c. 180EJ. Unreliables around 80EJ
IEA ‘World Energy Outlook 2025’ (Nov 2025)
NEW MINE-MOUTH COAL ELECTRICITY LESS COSTLY, AVAILABLE NOW, NOT PIE IN THE SKY, LIKE EXPENSIVE FUSION AND SMALL MODULAR NUCLEAR
https://www.windtaskforce.org/profiles/blogs/coal-electricity-less-costly-available-now-not-pie-in-the-sky
By Willem Post
.
If we used wind, we would be dependent on Europe
If we used solar, we would be dependent on China
We would be screwed up and down and sideways with high cost/kWh energy
We would be totally uncompetitive on domestic and world markets
No energy dominance ever!!
.
It is very easy for coal to compete with wind and solar
In the US, Utilities are forced to buy offshore wind electricity for about 15 cents/kWh.
That price would have been 30 cents/kWh, if no 50% subsidies.
.
Offshore wind full cost of electricity FCOE = 30 c/kWh + 11 c/kWh = 41 c/kWh, no subsidies
Offshore wind full cost of electricity FCOE = 15 c/kWh + 11 c/kWh = 26 c/kWh, 50% subsidies
The 11 c/kWh is for various measures required by wind and solar; power plant-to-landfill cost basis.
This compares with 7 c/kWh + 3 c/kWh = 10 c/kWh from existing gas, coal, nuclear, large reservoir hydro plants.
.
Coal gets very little direct subsidies in the US.
Here is an example of the lifetime cost of a coal plant.
The key is running steadily at 90% output for 50 years, on average
.
Assume mine-mouth coal plant in Wyoming; 1800 MW (three x 600 MW); turnkey-cost $10 b; life 50 y; CF 0.9; no direct subsidies.
Payments to bank, $5 b at 6% for 50 y; $316 million/y x 50 = $15.8 b
Payments to Owner, $5 b at 10% for 50 y; $504 million/y x 50 = $21.2 b
Lifetime production, base-loaded, 1800 x 8766 x 0.9 x 50 = 710,046,000 MWh
.
Wyoming coal, low-sulfur, no CO2 scrubbers needed, at mine-mouth $15/US ton, 8600 Btu/lb, plant efficiency 40%, Btu/ton = 2000 x 8600 = 17.2 million
Lifetime coal use = 710,046,000,000 kWh/y x (3412 Btu/kWh/0.4)/17,200,000 Btu/US ton = 353 million US ton
Lifetime coal cost = $5.3 billion
.
The Owner can deduct interest on borrowed money, and can depreciate the entire plant over 50 y, or less, which helps him achieve his 10% return on investment.
Those are general government subsidies, indirectly charged to taxpayers and/or added to government debt.
.
Other costs:
Fixed O&M (labor, maintenance, insurance, taxes, land lease)
Variable O&M (water, chemicals, lubricants, waste disposal)
Fixed + Variable, newer plants 2 c/kWh, older plants up to 4 c/kWh
.
Year 1 Cost
O&M = $0.02/kWh x 710,046,000 MWh/50 y x 1000 kWh/MWh = $0.284 b
Coal = $15/US ton x 353 million US ton/50 y = 0.106 b
Bank/Owner = (15.8, Bank + 21.2, Owner)/50 y= 0.740 b
Total = 1.130 b
Revenue = $0.08/kWh x 710,046,000 MWh/50 x 1000 kWh/MWh = $1.136 b
Total revenue equals total cost at about 8 c/kWh
Banks and Owners get 0.74/1.136 = 65% of the project revenues
For lower electricity cost/kWh, borrow more money, say 70%
Traditional Nuclear has similar economics; life 60 to 80 y; CF 0.9 in the US.
.
For perspective, China used 2204.62/2000 x 4300 = 4740 million US ton in 2024.
China and Germany have multiple ultra-super-critical, USC, coal plants with efficiencies of 45% (LHV), 42% (HHV)
https://www.sciencedirect.com/topics/engineering/ultrasupercritical-plant
And they will all be run off mostly COAL FIRED ELECTRICITY.
Beware of claims from Communist China – some sources indicate it is building coal-fired generating plants.
(I suspect it needs much more electricity because population wants to live better and manufacturing plants need power.)
image didn’t attach
e-fire 1
e-fire 2..
I could keep going for many posts.. but you get the drift !!
If any transport can use EVs. it’s the busses. They have known routes, aren’t used on impulse and can have scheduled recharging times apart of a fleet.
Having said that, I think trolley busses with an emergency battery to get round unexpected obstacles make more sense. Batteries are generally inefficient and have a short life.
And trolley busses are cheaper to build than trams as they don’t use rails.
Many problems with electric busses in Canada and US.
April 1st sure came around fast. What a load of …….
https://www.dailymail.co.uk/news/article-15431949/pollution-trendy-wood-burning-stove-fat.html
I am not a meteorologist. I am an engineer by training.
So when the “climate” movement began gaining traction, spreading the expectation of “warming” due to emissions of CO2, something told me, “That can’t be right.”
One of the contradictions of the narrative was about water vapor feedback, proposed as an amplifier to the direct radiative effect of rising concentrations of CO2. But we had learned about the latent heat of water vapor, and more generally, the operation of vapor-cycle heat engines. Notably, the Rankine cycle implemented in condensing steam engines and steam turbines.
The central point for today is that the latent energy in the atmosphere at 1 inch of precipitable water is about 17,600 Watt-hours per square meter. One inch of PW is the same as 25.4 kg per square meter. Another way to express the significance of the latent energy of water vapor is that therefore the intensity of conversion to internal energy in a one-inch-per-hour rainfall event is 17,600 Watts per square meter.
So for the effectiveness of energy transport from the tropics to the poles, and from low altitude to high, the boost from additional water vapor is massive. If a 1 °C increase in air temperature involves a 7% increase in saturation vapor pressure, then do the math. A 7% increase at about 25 kg per square meter is about 1,200 Watt-hours per square meter of improved energy transport.
Was there ever a good scientific reason, from fundamental energy considerations, to expect the climate system to be perceptibly influenced from emissions of CO2, due to the single-digit-Watts per square meter static radiative effect? No. That can’t be right.
https://climatereanalyzer.org/wx/todays-weather/?var_id=pwtr&ortho=1&wt=1
Thank you for your interest in this matter.
It truly makes you wonder exactly what the climate model creators think they are actually modeling.
This reminds me about Pat Frank’s successful emulation of CMIP5 air temperature projections in his 2019 paper, “Propagation of Error…”. His demonstration that a simplified computation from incremental “forcings” matched the model outputs was a real eye-opener for me. The “climate” “modeling” has been an inherently circular exercise all along.
Data matching algorithms trained on past data are *TERRIBLE* predictors of the future – for everything and anything. And I’ve yet to see climate science come up with a true functional relationship for future climate – they can’t even get the models to agree – but say that the average of multiple wrong models is somehow “right”.
Assuming that even one model in an ensemble is close to being accurate, there can still only be one best result. Each and every one of the inferior models that are averaged dilutes the accuracy of the average rather than improves it. The only way that averaging all the runs together can improve the accuracy is if the distribution is symmetrical about the true value. Any skewness decreases the accuracy. Yet, I have never seen anyone make the case that ensembles have a normal distribution or regression about the mean. It is an unstated, and unexamined, assumption. All the results from an ensemble could have poor skill in predicting the future and the fact that the ensemble mean tends to run warm strongly suggests that the distribution is skewed and many, if not most, are inaccurate.
It is not and never was about climate change. It is and always was about control and wealth redistribution. Facts are a weak tool against willful ignorance and ulterior motive.
Subsidies?
Ah, there you are, Tim. Let’s see where we left your physics lesson.
You said:
“EM field strength is like pressure”
“Radiation is *NOT* radiant flux”
“Radiation is a FLUX”
I asked you many times to explain why you contradicted yourself, but you totally “whiffed” on that, didn’t you? So, to try to answer that for you, let’s just take a closer look at the description in the libretexts text that you linked. And from it, I think we can finally discern what is causing your confusion. It is all about that word “flux”, which, as others smarter than me have pointed out, was an extremely poor word choice. (I don’t think that it was originally from Maxwell, Boltzmann, or Planck, but perhaps it was. And up until now, I had been accepting Willis’s equivalence of “flux” with “power”, but not surprisingly, that turns out to be wrong, as with practically everything else he’s said on this subject, so henceforth I will not be using that particular definition any longer myself.)
In any case, regardless of who invented it, we can see from your own text that “flux” is not in fact defined as a “flow of energy”, or in other words “work”, despite what you may be tempted to think, and despite these authors’ extremely misleading analogy of a flowing river (which has exactly nothing in common with “lines” of electric or magnetic force – and no, your “buses” are not an improvement). No, instead “flux” is defined there as “field strength”, or “density of lines of force”, measured therefore in Newtons per Coulomb (over an area). Do you see any “energy flow” (i.e. Watts) in those units? Because I don’t. Instead I see force, closely related to pressure, which was the word you used. (And then apparently forgot.)
So now, having sorted that out, we might, at long last, have a way to help you resolve your self-contradiction. This one, in case you forgot:
“Radiation is a FLUX”
and
“Radiation is *NOT* radiant flux”
Let’s now clarify those apparently contradictory statements using the two different definitions of “flux” we have seen, and then see if the abhorrent (to logical people, at least) contradiction goes away:
“Radiation is a FLUX [of electric and magnetic field lines, i.e. a force]”
and
“Radiation is *NOT* radiant flux [or flow, of energy – i.e. work – this time using the colloquial English definition of flux=flow]”
Ah, that’s much better! Now we have two non-self-contradictory definitions. And both are verifiable by measurement. Do you disagree with either of these? And if so, why?
Armed with these definitions, we can also go back to the original claim you made (which I objected to), as follows:
“If a black body is isolated it radiates a flux F1”
And in order to determine whether my objection should be sustained or overruled, we need to know just exactly what you think “F1” is. I made an assumption about what you meant there, which I think was justified, but you know what they say about assumptions. In particular, would you like to denote that quantity F1 in Newtons (or Volts), which would be valid and measurable? Or, instead, in some entirely unrelated, unmeasurable, and therefore completely imaginary unit (in this context), such as, say, Watts for example?
And finally you said:
“Your word game is very tiresome.”
No, these are not “word games”, Tim. Science, of course, is all about definitions, and you had better get them right (and consistent) if you want to be taken seriously – particularly by anyone with more brains than you have. I do realize that learning physics is tiresome, yes, but that’s not my fault. Suck it up and try to focus, please.
If nitpicking quotes out of context is the best you got then GET LOST!
Heat is the flow of energy from one system to another. Enthalpy is the measure of the energy in each system. If heat flows from system1 then its enthalpy decreases. If heat flows into system2 then its enthalpy increases. Radiative flux is joules/sec-m^2. Thus in order to know how many joules flow from system1 to system2 you have to know the illuminated area in system2 and how long it is illuminated for.
Watts is power. Power per area is still power. Flux is power/area – (joules/sec) / m^2.
The fac tthat you can’t accept that simple truth just makes you a troll. GO AWAY TROLL.
“If nitpicking quotes out of context is the best you got then GET LOST”
No, Tim, I’m pointing out that your own source doesn’t agree with you. Maybe you should get lost until you can stop contradicting yourself? This is WUWT, you know. We like to engage in actual measurable science around here. Not lies, self-contradiction, hallucination, and insults.
“Radiative flux is joules/sec-m^2”
No it isn’t. That’s not what your own textbook says, is it? So where did you get that from?
And then what precisely is the relationship between “radiation” and “radiative flux”? So far you have told us that these are not the same thing. What, then, is “radiation”?
“Flux is power/area”
Well, you are certainly welcome to make this definition, contradicting your own textbook in the process. That is your right, just as it is anyone’s. However, if you define “flux” as “power”, then you no longer get to claim that “objects radiate flux [power] [based only on their own temperature]”. That’s false, and demonstrably so. Objects do not “emit power”. How do you propose to measure this “radiative flux”, so that the rest of us can be convinced that it exists, and therefore that you aren’t just hallucinating? (No, a field strength meter won’t do it.)
What’s the matter, Tim? Ran out of “malarkey” again?
“Heat is the flow of energy from one system to another”
Sure it is, but we aren’t talking about heat, Tim. We’re talking about electromagnetic radiation. That’s not the same thing, and physicists have known that for probably 150 years. Definitely for the last 100. Try to focus and stay on topic, please.
“The fac tthat you can’t accept that simple truth”
“Simple truth”, Tim? Really? Which of these claims of yours do you consider to be “simple truths”, and why:
“Radiation is a FLUX”
“Radiation is NOT radiant flux”
“I *know* that a 100 Watt signal exists”
“I can measure it! I have a meter! In Volts!!”
“Radiation is like pressure”
“EM fields are like buses”
“Flux is measured in Watts”
“Don’t read the textbook chapter I gave you about flux being in Newtons!!!!!!!!”
Obviously, none of this physics is actually “simple”, or you wouldn’t keep contradicting yourself, not to mention your own measurements, and indeed your own textbook. The only “simple” thing around here is your faulty grasp of physics. How many brain cells do you have, exactly? Six? And are any of them connected to each other? Perhaps you should sit down and stay in your lane. It clearly isn’t physics, or logic, or science, or indeed rational thought.
And “Troll”? Really? Who invited you, anyway? You have repeatedly violated Anthony’s site policy on polite and respectful behaviour, not to mention Aristotle’s much older policy on non-self-contradiction. I am trying to teach you physics, and all you do is contradict yourself, lie, deflect from the question or ignore it entirely (“whiffing”, as you call it), and then insult me. Who taught you to behave like this? You are acting like both an untutored idiot and a first-class jerk. That’s an execrable and reprehensible combination. Engineers are supposed to be held to a higher standard than that. Aren’t they? I’m pretty sure it says so right in your professional engineering ethics guidelines. Have you read them?
Try Skeptical Science, or The Conversation, if you want to spew arrogant lies, hallucinations, and insults without being called onto the carpet. No, I am not going to “go away”. Not until you have learned your physics.
An amplifier requires “new” energy to experience a growth in gain due to feedback. With no new energy, the “gain” in the system, output+feedback, remains fixed. In other words, it will be redistributed within the system but no new energy. The sun supplies all the energy in the system. Positive feedback does not generate new energy, it can only reroute portions of the existing energy.
This doesn’t Bode well for their models.
😉
David, I think the vid you previously published here clearly shows that anywhere that is a little bit warmer results in convection, evaporation, and advection that moves the heat to a “cooler” location rather quickly, either that afternoon or within a few days I’df the weather front is bigger than convective cells. Thus IF one assumes that there are 4 watts of CO2 forcing….all it really does is move 4 out of the incoming 240 watts to a cooler area where it will be emitted to outer space. So the “cooler area” of the planet will decrease by about 2% and about 2% of the weather readings on the planet, assuming homogenous distribution which isn’t true, will go up a degree or so by the SB equation so that the heat can get into the sky above….
https://youtu.be/I0OCzxUyMqQ?si=-ONt7rzlwGPvr-DS
Hmmm… I’df…a new word invented by type-ahead that should just be “if”
Unless “a little bit warmer” happens to be an arid desert, with a high pressure system suppressing convection.
Energy is lost from the surface by radiation – nothing else. Most escapes directly to space, with a small amount delayed by being absorbed and immediately reemitted by the atmosphere.
Hence the more rapid heating and cooling of arid deserts. Climate scientists seem to live in some sort of bizarre physics-free world, where dreams and fantasy rule.
Huhhh….a lot more heat is lost from wet surfaces by evaporation than by radiation…
I’m guessing that you want to disagree with something I said, but can’t figure out what it was you wanted to disagree with, nor how to support your disagreement.
Maybe you didn’t like me saying “Energy is lost from the surface by radiation.”?
Don’t blame me. I didn’t create the physical laws that apply to the universe.
”Energy …lost…by radiation…nothing else”. Just so completely over simplified to the point of being wrong… The surface down where we live loses heat by several means. Even the entire planet loses incoming heat by both radiation and reflection.
But it’s not wrong, is it?
Nonsense. An object does not “lose heat” by not receiving it. That’s the sort of silliness “climate scientists” indulge in. The energy that the Earth loses to space is lost by radiation – nothing else.
Why complicate things?
Harold The Organic Chemist Says:
“CO2 Does Not Cause Warming Of Air”!
Shown in the chart (See below) are plots of the average seasonal temperatures and a plot of average annual temperature at the Furnace Creek weather station in Death Valley from 1922 to 2001. In 1922 the concentration of CO2 in air was ca. 305 ppmv (0.60 g CO2/cu. m. of air), and by 2001 it had increased to ca. 371 ppmv (0.73 g CO2/cu. m. of air), but there was no corresponding increase in air temperature at this remote desert. The simple explanation is that there is just too little CO2 in the air to absorb enough out-going long wavelength IR light to warm up the desert air. The Tavg for 2001 was 25.1° C.
Another reason there was no increase in air temperature with increasing CO2 concentration at this arid desert is the absorption of IR light is saturated. This means that increasing the CO2 concentration of above above a certain level will not result in an increase in air temperature. For CO2 the threshold level is 300 ppmv, which was the concentration of CO2 in 1920. For info on the saturation effect, see:
“The Saturation of the Infrared Absorption by Carbon Dioxide in the Atmosphere” by Dieter Schildknecht available at:
https://arixiv.org/pdf/2004/00708v1.
For a recent Death Valley temperature check, I went to:
https://www.extremeweatherwatch.com/cities/death-valley/average-temperature-by-year. The Tmax and Tmin data from 1960 to 2025 are displayed in table. The computed Tavg for 2025 is 26.1° C. This slight increase in air temperature is within the range of natural variation.
At the MLO in Hawaii, the concentration of CO2 is currently 426 ppmv. One cubic meter of this air has a mass pf 1,290 g and contains a mere
0.83 g of CO2. This small amount of CO2 in the air has no effect on air temperature in Death Valley. You are right to be suspicious of the claims about CO2.
PS: The chart was obtained from the late John L. Daly’s website:
“Still Waiting For Greenhouse” available at: http://www.john-daly.com. From the home page go to end and click on “Station Temperature Data. On the
“World Map”, click on “NA” and then page down to “U.S.A.-Pacific. Finally scroll down and click on “Death Valley”. Use the back arrow to return to the list of stations. Clicking on the back arrow again will redisplay the
“World Map”.
NB: If you click on the chart, it will expand and become clear. Click on the “X” in the circle to contract the chart and return to Comments.
Sorry, no can do.
Over an air temperature range of 10-15 °C, each 1 °C increase in air temperature is equivalent to about a 6.5% increase in water saturation vapor pressure at equilibrium. However, over an air temperature range of 85-95 °C, each 1 °C increase in air temperature is equivalent to only about 3.8% increase in water saturation vapor pressure at equilibrium.
“So for the effectiveness of energy transport from the tropics to the poles, and from low altitude to high, the boost from additional water vapor is massive. . . . A 7% increase at about 25 kg per square meter is about 1,200 Watt-hours per square meter of improved energy transport . . .”
In your scenario of comparing the latent heat of condensation involved with rainfall with emphasis on “effectiveness of energy transport from the tropics to the poles, and from low altitude to high”, you have totally missed accounting for the offsetting latent heat of evaporation that is needed to add moisture content to the air at any given temperature. This is explained as being integral to Earth’s hydrologic cycle, with the total latent heat of water evaporation being in close balance with the total latent heat of water condensation over long time periods and with Earth’s total water mass being conserved.
For numerical large Q1 and numerical large Q2, when (Q1-Q2) is small the difference can still be significant compare to other independent parameters stated in the same physical units. That can be right.
What are the uncertainty intervals attached to Q1 and Q2? If they are larger than the difference, it is not significant.
1) Why are you interested in an “air temperature range of 85-95C”?
2) As evaporation occurs mainly at surface level, and condensation (with accompanying outgoing LW radiation) occurs at cloud levels, this “balanced” process is crucial to the study of energy, incoming vs outgoing, transport.
“you have totally missed accounting for the offsetting latent heat of evaporation”
No, I didn’t “miss” anything, because I wasn’t even trying to compute a balance. I was just giving an example to describe the powerful effectiveness of what happens in the atmosphere for energy transport and energy conversion.
People know close to nothing over water vapor feedback. Me however, well I have revealed the whole thing already..
https://greenhousedefect.com/the-holy-grail-of-ecs/how-to-flip-the-sign-on-feedbacks
“When your only tool is a thermometer…” nothing happens unless it can be measured as a thermometer reading change. If you spend all your time reading and averaging thermometers from different locations and times, then you can ignore the isothermal evaporation and condensation processes even though they involve orders of magnitude more energy than simple “specific heat”.
As an engineer with a chemistry degree it was the conflict between Beer-Lambert’s Law and the water vapour feedback that seemed off to me.
By Beer-Lambert’s law the impact of GHGs ought to be declining exponentially. And that includes the impact of water vapour.
But they never seemed to include the possibility of WV getting nearer to saturation in their models as it wasn’t affected by Beer-Lambert’s Law. That could only mean that the WV effect was being modelled as saturated and unsaturated at the same time.
Which is nonsense.
What is not commonly appreciated is that the Clausius-Clapeyron Relationship is an upper-bound on a potential that is supply-limited. That is, in particular, the continental interiors cannot supply enough water vapor by evapotranspiration to achieve the concentration predicted by the C-C Relationship. That is why North America has high deserts in the Basin and Range province and arid grasslands in the high plains.
David Dibbell:
You are correct that “That can’t be right”
All modelers of our climate accept that rising levels of CO2 in the atmosphere will cause Global Warming, when, in fact, it can irrefutably be proven that CO2 has NO climatic effect.
ALL of the warming that has occurred since the industrial revolution has been due to decreases in the amount of SO2 aerosol pollution in our atmosphere, some due to the fallout of SO2 aerosols from volcanic eruptions, extended intervals (>3 years) between VEI4 and larger eruptions, and, since 1980, due to American and European “Clean Air” legislation of the 1970’s to reduce the amount of industrial SO2 aerosol pollution of our troposphere because of Acid rain and Health concerns.
As the air became cleaner, the intensity of the solar radiation striking Earth’s lower atmosphere and its surface increased, and warming naturally occurred.
In his June 23, 1988 hearing before the United States Senate Committee on Energy and Natural Resources, Dr. James Hansen erroneously attributed this warming to the “Greenhouse Effect”, without citing any proof, and this fallacy has, unfortunately, been accepted by almost everyone.
His “error” has resulted in untold misery for millions of people due to the draconian measures taken to reduce the amount of CO2 in the atmosphere, and the waste of trillions of dollars in the pursuit of a useless effort.
David Dibbell::
I replied to your post, but it was immediately deleted.
Not the first time this has happened. What a useless site!
I invite you to state the point you wanted to make.
David Dibbell:
The point that I wanted to make is that it can be proven that CO2 has NO climatic effect, as you concluded in “That Can’t be Right”
Follow me (It is irrefutable).
ALL of the warming that has occurred since the Industrial Revolution has been due to decreases in the amount of SO2 aerosol pollution in our atmosphere.
Some was due to the fallout of SO2 aerosols from VEI4 and larger volcanic eruptions, some due to periods of ~3 years or more when there were no such eruptions, some due to American business recessions, when foundries, factories, etc. were temporarily closed because of reduced industrial activity, and, since 1980, due to American and European “Clean Air” legislation of the 1970’s to reduce the amount of industrial SO2 aerosol pollution of the troposphere, because of Acid rain and Health concerns
As the air became cleaner, the intensity of the solar radiation striking the Earth’s lower atmosphere and its surface inevitably increased and warming naturally occurred.
The case for “Greenhouse Gas” warming was made by Dr. James Hansen , in his June 1988 hearing before the United States Senate Committee on Energy and Natural Resources, where he attributed the warming at that time (0.28 deg. C) to the “Greenhouse Gas” effect, when in fact, it was due to decreased SO2 aerosol pollution of the atmosphere.
Unfortunately, almost everyone accepted his fallacy, and his “error” has resulted in untold misery for millions of people due the draconian measures being taken to reduce the amount of CO2 in the atmosphere, and trillions of dollars have been wasted in a useless effort.
Thank you for taking the time to reply with your thoughts.
David Dibbell:
After “ALL” I should have written the obvious “apart from seasonal and albedo changes”
Question: How many years during the period from 1999 to 2014, did NASA and NOAA describe as being the hottest year?
AI says:
“During the 1999-2014 period, NASA and NOAA identified 2014 as the hottest year on record, marking the third time in a decade (after 2005 and 2010) that a new record was set, with the trend showing most of the 10 warmest years occurring since 2000, highlighting a rapid warming streak.
Key Years Identified as Record-Breakers (within your timeframe):
2005: Became the hottest year recorded at the time.2010: Tied or slightly surpassed 2005 to become the new warmest year.2014: Became the new warmest year, breaking records set by 2010 and 2005. Context for 1999-2014:
A Significant Warm Streak: This period showcased a clear, rapid warming trend, with 1998 and all years from 2000 onward (up to 2014) making up the top 10 warmest years in the instrumental record.Data Consistency: Both NASA and NOAA independently confirmed these findings, reinforcing the long-term trend of rising global temperatures.
Now, compare these NASA and NOAA temperature Lies to the UAH Satellite chart, which shows that NONE of the years between 1998 and 2015 were hotter than 1998. So none of those years could be declared to be the “hottest year ever!’. They weren’t even close.
After the 1998, temperature high point, Hansen and NASA and NOAA expected the temperatures to continue to climb “because CO2”, but the temperatures did not continue to warm, they started to cool, and the Climate Alarmists at NASA and NOAA could not have that, which would undermine the CO2 crisis theory, so NASA and NOAA mannipulated the temperature numbers to show just the opposite of what the UAH satellite chart shows.
NASA and NOAA are lying about the temperatures.
I think a formal government investigation is warranted to expose the blatant climate change propaganda that NASA and NOAA have foisted upon the American people, causing psychological damage and economic losses because they believe the lies NASA and NOAA tell about CO2.
The Temperature Data Mannipulators started off bastardizing the regional temperature records to make things appear hotter today than they really are, and then in 1998, NASA and NOAA did another blatant bastardization of the temperature record in their efforts to promote the CO2 climate “crisis”.
Just about every year after 1998, NASA and NOAA would come out with the claim that the year was the “hottest year ever!”. They even went so far as to make successive years hotter than the previous year. By one one-hundreth of a degree! Year after year, hotter and hotter. That was NASA and NOAA’s mesage. And it is all a Big Lie, demonstrated by the UAH satellite chart.
The Trump administration needs to look into this fraud on the American people, and hold some people accountable. You have young people who are afraid to have kids because of NASA and NOAA lies about the climate and their futures. It’s criminal what NASA and NOAA have done.
NASA’s GISTEMP makes several hundred changes every
month to their Land Ocean Temperature Index LOTI
The average is almost 400 and the median is about 350.
The record available from the Internet Wayback Machine
is incomplete before 2017.
That the earth warms up a few degrees is of little consequence because there will always long cold and snowy winters in many region of the earth like Canada where I live.
NOAA should do studies on winters.
There may be manipulation but it is not needed to get that big difference. The surface measurements are subject to significant progressive local heat contamination from economic development. The atmospheric temps are not.
The CRN has weather stations at sites selected to avoid UHI effects.
So you say. However, that is not at all clear from the listing of CRN monitoring site “location” names, most of which are associated with cities. See /www.ncei.noaa.gov/access/crn/station-listing .
One would have to look up each site location using the provided listings of latitude and longitude to see how close to urban development each station may actually be, AND THEN to actually visit each site to see if it is indeed compliant with the full set of requirements for proper monitoring of “ambient” air temperatures.
Anthony Watts has pointed out the numerous cases where so-called “good” monitoring stations have actually turned out to be worthless due (a) improper initial placement, and/or (b) surrounding developments since original siting (buildings, concrete/asphalt, vents, reflective surfaces) that detrimentally affect the local air temperature.
The question isn’t if the world is warming or not.
The question is about if the world is warming in a newsworthy manner or not.
And, frankly, if the weather folk weren’t working so very hard to detect the new records, we wouldn’t care.
We can adapt to the weather changes. And so does nature.
Don’t challenge the academics on their figures (except the stated confidence intervals, for rigour).
Challenge the academics on the importance of their figures.
They claim to be REAL LIFE BATMEN saving the whole world when they are actually just bean counting.
I have never encountered an alarmist that can tell me what the optimum global temperature is, and logically justify it.
To help you Tom here is the latest year ranking from Roy Spencer. Be hard to argue we are not warming using his numbers.
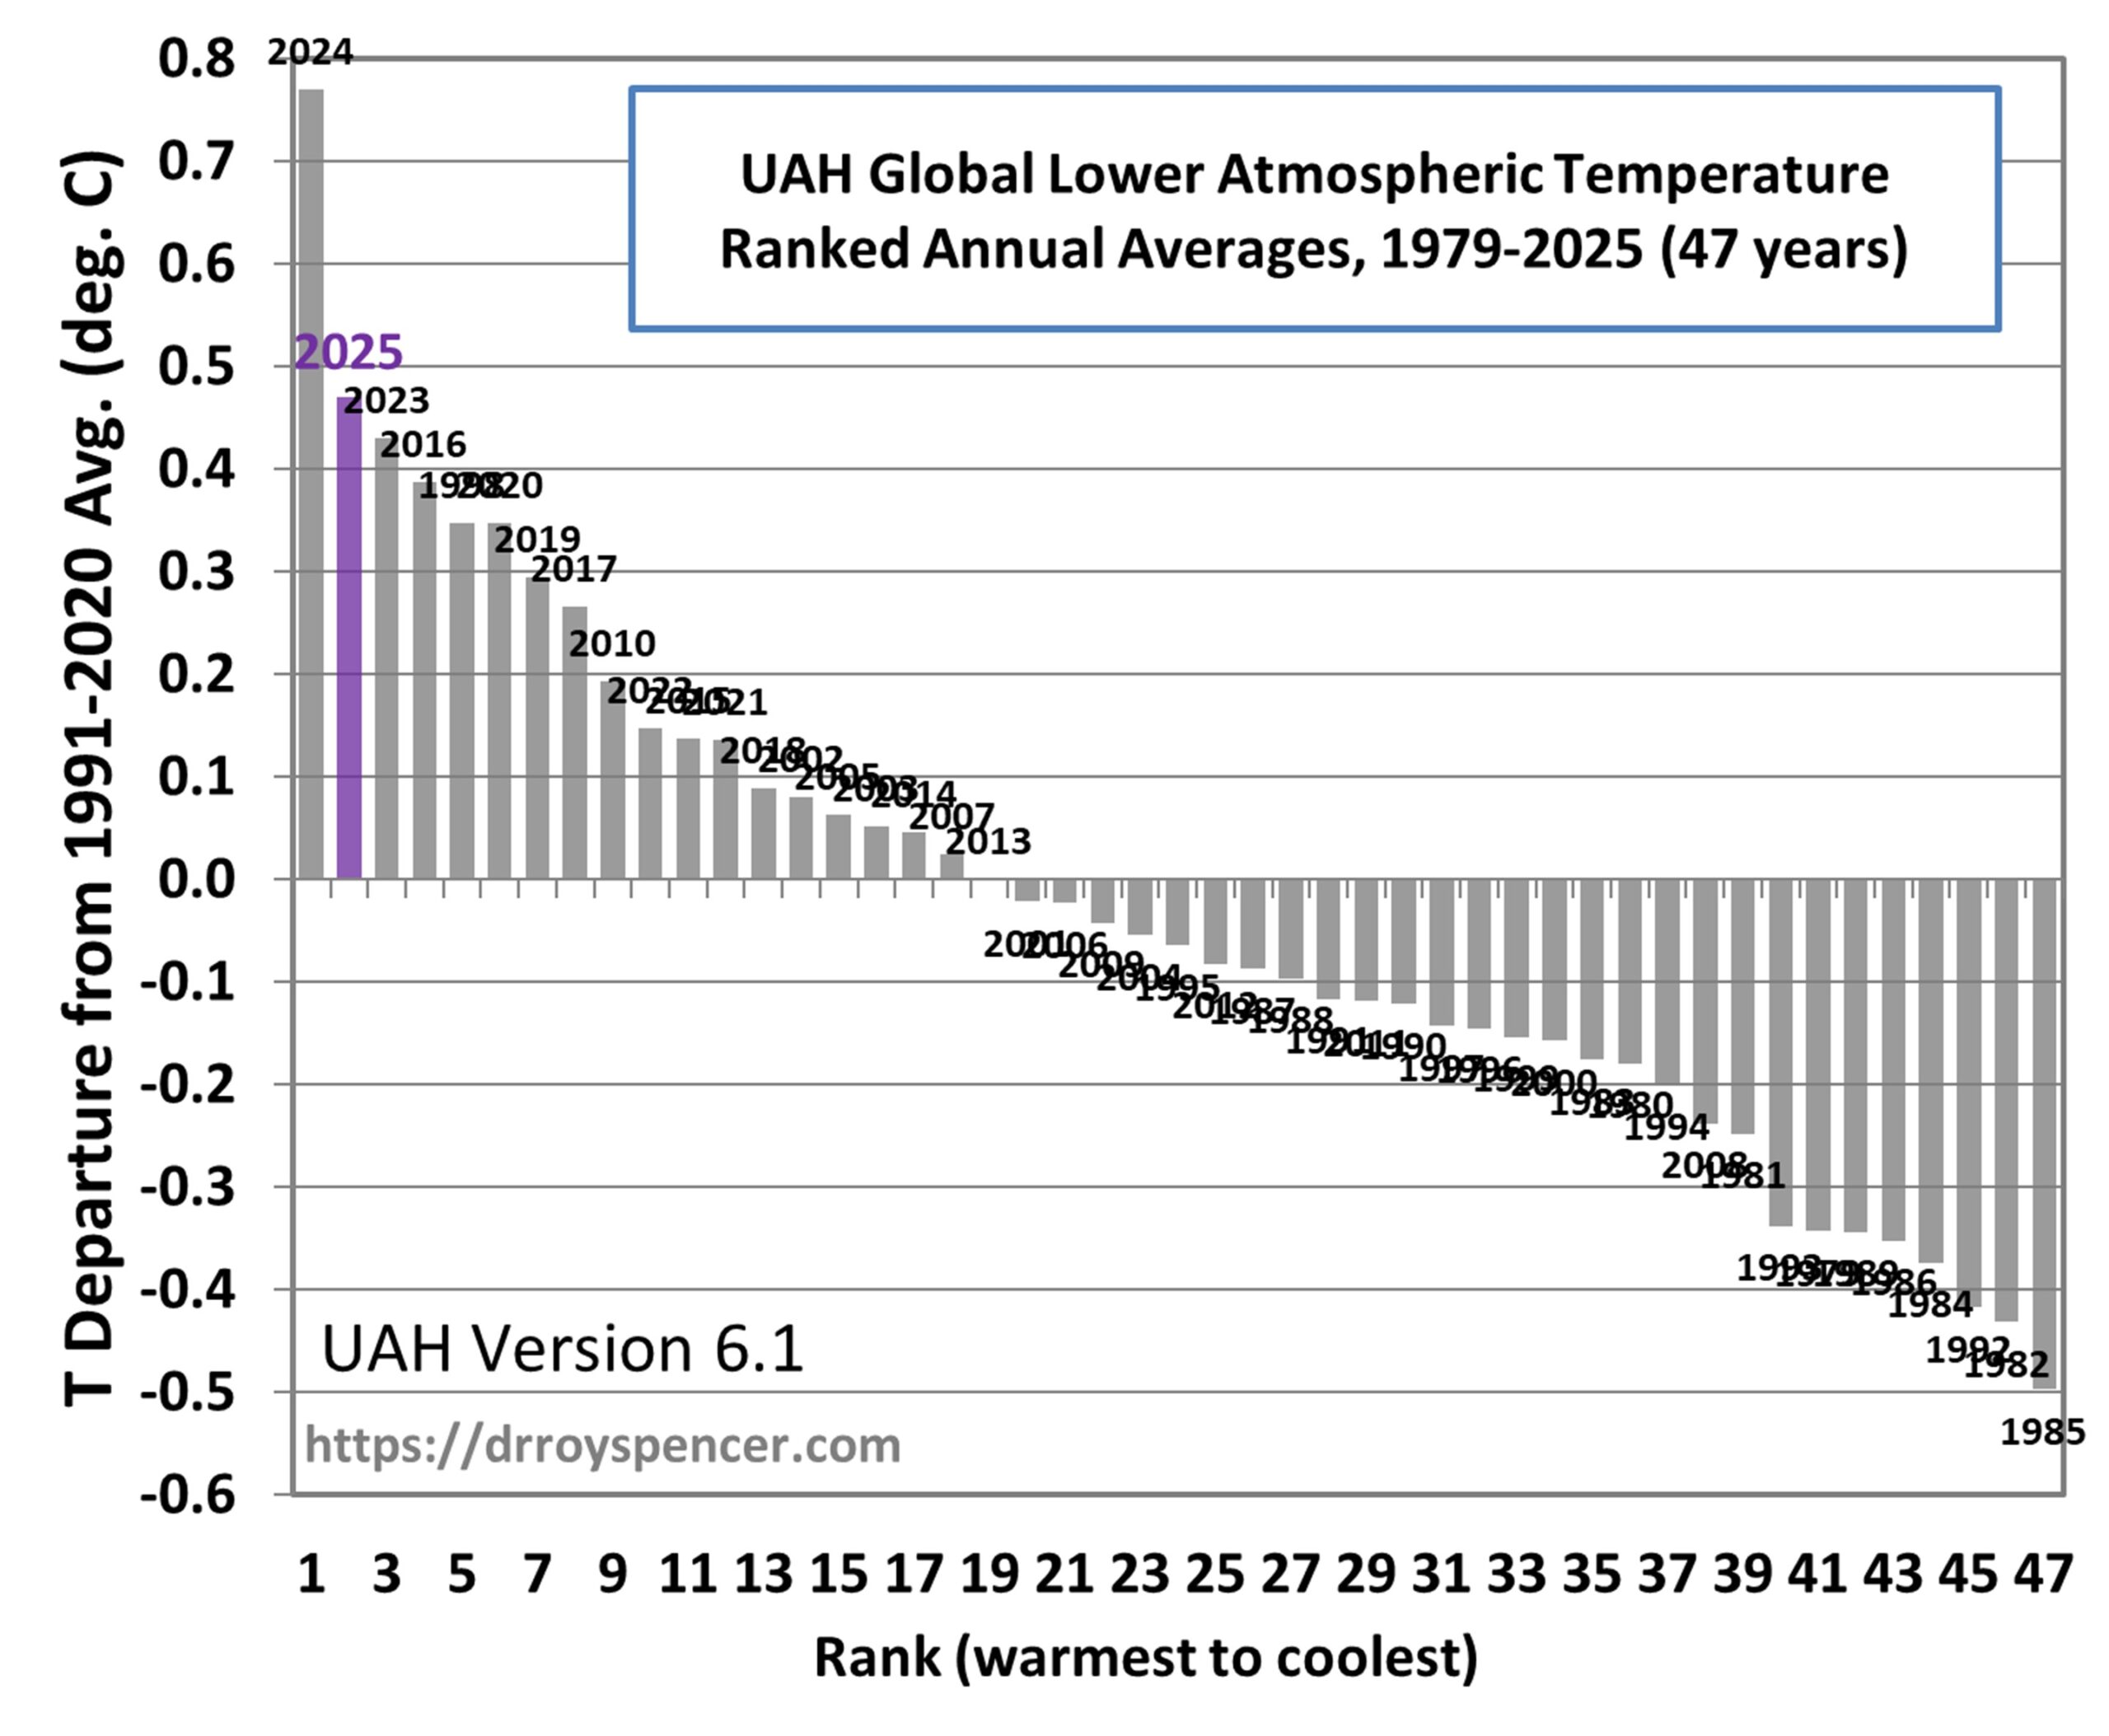
While 1998 does feature in the top ten, it is in a sea of numbers from 2010 – 2025.
If Roy lying too?
I think all the Dictators in the world, Big and small, are taking Trump seriously now.
That’s a very good thing for freedom-loving people.
You think Putin takes Trump seriously? Really? I think he can’t believe his luck.
Cheap Solar Is Transforming Lives and Economies Across Africa
Looks like a growth market for coal…not.
280 million e-bikes are slashing oil demand far more than electric vehicles
Speaking of bikes, let’s add something about sustainable mobility this week. And more liveable cities.
Investing in cycling pays off many times over
Lessons From Europe
Lessons from Europe?
Net zero has net zero chance.
Yeah, let’s not improve live for people in cities – it could be related to net zero.
Depends on what you mean by improving people’s lives. Your authoritarian approach – ie 15 minute gulags etc – is naked neo-feudalism. The serfs will do as they are told – or else.
How about you inform yourself on 15 minute cities before coming to conclusions?
How about you inform yourself on 15 minute cities before coming to conclusions
Let’s inform the one who needs informing…
ROAD blocks stopping most motorists from driving through Oxford city centre will divide the city into six “15 minute” neighbourhoods, a county council travel chief has said.
And he insisted the controversial plan would go ahead whether people liked it or not. – Oxford Mail
Bristol et al installs them in the dead of night under police protection…
‘Sneaky’ Green-led council installs LTNs at 3am under police protection
Cover of darkness used after Bristol residents opposed to the roadblocks had previously protested by lying in front of machinery – The Telegraph
As I said, Your authoritarian approach – ie 15 minute gulags etc – is naked neo-feudalism. The serfs will do as they are told – or else.
Borne out by the facts.
Beside it being a traffic calming messure that has nothing to do with the idea of 15 minute city. I also couldn’t find an official statement from the council linking those two.
From what I found:
What you gave me is more in line with “low traffic neighbourhoods”, “traffic calming” or concepts like superblocks (I think Barcelona is quite famous for that) and not 15-minute cities
You are amusing. People lying in front of construction machinery opposing something, which the councils deliberately ignore, counts for absolutely nothing in your worldview.
What you propose is wholly undemocratic – it’s neo-feudal. Authoritarian. Still want to tango on a pinhead?
What makes you conclude that those of us who disagree with your view of a future dystopia are unfamiliar with the proposal of 15-minute cities? Those who wear ideological blinders are poor judges of the pros and cons of significant social changes. I would be very surprised to discover that anyone has ever accused you of being deep thinker.
Have a look at the actual black-out in Berlin, where 50k households, 2k firms and 3 hospitals enjoy net zero with temps below 0°C and snow.
Biking warms the body, isn’t it?
Btw, it was a terrorist attack.
What? Do I want to know how you relate that to this topic?
Biking warms…
600,000 without power in Moscow the other day- and they’re probably not thrilled about their current low carbon emissions- but of course they won’t dare complain- after all, the Russian government said it had nothing to do with Ukraine drones- just technical problems.
If you think riding around on a bike in the European winter is “improving people’s lives”… roflmao !!
I cycle about as much as I drive, about 3,000 miles per year, each. But I am not young. I can ride 100 miles a day though not very fast. The way most city riders behave I fear I’d be on the ground with broken bones in the first 10 miles if I tried mixing with them at my speed.
Other cyclists are by far the most obnoxious road users I encounter (though to be fair, the pedestrians are in second place, for different reasons). In the last 20 years I’ve had exactly one adverse encounter with a motor vehicle, and it turned out it had been stolen.
Admittedly you only need one adverse encounter with a car to end up dead, but I do not look forward to bicycle-dominated commuting nor doing my grocery shopping by bike in a howling wind.
“the most obnoxious road users”
The Lycra rule: The more Lycra the cyclist is wearing, the more unhinged and self-righteous they are.
I am pleased to say I look like a homeless person.
Well it works in London.
And it really is based on long-term observation; which is why I ended up calling it the Lycra rule.
ha! reminds me of “They Told Ozzy Osbourne “The Driver’s Waiting Area Is Over There” – But He Owned the Jet”
That’s funny! 🙂
..and the least likely to use a designated cycle lane.
You’re correct. I live in a very hilly area with mostly narrow and curving roads – they won’t pull over to the shoulder even if they’re barely making any headway up a steep incline.
Cam on their head and it’s guaranteed they are a full blown psychopath.
I’ve been cycling for 70 years, wearing old shorts and a tea shirt. Why on Earth some people have to have $200 of fancy cycling clothes I never understand. Money to burn I guess and they want to look hot to the opposite sex or whichever they prefer.
Push bike lycra does not make anyone look “hot” !!
If you are unfamiliar with the comic strip Pearls Before Swine, look it up at https://www.gocomics.com/pearlsbeforeswine and search for some panels featuring the ever-unrespected, Lycra-clad, helmet-wearing elitist.
I often see cyclists riding side by side- sometimes 4-5 of them, without enough common sense to stay close to the edge of the road if they hear a car approaching. I’ve had to slow down almost to nothing to get passed them – I usually will blast my horn at them too, once I get passed them. I stay close to the edge of the road when cycling and giver everyone else the right of way.
And a wave. Almost all drivers wave back.
I can count on the fingers of my clenched fist the number of cyclists who acknowledge me in an average week.
I don’t know where you ride, but in the UK the Highway Code (the informal interpretation guide for the Highways Act that every road-user, including pedestrians, cyclists, and horse-riders is suppose to read) was recently revised. It happened under the supervision of Michael Gove, then minister of…something. The revised code was informed by input from the “cycling community”–the ones I described as the most obnoxious road users. They basically weaponised it.
So the conduct you describe is actually recommended now. And don’t they know it!
@MyUsernameReloaded: I think your lead paragraph is fine. A small amount of electricity probably can be very useful in a rural economy. It gives you light (via LEDs) in the evenings and probably news and music via radio. And maybe even TV if you live in range and can scrape up the cash for a set. That should be a pleasant change for areas beyond the reach of power grids. And where cash is scarce. And even if someone strung wires to your village, someone else would probably cut them down and sell the copper.
Your problem is the assumption that those benefits scale to the needs of an advanced industrial society. Solar and/or wind should work fine if you don’t need much power and not having it for a few days from time to time due to weather issues is merely an inconvenience. They are almost certainly going to work increasingly poorly the more dependent the society is on electricity. Do I think solar will work on Pitcairn Island — area about 6 square km, population about 60, no fossil fuel resource, 700km from the nearest neighbors? Probably. Do I think think they will work for Europe, California, or New York? Almost certainly not. For Canada or Siberia? You’re kidding, right?
“It gives you light (via LEDs) in the evenings”
Those are called “Christmas lights”
But no, you cannot run anything from solar at night. !
You could do what liberals are well-known for. You could re-define night.
“Chinese panels are now so affordable that businesses and families are snapping them up, slashing their bills and challenging utilities.”
Did they also buy batteries for nighttime or in the rainy season?
Sure, if I was many miles from the grid- living in a hut, I’d probably get some solar panels too- because out there I don’t need get around or do anything at night. Better than nothing I presume- but I’d be calling for the grid to deliver energy at as low a cost as possible.
But I doubt they’ll be building any factories out there with those toy solar panels.
They sure as hell won’t build them with the coal power plants they have. If you read the article you see that fossils never delivered there. Now PV steps up.
And not everything in africa is off-grid mud huts.
The grid in Africa is almost all powered by fossil fuels, with a bit of Hydro..
Yes, many of them are more substantial buildings without running water or reliable 24/7 power.
E-bikes in Africa? Sure, better than walking. But I bet they’d prefer to have a nice Ford F150 with an ICE engine burning cheap gasoline.
Strange as it sounds, a lot of people find oversized status symbols off-putting. Especially in urban areas.
I was sort of joking- I don’t care for oversized status symbols either- but, they really would prefer the F150 over an E-bike if they have any serious work to do or distance to go- if that was the only choice. I had an F150 and I didn’t care for it- constantly breaking down. I now have a Toyota Tacoma- much better- and better than walking too. 🙂
Cycling? Sounds great- I’ve been cycling for 70 years- BUT- not in nasty weather all too common in much of the world. I have the option of using either my car or pickup. We just don’t want to be forced to depend on cycling. Improving bike lanes in American cities may result in more cycling- that’s OK- but American cities are spread out more than European cities- and nobody is going to cycle to visit their friends 100 miles away. Improved mass transit might help but that’ll take a few generations to develop. Unfortunately, in America, mass transportation is poorly developed thanks to bad governments, greedy unions, and many other reasons. It’s gotta get dependable and cheap for more Americans to want it.
Ever visited the US in winter and tried cycling then? Ever tried cycling to a supermarket anywhere in the US in any season?
Thought not. Let me tell you, you will not do either more than once.
Be proud of your destroyed infrastructure and never do anything to change that.
Cycling in winter is not uncommon in a lot of countries.
Cycling in Oulu – The Winter Cycling Capital
Ever been in Chicago in the winter?
Seems more like a question of gear and compared to Oulu it seems to have a better climate for cycling.
Was that ‘no’?
I can remember once driving east towards Chicago in February, in my then new Subaru; my left arm was getting cold every time a gust of wind hit the car. I had to wad up my coat and put it between me and the door to prevent the wind from getting in. After I got home I took my car to the dealer and complained about the situation and they couldn’t find anything that wasn’t up to spec.
We haven’t even talked about the wind-chill factor and what it does to exposed flesh for those states north of the Mason-Dixon line in Winter. I suspect that MUR doesn’t live in, or even have experience with extreme weather conditions — or chooses to ignore reality.
I remember my parents made the decision to move from Northern Illinois to Phoenix after they had been stranded on the highway for several hours on the way home from a company New Years Eve party in Chicago. My father only had on a sport coat and my mother was in an evening gown. My father hit a patch of glare ice, spun out into a snow bank, and the fuel line froze before he could get the engine re-started.
Certainly not the kind of weather one would want to be pedaling a bike in. I suspect that people like MUR have little experience with the real world. Only with theoretical ’15-minute cities.’
I’m pretty sure Michel is talking about proper, continental winter. Winter where you should think twice about leaving your house.
You don’t get a lot of love on this site but I’ve kept quiet. Your words generally tell us everything we need to know; I don’t need to point out anything to anyone. But this comment, this is special.
He has no idea what a continental winter is like. Chicago, Pittsburgh, Not to mention further west. He should go spend a winter there. To really appreciate it you need a dog. Walk it three times a day, whatever the weather, however you feel. Then you understand, and the idea that anyone would cycle through those winters is stupidity squared.
The Finnish city? Who knows. As Hume said, miracles always happen a long way away and often a long time ago too.
No way I would walk a dog at midday in an Australian summer.. Cruelty.
7-8 in the morning is walkies time. !!
“Cycling in winter is not uncommon in a lot of countries.”
You mean, like Australia ?? 😉
Out of necessity, not choice.
In the Winter, one would need either a full-length raincoat or windbreaker, and in the Summer, a change of clothes for when you get to your destination.
This is all assuming that the elderly population with arthritis, poor balance, and reduced strength can make other arrangements.
Ah so China is now dumping cheap crappy solar panels on Africa.
Fossil fuels are the go to supply of electricity in Africa.
Have you ever tried to ride a bicycle on ice? Or carry the weekly groceries home in a rainstorm on a bicycle? There is often a big difference between what is “possible” and what is practical. Most of our technological innovations have resulted from an attempt to make life more comfortable, less arduous, and provide us with more leisure time. You, and those like you, would have us regress to a time more than a century ago before those labor-saving innovations came to be.
“Looks like a growth market for coal….not”
According to the IEA there are currently 95 coal mining for export projects being undertaken in 13 countries around the world.
14 of these projects are underway in South Africa. 9 new projects, 4 expansions and 1 reopening. I doubt that they are going to give them up.
Remove the Earth’s atmosphere or even just the GHGs and the Earth becomes much like the Moon, no water vapor or clouds, no ice or snow, no oceans, no vegetation, no 30% albedo becoming a barren rock ball, hot^3 (400 K) on the lit side, cold^3 (100 K) on the dark. At Earth’s distance from the Sun space is hot (394 K) not cold (5 K).
That’s NOT what the RGHE theory says.
RGHE theory says “288 K (15 C) w – 255 K (-18 C) w/o = a 33 C colder ice ball Earth.”
255 K assumes w/o case keeps 30% albedo, an assumption akin to criminal fraud. Nobody agrees 288 K is GMST plus it was 15 C in 1896. 288 K is a physical surface measurement. 255 K is a S-B equilibrium calculation at ToA. Apples and potatoes.
Nikolov “Airless Celestial Bodies”
Kramm “Moon as test bed for Earth”
UCLA Diviner lunar mission data
JWST solar shield (391.7 K)
Sky Lab golden awning
ISS HVAC design for lit side of 250 F. (ISS web site)
Astronaut backpack life support w/ AC and cool water tubing underwear. (Space Discovery Center)
RGHE theory joins caloric, luminiferous ether, spontaneous generation, phlogiston, et al in the scientific trash bin of failed theories.
Was this battery fire posted on WUWT? Second fire at this location in New York. Story Tip
https://youtu.be/RJ5JWFebW5w?si=ncimLFeZI7IYs2q_
Found another nice one for you:
Electric vehicles will end oil wars – if we let them
Hahahahahaha.
Petrochemicals.
The dolt who wrote that was wrong in basically every sentence.
A very ignorant far-left supporter of socialist dictators and a climate wonk, who lives every second of his life supported by fossil fuels and their products.
Trump has hopefully freed Venezuela from a brutal dictator who is holding some 800+ political prisoners.
They now have a chance to Make Venezuela Great Again, on the back of oil.. like before the rabid Cuban backed socialists took over.
By the way. Were there any actual oil wars yet?
I mean, oil fields and transportation becoming major objectives in wars (real and planned), sure… but that was about means to deprive the enemy of a vital resource, not an end in itself.
Petrodollar wars, yes… but that was about controlling the market and extracting tax from everyone else (in that emission of fiat currency is but a convenient form of tax). This was not about oil at all. if USA at the time had more serious troubles in Middle East, but had some other important market controlled better, instead of the “petrodollar” there could be something else, but political and military implications would be much the same.
But wars for oil as such? Did it ever happen?
As we write it is close to O°C in the UK – colder in Scotland, a bit higher in the south and west.. Colder at night, a bit warmer during the day. This is the usual blocking high to the south west, which blocks warm air from the Atlantic and allows other systems to bring cold air from the Arctic.
And as we write there are people dying in the UK because they are not turning their heating on, and they are not doing that because they cannot afford to, and they cannot afford to because of the mad net zero policies that have raised UK electricity prices.
85% if UK homes have gas heat. But there are a lot of poorer people who are still using electricity for heating either wholly or as a supplement. Some estimates up to 30%.
There are people in the UK who, as we write, are literally deciding not to turn on their electric kettles to make a cup of hot tea because expense.
Net Zero in the UK: how to close down your gas industry, kill your old and poor, and save the planet, and get that lovely virtuous feeling.
GOODBY GLASGOW-NET ZERO
Glasgow City Council declared a climate emergency in 2019 and pursues ambitious net-zero goals by 2030, ahead of Scotland’s 2045 target, through a revised Climate Plan emphasizing rapid decarbonization. Glasgow aims for net-zero by 2030 via a “Net Zero Route Map” requiring scaled interventions in carbon removal, green jobs, and biodiversity restoration, while addressing fuel poverty and air quality.
Glasgow’s 2030 net-zero target demands an unprecedented acceleration in emissions cuts, building on past progress like a 45.7% reduction from 2006 levels by 2022, but requiring a “sharp increase in the scope, scale, and intensity” of interventions across all sectors.
Achieving this in five years necessitates profound lifestyle shifts: households face mandatory home upgrades disrupting daily routines and budgets, car-dependent residents encounter reduced parking, congestion charges, and Low Emission Zone expansions that penalize non-compliant vehicles, while meat-heavy diets and frequent air travel yield to waste reduction and active travel mandates. Gas boiler phase-outs and building decarbonization will spike energy costs initially, exacerbating fuel poverty without subsidies, forcing urban densification that curtails suburban living and long-distance mobility.
With quick wins exhausted, the plan admits reliance on sequestration alongside cuts, implying rationed consumption in heating, food, and transport to balance the math—transformative changes akin to wartime austerity, where individual freedoms yield to collective planetary imperatives.
This blueprint risks social division, with compliant urban elites thriving in walkable zones while others face rationed heat, meat, and mobility—echoing dystopian controls under the guise of salvation, where personal choices erode for unproven climate gains. Protests in Oxford and elsewhere signal rising backlash against such top-down impositions.
GLASGOW IN FLAMES?
Mass demonstrations erupt as residents, hit by soaring energy bills and vehicle bans, blockade city centers like George Square, mirroring Oxford’s 2023 uprising against 15-minute zoning; clashes with police intensify over Low Emission Zone fines, escalating to riots with arson at EV charging stations and council offices amid fuel poverty riots in winter.
Affluent suburbanites and businesses flee to car-friendly outskirts or England, depopulating Tradeston-like zones; property values crash in densified areas, triggering a brain drain of skilled workers unwilling to endure heat pump retrofits or meat rationing, leaving ghost neighborhoods policed by drones.
Online fury explodes on X and Substack, with #GlasgowNetZeroNightmare trending globally, fueling doxxing of councilors and viral hacks of city apps; non-compliance surges via black-market gas boilers and underground car meets, paralyzing enforcement and forcing policy U-turns or authoritarian crackdowns.
In the worst-case vision of Glasgow’s net-zero trajectory, enforced low-mobility zones, surveillance for compliance, and rationed resources could indeed morph compliant neighborhoods into de facto open-air prisons, trapping the non-elite while exits remain theoretically open but practically gated by fees, fines, and social credit-like penalties.
Congestion charges and LEZ expansions act as invisible bars, pricing out non-EV drivers; drone-monitored active travel paths and smart-city apps track movements, flagging “excess” carbon footprints for audits or restrictions, normalizing a panopticon where leaving your 15-minute pod incurs escalating costs.
Residents face phased lockdowns on heating, flying, and meat via digital allowances, with non-compliance risking blacklisting from jobs or services—freedom preserved on paper, but daily life confined to walkable cages under climate edicts, as mass exodus empties the compliant core.
NET ZERO ANTI-FREE ENTERPRISE
Glasgow’s 2030 net-zero blueprint, with its mandates for zero-emission operations and circular economy enforcement, could effectively strangle free enterprise by layering prohibitive regulations on small businesses and startups.
Regulatory OverloadOwners face compulsory retrofits for heat pumps and insulation, plus bans on gas appliances, ballooning upfront costs that crush margins for independent shops and cafes in zones like Tradeston; non-compliance triggers fines or shutdowns, favoring only subsidized corporate giants with ESG compliance teams.
Market DistortionsCongestion pricing and LEZ expansions deter customers driving in for deliveries or trade, while meat and waste quotas hobble butchers, restaurants, and markets—replacing vibrant local commerce with state-vetted “green” outlets, where innovation yields to bureaucratic carbon audits and digital tracking.
Economic LockdownFreelancers and entrepreneurs abandon risk-taking as Scope 3 emissions rules entangle supply chains in endless reporting, driving survivors into gig servitude under city apps; the end result: a neutered economy where private initiative bows to collective quotas, echoing Soviet-style planning under eco-guise.
Another logic fail:
Colorado color-shifting animals face risks | The Jerusalem Post cries alarm about warming climate harming survival of animals like ptarmigan, snowshoe hares, and weasels.
Well gosh I say, they’ll either die out, move north, or adapt in the long term. That’s nature.
I know the rabbits and weasels in NE BC change colour seasonally, I’ve seen them there many times.
(Humans of course move to adapt to changing climate.)
Other days the flapping is about the Canadian Lynx going extinct in Coloraro, due to development.
Um, why is it called ‘Canadian Lynx’? Because it lives across a huge area to the north, much of that in Canada.
A new ski lodge in CO was burned by eco-terrorists to save the Canadian Lynx. Never mind there will still be much wilderness in Colorado.
Alleged climate goons leave Germans freezing in darkness:
https://www.euronews.com/2026/01/04/45000-homes-in-berlin-without-power-after-politically-motivated-attack-by-left-wing-extrem?utm_source=microsoft&utm_campaign=feeds_news&utm_medium=referral REF climate goons
Climate terrorists have invaded private property in AB and BC to put solar panels on homes of elected officials.
An odd case of terrorism was bombing of an electrical transmission facility on Vancouver Island, as if the leftist group thought the ‘reactance’ power factor balancing system was a nuclear reactor. The ‘Squamish Five’ went on to bomb a defense equipment manufacturing facility in ON. Would be dangerous to bomb a nuclear reactor, though the group were not smart – they slept with old dynamite beside them thus inhaled some dust from it.
Violent people get elected – Stephen Guilbeault trespassed and vandalized in the name of climate, later was Environment Minister of Canada for a while.
‘Pushed to the limit’: Europe’s ski resorts face climate change threat – which country has it worst? | Euronews
Well, gosh, if climate really is warming quickly people will have to go to Finland and Norway to ski?
What did people do in the Medieval Warm Period?
Why they hate Trump and love the Maduros-
FBI & DEA Raid Somali Elites Couple “Luxury Island” in CA — 450 Children Rescued | FBI Files
They should hang.
Is “the Maduros” a new crimestop substitute for “Clintons”?