The UK Met Office’s excuses for its invented temperature data from non-existent stations get more fanciful by the day. Explanation after explanation fails to live up to rigorous examination, with statutory Freedom of Information (FOI) requests leading to frequent rewriting and new things to believe before breakfast. Data from non-existent stations are obtained from well-correlated neighbouring stations (WCNS) the Met Office told us, but there were no well-correlated neighbouring stations at Lowestoft, which had itself been closed since 2010. Via a new FOI, the Daily Sceptic sought details about these invisible WCNSs at Lowestoft and has been told, “We do not use well-correlated neighbours in this case.”
Well we kind of knew that all along, due to the fact that citizen sleuth Ray Sanders couldn’t find any in the first place. For closed stations on its historic station database the new FOI explanation is: “We used the gridded value from the closest grid point from our version controlled UK climate data set HADUK-Grid.” The suspicious might note that the HADUK-Grid uses WCNS data derived from the Met Office’s Integrated Data Archive System (MIDAS) in modelling infill data for closed stations. This is said to address gaps caused by stations opening or closing, “ensuring consistent national coverage for monitoring and research”.
In effect the Met Office is no further along in its explanations. It is simply excusing its inability to justify its invented numbers at Lowestoft by passing the buck to a computer programme that uses the ‘well-correlated neighbouring stations’ that it is unable to identify.
The Met Office is not completely stupid. When doubts arose about the figures at Lowestoft and two other closed stations at Nairn and Paisley, it hastily withdrew large chunks of data relating to the periods when the stations did not exist. But it was obvious that this could lead to questions being asked about misleading data cascading through the entire Met Office temperature database. Using the data that have had to be withdrawn from public view as WCNS input would have quickly corrupted estimates elsewhere and required a major cleaning of vast amounts of related data. What if all of the data were found at some point to be corrupted by dubious figures that could no longer be shown to the public? Invented data from invented data is hardly a good look, even in science, media and academic circles desperate for ‘highest evah’ official figures to boost the Net Zero fantasy. Happily this will not be necessary since the publicly-available historic database now states:
The purpose of this webpage is to provide a sample of historical station data across the UK for general interest. It is not used for formal climate monitoring.
What a relief. Curiously, a check from a few weeks back on the Wayback Machine shows the same page but without this particular notification. Also missing from the past edition is a note that the stations shown comprise “only a small fraction of the full UK climate network”. The remainder would be the data and statistics for other unpublicised stations “and associated charges” that can be obtained from the Met Office’s Customer Centre. Meanwhile on the latest page, five stations are now admitted to have been closed, namely Lowestoft, Paisley, Nairn, Southampton and Ringway.
This is not the first time that the Met Office has had to hastily rewrite explanations on its publicly available temperature databases. Earlier Ray Sanders investigations revealed that more than a third – 103 of 302 – stations listed with individual coordinates and elevations and supplying long-term averages did not exist. As a result, the Met Office changed the name of the database called ‘UK climate averages’ to ‘Location-specific long-term averages’. The original suggestion that selecting a climate station can provide a 30-year average from 1991-2020 – a claim available to view on Wayback – was replaced with the explanation that this page “is designed to display locations that provide even geographical coverage of the UK, but it is not reflective of every weather station that has existed or the current Met Office observation network”.
Of course those with a cynical mind jumped to the conclusion that the Met Office solved its problem of inventing data from invented stations by suggesting that the data now arose from “locations” which may or may not bear any relation to stations that once existed, or indeed exist today. Enter Science Feedback into the fray with a feeble ‘fact-check’ last December that found the reports by Ray Sanders and his Tallbloke Talkshop blog along with the Daily Sceptic were “misleading”. The average data presented by the Met Office for specific weather stations that have closed are not “fabricated”, it concluded: “They are estimated using [wait for it] well-correlated neighbouring stations.”
At the time the WCNS argument started to fall apart. Sanders noted that the Cawood station in Yorkshire was a pristine Class 1 site designated by the World Meteorological Organisation as providing uncorrupted data over a large area going back to 1959. But no rolling 30-year average for Cawood is provided. Instead the Met Office flags data for five other sites between two and 27 miles distant. Unlike Cawood, all of these have average data despite the fact that four no longer exist and the fifth, High Mowthorpe, is 27 miles away and at a 163 metres higher elevation. Quite why the Met Office should ignore an excellent set of readings from Cawood and rely on inventions and far distant temperature readings must remain a mystery. For Ray Sanders the term ‘smoke and mirrors’ came to mind.
And of course we hardly need reminding that pristine Class 1 sites are as rare as hen’s teeth in the Met Office’s near 400 temperature station nationwide network. A recent FOI from the Daily Sceptic revealed that over 80% of the stations, constituting the bedrock of all Met Office data and claims, were sited in junk Classes 4 and 5 with ‘uncertainties’ of 2°C and 5°C respectively. Over the course of 18 months the junk percentage had actually risen, while in the same period the number of Class 1 sites fell from 24 to 19.
The Met Office regularly ‘updates’ its explanations for how it compiles temperature data in the UK. As a service to readers we will attempt to keep abreast of all future changes. Watch this space.
Chris Morrison is the Daily Sceptic’s Environment Editor. Follow him on X.
The Met Office, as very expensive jokes go, is most unfunny. Once we used to get the weather forecast as best as they could provide it. But since the MO plunged headlong into the climate alarmist revolution down in Exeter we now get incessant “Amber warnings” etc about rain, lack of rain, you name it, it needs an amber warning of some sort.
Hurricane Michael Fish (1980s)

Painting by numbers.
The photo on the right is accurate.
They just forgot to add a hammer and a sickle to all the red stuff.
( and England is quite famous for having the most devastating 20degrees Celsius heatwaves on earth. )
I was on night shift in October 1987 when the MO, Michael and the BBC got it horribly wrong… Quite the night.
Near Hastings, we had our in-laws visiting and though my children slept unaware through the racket, our parents sat in the living fully dressed in their coats under the chimney with a packed suitcase at hand. They had been in the 1953 flooding disaster in the Zeeland province of the Netherlands and knew that the chimney is the last thing that comes down. Quite a night indeed.
I worked at the Stag Brewery in Mortlake – near Richmond. There was a lot of building work going on at the time and I saw oil drums flying through the air, the perimeter fences blown away and the huge cranes wobbling back and forth in a most alarming fashion. The power went off around 2am so I wrote a log and decided to head home. It took hours getting around all the fallen trees.
I slept through it. Genuinely. I was surprised to find the devastation the following morning, and I had to re-route my journey to work 3 times for fallen trees.
Heavy sleeper! I’m glad I experienced it, a real once in a lifetime event.
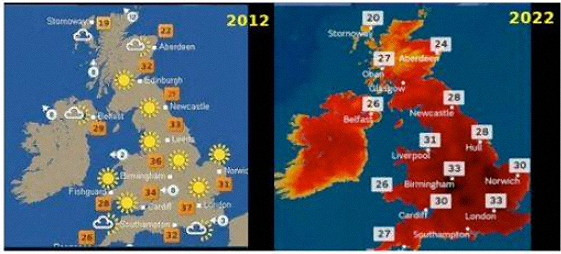
And just recently, 40C.
https://en.wikipedia.org/wiki/2022_United_Kingdom_heatwaves
Thx Edward.
Three RAAF Typhoons took of at that exact moment. The “weather” site s half way down the runway.
All other places that measured high temperatures that day were Class 5 JUNK sites.
JUNK surface sites are the way the UK Met Office works.. that have precious little else left.
Wrong link.
https://www.metoffice.gov.uk/about-us/news-and-media/media-centre/weather-and-climate-news/2025/met-office-report-details-rising-likelihood-of-uk-hot-days
Rising likelihood predictions from wacked-out, fake, anti-science models.
Of course… they will make sure their sites are JUNK enough to make that happen. !
You forgot the other site which recorded 40C that day – Heathrow Airport. Coincidence? I think not.
What is a heatwave?
The World Meteorological Organization defines it as five or more consecutive days during which the daily maximum temperature surpasses the average maximum temperature by 5 °C (9 °F) or more.
https://www.iipa.org.in/cms/public/uploads/222841610370027.pdf
UK met office no longer use the WMO definition, in 2018 they changed it to:
“A UK heatwave threshold is met when a location records a period of at least three consecutive days with daily maximum temperatures meeting or exceeding the heatwave temperature threshold, dependant on location.” (currently that is just 28ºC max, and no minimum duration)
https://www.metoffice.gov.uk/weather/learn-about/weather/types-of-weather/temperature/heatwave
Clearly this is so they can claim that heatwaves occur more frequently, which is an obvious lie if they have to change the definition to make that claim. Of course, this also means they can claim “hottest since records began”, as a new record started with the definition change. The Met office are all in on the globalist’s “climate crisis” scam, designed to rob you of your freedoms and tax you based on the vagaries of the weather. I’m reasonably sure the UK has not seen a heatwave meeting the WMO definition for many years, maybe decades and CERTAINLY NOT this year. We have seen nothing outside of natural variability, the temperature is NOT driven by CO2
28 degrees C – we are all going to die.
I was living In Broadstairs in East Kent at the time, and I have a vivid memory of looking out of the window that night and seeing the mature flowering cherry trees which lined Gladstone Road bent through 90 degrees by the hurricane-force wind as large, heavy items like lawnmowers were blown down the street.
Of course the Met Office don’t want you to know the Cawood data. Something close to the truth is not a record to the Met Office’s liking.
The two biggest institutional failures are the BBC and the MO – and they work hand in glove.
Had a “denier” been caught falsifying the record the BBC would have been all over it. If you want a face to put alongside the disease (in the BBC) then think Nick Robinson.
He claimed Davie and Turness were victims of a right-wing putsch at the BBC.
And the BBC still haven’t revealed the names or sacked the activists involved with the Trump disinformation
Surprised some enterprising person hasn’t graphed the Cawood data against the so-called UK average. Surely it would show the same general trend….?
or not…..
Funnily enough….there is this chap called Ray Sanders who is doing exactly that. This is the sort of thing he has come up with so far
https://tallbloke.wordpress.com/2025/08/14/wye-addendum-a-detailed-look-at-what-the-actual-data-tells-us/
Smart fella that Ray!!!.
Please help me understand why the Met Office has not undertaken a program to ensure all 400 weather stations are class #1. This should be relatively cheap when compared to a few offshore wind turbines
#1. Money is needed for supercomputer after supercomputer (and more amber warnings).
“The Met Office has flipped the switch on a new supercomputer running on Microsoft Azure, which promises improved forecasts and enables climate research.” – Think Digital
#2. The above just requires any old numbers the MO cares to invent, sorry, extrapolate.
Nope.. In fact, they seem to go out of their way to make sure new sites are Class 3 or worse.
They need those Class 4, 5 + sites as part of their agenda.
I don’t know if anyone realizes that poor sites are one reason the U.S. stopped using so many observer stations. It is also why the CRN network was established. Good siting, good maintainence, and good equipment. Temperatures still have a ±0.3°C uncertainy.
This is the best explanation I could come up with.
How horribly unscientific this all is.
For decades I have accused The Establishment of promoting poor science in matters of Climate Change. The public perception of proper science has been damaged. What better example supports this claim than the meat ion the article above with the work of Ray Sanders and other neutral investigators. We read of the degradation of science with words like these from the article.
“In effect the Met Office is no further along in its explanations. It is simply excusing its inability to justify its invented numbers at Lowestoft by passing the buck to a computer programme that uses the ‘well-correlated neighbouring stations’ that it is unable to identify.”
Why is this poor science? Apart from the obvious reasons, the Met Office often uses uncertainty estimates to give temperature data a sciency look. The definitive text on uncertainty is from the International Bureau of Weights and Measures, whose Guide to Uncertainty in Measurement is abbreviated GUM.
There is no part of GUM to describe how it should be applied to made-up numbers, guesses, interpolated numbers, averages and so on. GUM deals only with original observations, such as measurements from decades ago when observers wrote the original on paper.
So, for the “hard” scientist, there is no valid classification of stations from poor to good based on uncertainty estimates. there is NO TEXT BOOK on the measurement of uncertainty of guesses. Nor should there be.
Geoff S
Not even under the old “error” paradigm can one justify guesses.
I followed the link to the UKMO ‘Historic Station Data‘ page and downloaded the two Northern Ireland sites they feature there; Ballypatrick Forest on the north coast and Armagh, which is inland in a central location. (They happen to be second and third on the UK list, which is alphabetical.)
They have a shared period of coverage from July 1961, with a few months missing here and there. Using tavg, calculated from (tmin+tmax)/2, I ran a linear trend in Excel for both series from 07/1961 to 10/2025. Ballypatrick warmed at a rate of +0.30C per decade and Armagh warmed at a rate of +0.26C/dec over that period, giving an average warming between them of +0.28C per decade.
I compared this to the UKMO official (i.e., ‘quality controlled’ ) record for Northern Ireland, which includes several more long-term stations (Aldergrove, for example) and found a tavg from 07/1961 – 10/2025 of… +0.28C per decade. Exactly the same as the average of the two historical sites over the same period.
You don’t need many stations in any particular region to get a reasonable estimate of climatic changes over time. If the Met Office just used the ‘pristine’ stations and ignored all the others that require extrapolation, etc, it would make not one jot of difference to the observable fact that the UK is getting warmer.
“would make not one jot of difference to the observable fact that the UK is getting warmer.”
Night time is certainly warmer…
“Night time is certainly warmer…” possibly or possibly not.
https://tallbloke.wordpress.com/2025/09/15/why-winter-night-time-minimums-are-increasing/
Recommended reading: How to Lie with Statistics by Darrell Huff
Statistics only get described as ‘lies’ when they contradict your beliefs.
From NOAA: (National Oceanic and Atmospheric Administration)
“The minimum temperature trend outcomes after 1985 climb significantly faster than do the maximum measured temperature trend outcomes. Since the average temperature is not a measured value but instead the calculated mathematical average of the minimum and maximum measured temperatures {(TMax + TMin)/2} the average temperature calculated trend outcome is controlled and dominated by the much larger increase occurring in the minimum measured temperature trend versus the maximum measured temperature trend.”
Try reading this to understand the issue
https://tallbloke.wordpress.com/2025/07/23/the-reification-of-averages-part-one-how-the-met-office-manipulates-measurements/
53% of statistics are completely made up.
tavg is worthless for any location subject to the heat island effect, and it’s disingenuous at least to invoke it.
Taverage is an invalid number for statistical and proper scientific use. This is because the factors that determine Tmax and Tmin are not the same. There are significant, important exceptions, but in general Tmax is triggered on a typical old MaxMin LIG thermometer when the heating effect from sunlight reaches a maximum. The Tmin is triggered when the cooling that follows daily loss of sunshine decays to its lowest value. Note that both Tmax and Tmin are strongly affected by clouds, but in different ways.
One should not average numbers with such different origins. I have looked for an analogy. The velocity of an aircraft can be measured as both speed over the ground and speed relative to the air around it. Both have particular uses for navigation, but nobody takes their average.
Geoff S
Exactly – a graphic explanation
https://tallbloke.wordpress.com/2025/03/10/comparing-temperatures-past-and-present-some-quality-data-analysis-from-an-interesting-angle/
Over the period you looked at, what was the per decade change for tmax . . . and what was it for tmin?
I provided a link to the data.
Arctic ice at 11 year high. Record snowfall in many places. It’s getting colder.
Arctic sea ice is far below average for the time of year.
A child could check these things in seconds.
So what !!
There is far more sea ice in the Arctic now than there has been for most of the last 10,000 years.
You really have to stop getting hysterical about minor fluctuations.
Current extent is above that of 2016.
https://yaleclimateconnections.org/2025/10/scientists-get-a-shocking-glimpse-of-arctic-climate-change/
“We saw vast pools of meltwater, so we would ordinarily never expect to see water in its liquid form in the middle of winter in Svalbard. … We usually encounter a deep snowpack of maybe a meter or two meters … that covers the whole tundra and covers all of the mountains and covers all of the glaciers.”
It’s all part of the elite master plan, right? Those shadowy leftists using their weather manipulating super technology to melt glaciers in the Arctic, all so they can keep pushing the global warming hoax! Wake up, people!
1922…
“Wake up, people!”
We are awake…
It is you that is stuck in a brain-washed miasma of climate unawaremess and climate history denial.
I get second hand embarrassment watching these ‘skeptics’ reply to your comments like they’ve actually refuted anything.
Its embarrassing to watch climate hysterics ignoring climate history.
Or just being plane IGNORANT about how much Arctic sea ice there still is up there compare to most of the last 10,000 years.
That should go along nicely with your first-hand gullibility.
I noticed you didn’t indicate the uncertainty that is inherent in your mean. Also, are the temperatures recorded to the one-hundreths of a degree? If not, you are quoting resolution that was not measured. That would be a typical climate science operation.
At the moment, I have 3 $20 bills in my wallet.
If I took one of them and tore up into 20 (roughly) equal sized pieces an then put one of those pieces back into my wallet, my wallet would not contain $21.
In Cli-Sci analysis, maybe it would. But my bank or my local grocery store would not agree.
DANG!
That should be $41!
(If I was a Cli-Scientist, no one would have noticed or said anything if they did..)
Armagh DCNN9336 – The UK’s longest running weather station – and a very poor one at that. | Tallbloke’s Talkshop
Class 4 hardly “pristine”
Ballypatrick Forest DCNN9168, DCNN 9169 WMO03916 – Totally unacceptable behaviour by the Met Office. | Tallbloke’s Talkshop
“Removable” plantation forest, and site providence is highly questionable.
One site, not too far away, is near “pristine”
That site in Valentia.
Data from there shows that the1930s, 40s were warmer on average than the first two decades of the 2000’s. (blue data)
There is absolutely zero CO2 warming signature in that data.
Just like there is no CO2 warming signal in the UAH data… or anywhere else on the planet..
Human CO2 forced “warming” is a MYTH. !!
“I compared this to the UKMO official (i.e., ‘quality controlled’ ) record for Northern Ireland, . . . . and found a tavg from 07/1961 – 10/2025 of… +0.28C per decade. Exactly the same as the average of the two historical sites over the same period.
You don’t need many stations in any particular region to get a reasonable estimate of climatic changes over time.”
It is a common logical fallacy to make a sweeping generalisation on the basis of one particular instance. All you’ve got there is a coincidence, not a correlation.
And saying that UKMO data is “quality controlled” is totally laughable. !!
It should be called the mid-range value: https://en.wikipedia.org/wiki/Mid-range
It would have been more informative had you plotted Tmax and Tmin individually and determined the slope for each.
Really? Have you checked out the 380 post of reviews I have made including every weather station you named? This is what you get when you use quality stations not junk. FACTS
https://tallbloke.wordpress.com/2025/08/14/wye-addendum-a-detailed-look-at-what-the-actual-data-tells-us/
Read my report on Ballypatrick Forest then come back to me with your apologies for your knowing nothing at all.
https://tallbloke.wordpress.com/2025/08/30/ballypatrick-forest-dcnn9168-dcnn-9169-wmo03916-totally-unacceptable-behaviour-by-the-met-office/
I know the BBC and the Met Office parted company a few years back once the BBC felt it could convey the ‘messages’ about climate conditions better by itself. Maybe they could get some pointers on how to splice actual data together?
Since that split, the BBC have made some impressive video coverage of things it wishes to project.
They even get David Attenborough to voice over the ones it really wants to push.
Here is a suggested voice over from a recent Panorama production, I would not have been surprised to hear.
“And there, commanding the high ground is the big beast, self assured though wounded, standing proud but forlornly realising, his pack are doomed without his presence there to lead them.. no matter, his efforts to maintain control over the pack leads to a call to arms,….it didn’t end well”….
BBC reunites with Met Office for weather forecasts…
https://www.bbc.co.uk/news/articles/crm4z8mple3o
Ahh yes thanks for the link, that Tim Davie knows how to tell em. I particularly like his concept of turning science into stories???? 🙂
That’s a turn about…
Their usual “climate” practice is to pretend fairy-tales and fantasies are “science”
This is a clear case where the MetOffice needs to be sued for ‘wilful practice of defrauding the UK taxpayer betraying every single good practice for weather station maintenance imaginable’. Alongside that, a parallel trial for criminal practices should be prosecuted against the entirety of Current and Former Senior Management since 2010.
The aim should be to bankrupt the Met Office and send at least 50 of its senior criminals to jail.
If only we could blast it out of the airlock.
Nuke the site from orbit. Only way to be sure.
As corrupt as the government .
“The Met Office is not completely stupid.”
Which bits are missing ??
They are working on it !!
Why do NOAA/NASA/MET feel the need to ‘report’ data from a weather station that no longer reports data.
If a company went out to business, they would not keep report profit/loss/production data/employment etc.
If a business or person moves that is a new address, they don’t keep using the old address but the MET/NOAA/NASA keeps using the old location/station (and attemps to alter the data to match)
It just can’t be said often enough, get the government out of this business. What the Met is doing is criminal, fire all managers of the Met, fire all government department heads responsible for the Met. Accept only class 1 and 2 weather stations for official records and reporting, any violation of this rule is grounds for immediate dismissal and punishment. Let the chips fall where they may. This whole mess is disgraceful.
“They are estimated using [wait for it] well-correlated neighbouring stations.”
In other words, using predictions to calculate predictions. Are they weighting the predicted values of the closed stations with the Coefficient of Determination (r^2)?
Needs to take the same trajectory as what the BBC will be going.
According to Grok:
MO Total Budget £1.2 billion
Observing Network £5–10 million
Messaging/Public Outreach £40–50 million
Climate modeling/research £480 million
Anyone surprised?