From Dr. Roy Spencer’s Global Warming Blog.
by Roy W. Spencer, Ph. D.
The Version 6.1 global average lower tropospheric temperature (LT) anomaly for January, 2025 was +0.46 deg. C departure from the 1991-2020 mean, down substantially from the December, 2024 anomaly of +0.62 deg. Most of this cooling was over the global oceans.

The Version 6.1 global area-averaged temperature trend (January 1979 through January 2025) remains at +0.15 deg/ C/decade (+0.22 C/decade over land, +0.13 C/decade over oceans).
The following table lists various regional Version 6.1 LT departures from the 30-year (1991-2020) average for the last 13 months (record highs are in red).
| YEAR | MO | GLOBE | NHEM. | SHEM. | TROPIC | USA48 | ARCTIC | AUST |
| 2024 | Jan | +0.80 | +1.02 | +0.58 | +1.20 | -0.19 | +0.40 | +1.12 |
| 2024 | Feb | +0.88 | +0.95 | +0.81 | +1.17 | +1.31 | +0.86 | +1.16 |
| 2024 | Mar | +0.88 | +0.96 | +0.80 | +1.26 | +0.22 | +1.05 | +1.34 |
| 2024 | Apr | +0.94 | +1.12 | +0.77 | +1.15 | +0.86 | +0.88 | +0.54 |
| 2024 | May | +0.78 | +0.77 | +0.78 | +1.20 | +0.05 | +0.20 | +0.53 |
| 2024 | June | +0.69 | +0.78 | +0.60 | +0.85 | +1.37 | +0.64 | +0.91 |
| 2024 | July | +0.74 | +0.86 | +0.61 | +0.97 | +0.44 | +0.56 | -0.07 |
| 2024 | Aug | +0.76 | +0.82 | +0.70 | +0.75 | +0.41 | +0.88 | +1.75 |
| 2024 | Sep | +0.81 | +1.04 | +0.58 | +0.82 | +1.31 | +1.48 | +0.98 |
| 2024 | Oct | +0.75 | +0.89 | +0.61 | +0.64 | +1.90 | +0.81 | +1.09 |
| 2024 | Nov | +0.64 | +0.88 | +0.41 | +0.53 | +1.12 | +0.79 | +1.00 |
| 2024 | Dec | +0.62 | +0.76 | +0.48 | +0.53 | +1.42 | +1.12 | +1.54 |
| 2025 | Jan | +0.46 | +0.70 | +0.21 | +0.24 | -1.06 | +0.74 | +0.48 |
The full UAH Global Temperature Report, along with the LT global gridpoint anomaly image for January, 2025, and a more detailed analysis by John Christy, should be available within the next several days here.
The monthly anomalies for various regions for the four deep layers we monitor from satellites will be available in the next several days at the following locations:
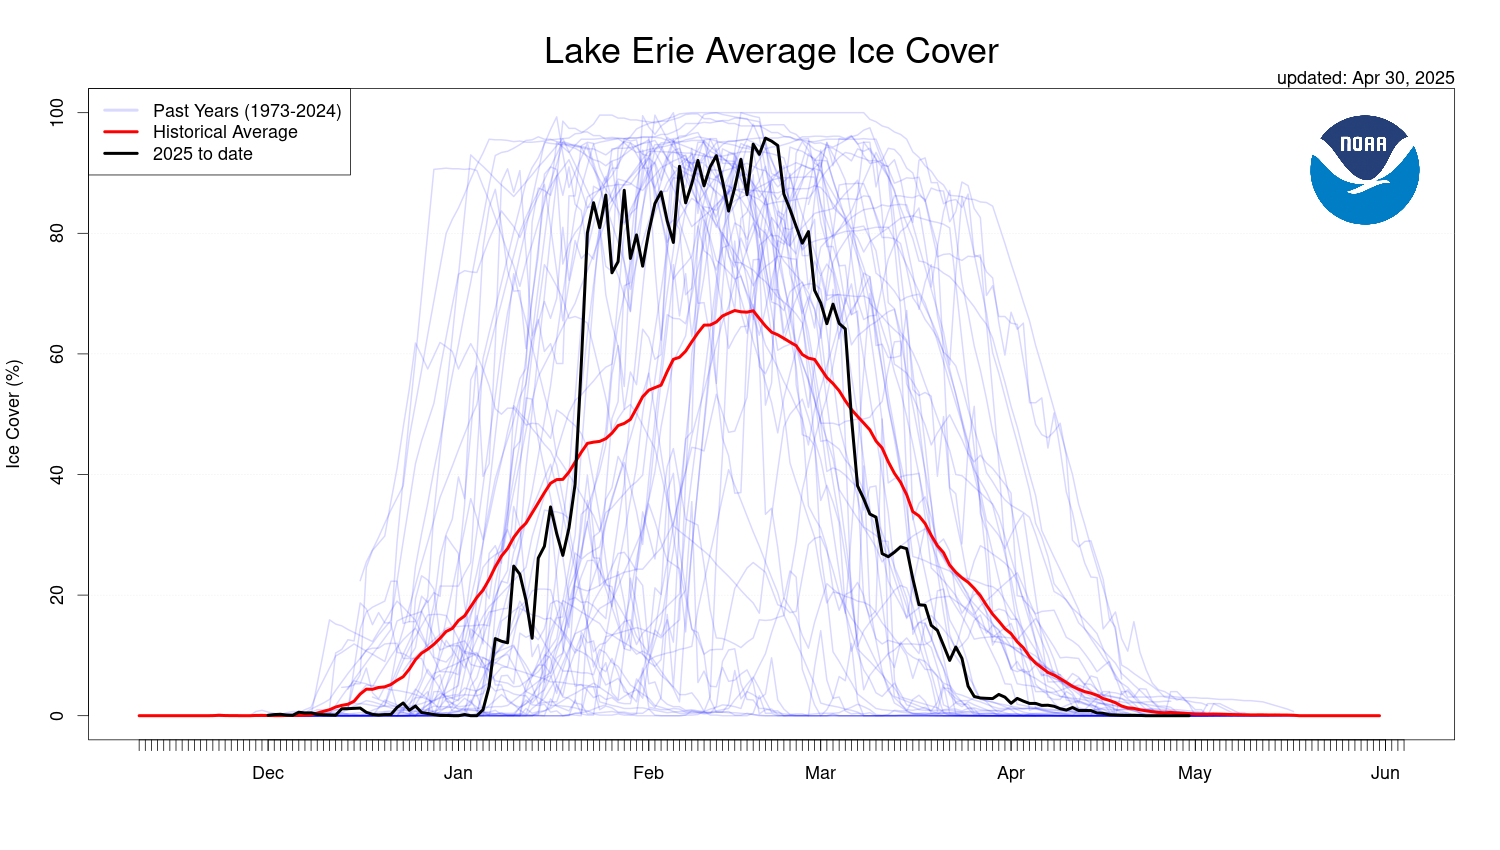
but still hottest evah? (lake erie ice coverage is way above normal too)
Started late but fast and strong
Several cooling influences are now at work or soon will be:
None of this has anything to do with anthropogenic greenbouse-gas forcing, which continues to increase near-linearly at 1/30th W/m^2/year as it has since IPeCaC’s First Assessment Report in 1990.
It is also possible that the substantial global brightening since the mid-1970s, which is on its own sufficient to account for all the global warming observed over the period, will diminish in the coming decade.
If so, in a few years The Pause will be back.
It would be quite remarkable if we did not get another 5+ year pause considering how warm the last two years have been. That’s the nature of short term trends over fluctuating data (drawn by ruler monkeys as some here would say).
In the meantime – the short term trend since the start of the old pause (a period of ten years) is currently over twice that of the long term trend.
According to AI, you might be confusing the temperature of a witch’s tits with weather.
YES, this is regression (or reversion) to the mean,* a principle of statistics applied to time-series data, that everyone should be exposed to!
*https://en.wikipedia.org/wiki/Regression_toward_the_mean
As applied to the evolution of the universe?
As applied to the aging of our Sun?
As applied to climate (do we or don’t we consider Ice Ages and hot house Earth periods lasting hundreds of million of years)?
As applied to human bodies as they age?
As applied to taxes?
“There are three kinds of lies: lies, damned lies, and statistics.”
— attributed to Mark Twain, but true origin unknown
Sure, Death & Taxes are pretty well a certainty, without leaping right to millennia & beyond to ‘hundreds of millions of years‘ where the inferential train is much thinner …
… but it should be clear (all sophistry aside) that one is faced here with a series of ‘fluctuations‘ from a recent trendline, [this an acknowledgement to the pun offered today by Dr Roy Spencer in response to same] …
… and where there are fluctuations one should very well be ‘dissipation(s)’, the larger the fluctuation the more the subsequent dissipation.*
So, YES, all predictions, especially those concerning the future (Yogi principle), are iffy, but as to what one should reasonably expect …
… ‘regression toward the mean‘ is a much neglected pattern-principle as compared, for example, to the now-fashionable ‘tipping points’ thinking.
Regards, — RLW
p.s. for situations where ‘fluctuation-dissipation’ is especially well established, the highly motivated student may benefit from this:
https://en.wikipedia.org/wiki/Fluctuation%E2%80%93dissipation_theorem
Would that be the mean trend… or the mean mean? 😉
Thanks, point (or pun) well taken. To which, here’s a concession to Mr. ‘ToldYouSo‘ skeptical-absolutism response to same:
“… but it should be clear (all sophistry aside) that one is faced here with a series of ‘fluctuations‘ from a recent trendline, [this an acknowledgement to the pun offered today by Dr Roy Spencer in response to same] …”. [emphasis in bold added]
So, in this context, deviations (or ‘fluctuations’) from a ‘mean trend’ is reasonably expected to lead to a reversion toward, if not beyond, that same ‘mean trend’.
Cheers, — RLW
Beginning at the coldest spot since the end of the Little Ice Age and covering the rising portion of a generally cyclical warming/cooling period, a 45-year temperature trend of 1.5 degrees C per decade is hardly a reason to destroy one’s livelihood. It is past time to “Trump-out” Leftist CliSciFi and Nut-Zero.
Actual measurements (observations) reflected in NOAA, RSS and UAH6 satellites and radiosonde results destroy CliSciFi theory and modeling. There is no measurable tropospheric Hot Spot as demanded by the Enhanced Greenhouse Theory (a small CO2 forcing driving significant water vapor warming in the atmosphere) and the General Circulation Models are consistently proven to be inaccurate and run too hot.
It is now time for the Leftists and Marxists among us to spout the current elitist narrative.
By “temperature trend of 1.5 degrees C per decade“, one presumes you meant ‘per century‘ or equivalently ‘0.15 degrees C per decade’, no?
”a 45-year temperature trend of 1.5 degrees C per decade”
What, where?
But the drop shows the recent warm had absolutely nothing to do with anything humans have done.
A totally natural, somewhat extended El Nino event, exacerbated by the HT eruption.
No human causation whatsoever.
Hunga Tunga plus? Something beyond Hunga Tunga caused the very rapid ocean warming, and now the cooling. There is more to our climate then we concurrently know, and CO2 had nothing to do with the oceans warming and now cooling at a rapid pace.
Interesting to note that the Tropics has dropped to below what it was in May 2023 when the El Nino started.
Great to see you posting here, sir!
Yep. Many of us have been predicting exactly that even before your previous pause had ended. It is an inevitable consequence of superimposing short term variability onto a long term trend.
BTW…using your preferred method UAH shows 0.45 C of warming since 2013/08. So I’m curious…what do you think happened to that 0.5 C of cooling prediction from August of 2013?
I don’t think anyone was predicting the PDO to return to its warm mode as happened in 2014. It was assumed to be another 60 year cycle. That blew all the predictions prior to 2014. Add in the HTE with its dual warming effect and alarmists got lucky.
Doesn’t look good for you going forward. The 2023-24 warming due to HTE and El Nino will produce a pause that will likely hold until the AMO goes negative. At that time the pause will continue moving back, first to 2016 and eventually it could go all the way back to 1997.
I’ve been predicting a pause since even before the previous one had ended. What about that isn’t looking good?
Yes, it’s fun looking at old posts. Lord M also had this:
“The central question is not how long there has been no warming, but how wide is the gap between what the models predict and what the real-world weather brings. The IPCC’s Fifth Assessment Report, to be published in Stockholm on September 27, combines the outputs of 34 climate models to generate a computer consensus to the effect that from 2005-2050 the world should warm at a rate equivalent to 2.33 Cº per century. Yeah, right. So, forget the Pause, and welcome to the Gap:”
and then this
“So let us have no more wriggling and squirming, squeaking and shrieking from the paid trolls. The world is not warming anything like as fast as the models and the IPCC have predicted. The predictions have failed. They are wrong. Get over it.”
So what do we now find, trends 2005 to date?
GISS: 2.88 ºC/Cen
HADCRUT 5: 2.73 ºC/Cen
NOAA: 2.92ºC/Cen
UAH: 2.84ºC/Cen
RSS: 3.23ºC/Cen
Only another 80 years to go to determine whether the trends are valid.
25 years – 2005-2050 was the prediction.
But Lord M declared in 2013 that the prediction had failed – way too high, he said.
It yet is, The predicted warming to UHA, likely the only valid measure of atmospheric T, is yet way below the doomsday cult and you Sir are an excellent cherry picker…
And where did you start? Pick a five year mean centered on 05 and centered on 2022 and you get a bit more then 1 degree per century. Piff…
I didn’t choose the dates at all. Monckton chose what he said was an IPCC prediction of the 2005-2050 trend (2.33 C/Century). In 2013 he said that the observed trend since 2005 was lower, and so the IPCC was all wrong, and the paid trolls should wail, or some such. Now the observed trend since 2005, including UAH, is higher. There is still a lot to play out before 2050, but the IPCC prediction is looking good.
About time the speedometer introduced in 2016 was updated.
That used the average of UAH and RSS since 2001. RSS is now ignored, but just using UAH, the trend is now 2.09°C / century, which means the needle is now pointing straight up.
That graphic is about as stupid as an elevator that only goes up.
It’s Monkton’s graphic. I just updated it.
Brilliant. That comment alone made this page worth visiting
Nonsense. Starting with a five year trend centered on 1982, the bottom of the ice age scare. (1970 would have been at least 2 tenths warmer.) we get a total change to a five year mean centered on 2021 of .6 degrees over more then 40 years, and a true likely warming of .4 degrees over fifty five years.
Go back about 90 years to the 1930s and there may be little to no change. Most US all time highs were set in that decade.
It’s Monkton’s choice to start at 2001. He insisted that 15 years was enough to establish the true trend. It’s his choice to use simple linear regression rather than rolling averages.
Nick, please do not scare the science deniers here with data. They frighten easily and get very nervous when they see actual data. Ruins their day. Like Dracula seeing a silver cross,
The IPCC is guessing +1.5 to +2.4 degrees C. warming per century based on CO2 increasing at the current rate of +2.5ppm a year.
All the measured temperature trends since 1975 have been faster than the IPCC prediction range based on a reasonable CO2 growth estimate. NOT based on RCP8.5.
While 50 years of actuals do not prove a 170 year, or 100 year, prediction is right, they ARE evidence the IPCC prediction is not nonsense.
Everyone is entitled to guess the climate in 170 years, 100 years or 50 years. Guesses are NOT science, they are climate astrology.
The IPCC current wild guess is +2.5 to +4.0 degrees C. per CO2 x 2.
At a rise rate of +2.5ppm a year, CO2 x 2 would take about 170 years
+2.5 degrees C. in 170 years is the same warming rate of about +1.5 degrees C. in 100 years
+4.0 degrees C. in 170 years is the same warming rate of about +2.4 degrees C. in 100 years
Both NASA and NOAA (as well as other organizations) define climate to be weather over a specified geographical region averaged over 30 or more years.
Since you posted values for “trends 2005 to date”, you are vainly attempting to trend relatively short term weather, not climate.
Good luck with that.
First…Nick didn’t pick 2005. That was Monckton.
Second…perhaps you can tell Monckton that what he has discovered with his pause updates is the inevitable consequence of short term weather variation and not the long term climatic trend because when we tell him that he doesn’t listen.
Did I ever say that Nick Stokes picked a start date of 2005 in this thread? No.
But Nick certainly referred to and used that date in his post above dated February 4, 2025 12:29 pm, excerpted here:
“So what do we now find, trends 2005 to date?
GISS: 2.88 ºC/Cen
HADCRUT 5: 2.73 ºC/Cen
NOAA: 2.92ºC/Cen
UAH: 2.84ºC/Cen
RSS: 3.23ºC/Cen”
As to your last sentence, you have obviously mistaken me for your lap dog. And is the “we” to whom you refer just you and Nick Stokes?
“define climate to be weather over a specified geographical region averaged over 30 or more years”
They don’t. They define 30 years as the appropriate time period for calculating a temperature normal.
“Since you posted values for “trends 2005 to date”,”
I’m updating Monckton’s test of the CMIP3 based predictions. They are the first coordinated prediction from many models, and of course they start from the year they were made – in this case 2005. He chose to test after 8 years, and said they were too high, so the models are junk. I updated the same after 20 years, where the models are now looking good.
Looking ominously good.
Arbitrary choice. A very short time considering some of the oscillations being dealt with. Even a 100 year time frame for a temperature normal could be too short to determine an accurate value.
Poor Nick. Caught once again (with your pants down?) stating something to be true when it is obviously false. Here are the facts, for all to see:
NASA’s definition of “climate”
“Climate is the average weather conditions in a place over 30 years or more. NASA has observed that Earth’s climate is getting warmer.”
—source: https://climatekids.nasa.gov/menu/weather-and-climate/
NOAA’s definition of “climate”
“The climate is the reoccurring average weather found in any particular place, measured over 30 year intervals. The Earth’s tilt, rotation and land/sea distribution affect these global weather patterns, resulting in variations between different locations.”
—source: https://www.noaa.gov/jetstream/global/climate-zones
Took less than one minute to find both with a Web search engine.
And just to confirm my claim of “other organizations”, here’s just one among many examples:
National Geographic’s definition of “climate”
“While weather refers to short-term changes in the atmosphere, climate refers to atmospheric changes over longer periods of time, usually 30 years or more.”
—source: https://education.nationalgeographic.org/resource/weather-or-climate-whats-difference/
As to the rest of your reply to me: ppfthpthppt!
Four pounds of baloney
(1) Hunga Tonga had no apparent effect on the GAT because it only increased total atmospheric water vapor by 0.1%. It will have no obvious GAT effect as the stratosphere water vapor very gradually declines
(2) The sunspot cycle has only a 0.1 degree C. effect on GAT from peak to trough
(3) The last El Nino ended in May 2024
The ENSO cycle has been neutral since May 2024. This means that neither El Niño nor La Niña conditions have been present since May 2024.
(4) Most global warming since 1975 has been TMIN near dawn. Global brightening does not cause higher TMIN. Lower SO2 emissions would be one cause of global brightening.
You have an overactive
climate science denying imagination.
The cloud changes, producing solar warming, after the HTE was significant and looks to be fading away at present. Same with the water vapor warming.
El Nino transitioning to La Nina has also had a cooling effect.
In the last 9 months the cooling has reached 0.48 C. What did you think caused it?
The cooling was caused by aliens from the pl Uranus.
Earth’s temperature is never constant and UAH must have some unknown margin of error. UAH does NOT measure surface temperature with instruments locate near Earth’s surface. It does not even measure temperature directly. The margin of error HAS to be unknown.
A sarcastic response to a reasonable question?
What is the talk about some “unknown margin of error” as if what, the cooling is not right, but the warming is?
UHA instruments are more accurate and checked and verified by many methods using the most accurate thermometers we have, and not affected by UHI. It actually measures and looks for the atmospheric signal of GHG warming. (AKA, the MIA hot spot) Surface warming can have many potential causes.
Regarding the errors in your earlier comments…
https://wattsupwiththat.com/2025/02/04/uah-v6-1-global-temperature-update-for-january-2025-0-46-deg-c/#comment-4032932
UAH satellites measure microwave irradiance levels and converts that to a temperature. Microwave irradiance depends on path loss between the source and the measuring device. Water vapor and particles are part of the path loss factors (we always had to take this into account when designing microwave links for the telephone company). Since UAH does not and can not measure the water vapor in the atmosphere at each sampling point it cannot directly apply a correction factor to account for changing path losses at each sampling point. Thus they have to GUESS at what it might be. GUESSES mean measurement uncertainty.
UHI affects go high into the atmosphere, think about altitudes gliders can reach when riding a “thermal” above a warm spot on the earth. Winds will spread that “heat” horizontally across a wide area downwind of the source. That *will* impact the temperatures that UAH “sees” in its samples.
Richard, Hunga Tunga affected the NH stratosphere w/v by over ten percent, and early work (studies done a decade or so ago) mentions much higher potential affects. (So your mentioning total atmospheric w/v is mis-directed.) Just as the GHE of a few PPM CO2 increase is mainly in a small portion of the troposphere, and you give that effect a great deal of credit. Indeed you give it more vcredit then many studies of the effect of CO2 doubling, which come in at close to 1 degree.
The sunspot cycle you mention forgot what Monckton said about cloud cover, or sun shine hours, so you bias in what Monckton says is clear and ignores sun shine hours. Also the oceans are a far greater GH liquid then CO2 is an atmospheric GHG. Why, well because the residence time of the S/W insolation energy entering the oceans, potentially hidden from the atmosphere for a time, is far far greater then the very short residence time increase of LWIR in the atmosphere. Additionally the energy affected is far greater and CO2 is ever less effective of an already saturated W/L GHG.
Actually if the warming is in the occeans (which it was) then sun light energy, when it leaves the oceans as LWIR, does indeed affect t-min near dawn.
Your finale insult to Monckton is is unproductive and it would do you well to understand is contributory to the insults you receive here. All of which distract from rational conversation.
In addition see my comments above (to Nick S) to show how the trends you and he quote in regard to UHA are simply incorrect.
Duhhhh . . . The WUWT “ENSO meter” on the right-hand side of this very page is currently outside of neutral range and at a meter value close to -0.75, definitely in the weak La Niña range. In fact, NOAA states that the current, on-going La Niña began in December 2024 (ref: https://www.cpc.ncep.noaa.gov/products/analysis_monitoring/enso_advisory/ensodisc.shtml )
Maybe the ENSO “meter” you are using is broken?
Surely, surely, they won’t fall for this nonsense again.
Surely?
(They will, won’t they…..)
Long pauses and even cooling between the other major El Ninos.
1980-1997… basically no warming
2001-2015… no warming
2017 – 2023… cooling
All the climate alarmists can hope for is another major El Nino.
Please stop with your El Nino garbage. The heat spike continued after El Nino ended and the ENSO values went negative.
Quite. This is the second-warmest January on record for UAH, despite ENSO numbers being negative since July 2024.
https://wattsupwiththat.com/2025/02/04/uah-v6-1-global-temperature-update-for-january-2025-0-46-deg-c/#comment-4032939
The oceans continued to warm, admittedly unexplainable by anyone, and the cooling rate has been equally severe and unprecedented. CO2 had nothing to do with it, and El Nino is only a small percentage of the ocean, and the waters from it move elsewhere.
There is nothing out of the ordinary with the UAH TLT values. In fact, the 2025/01 value of 0.46 C hit the expectation exactly this month. All we need is CO2, aerosols, solar TSI, and ENSO to explain the behavior with reasonable skill.
I want to nip one thing in the bud right now because commenters are always chomping at the bit to mispresent what I post. The graph I posted here is not meant to prove that CO2 influences UAH TLT values. What the graph is meant to do is falsify the hypothesis that there is no correlation between CO2 and UAH TLT values, to demonstrate how different agents combine to produce the ebb and flow temperature, and to show that what is happening now is not outside the envelope of expectation.
Nifty graphic & subsequent disclaimer!
? Wouldn’t this be a good place to insert a warning about causality, i.e. the effect cannot precede its cause, right?
In that case, if the change (delta) in temperature precedes the change in concentration, then it cannot be true that the latter is the cause of the former.
— Squinting at your graphic, it doesn’t seem to show the much discussed order.
— Perhaps it has been removed by a ‘lag’?
Enquiring minds …
The questions you need to be asking since you are convinced the world is warming are:
1) Is Tmax or Tmin warming?
2) As we see more and more localities with little to no warming, just exactly where is all this warming occurring.
You may not see it in your cocoon but a groundswell is starting to build asking what bad things have occurred after passing 1.5 degrees. The earth is greening, crop yields are increasing, population are growing, polar bears are doing well. These things don’t go unnoticed.
Sooner or later climate science is going to be required to substantiate all their doom and gloom.
No one is denying CORRELATION. But temperature also seems to be correlated with postal rates!
“ to demonstrate how different agents combine to produce the ebb and flow temperature”
Which includes the unstated and unjustified assumption that CO2 is a CAUSATIVE factor for temperature – something that correlation does not imply.
Are postal rates also an “agent” that combines with other factors to produce the ebb and flow of temperature?
How come you continue to show how stupid you are when everyone already knows it?
I’m not the one who’s about to fall for yet another Monckton ‘global warming has paused’ pantomime, mate. That would be you.
You did it again
You said 2016 would not be topped. So don’t think the irony of your statement above went unnoticed.
I fail to see any irony. We have already been through this. I already admitted I was wrong to you a year ago. Why are you bring this up again? Baring this unforseen and as yet unexplained, out of trend related anomaly, I would have been right still to now. You really are a pathetic little creature.
Get used to admitting you were wrong, Mike.
There will be many future opportunities.
And here is an update of the IPCC prediction from 1990. I’d say scenario B is probably closer to what actually played out. As you can see the transient spike has actually exceeded even scenario A. However, using your preferred method the warming isn’t substantially different from what the IPCC originally predicted.
I’ll add that the prediction Monckton advocated for in 2013 was off by nearly 1.0 C after 11 years while the IPCC was within 0.1 after 24 years. In that same article he said “The world is not warming anything like as fast as the models and the IPCC have predicted. The predictions have failed. They are wrong.” So I’m curious…how should we describe Monckton’s prediction?
An appeal to ignorance.
He certainly picked the right audience.
Re ‘Lake Erie freezes over’ —
Take another look at the report (UAH Tabulation),
look at the Column headed by ‘USA48‘
referring to that tiny speck of the globe that (nearly) includes Lake Erie:
Entry for Dec. ’24 +1.42
Entry for Jan. ’25 –1.06
Difference: -2.48 degrees Celsius (that’s minus 2.5 degrees whiplash)
Does that help ya out, just a little bit? [aka ‘Polar Vortex’ descends]
Cheers — RLW
The thesis is of this RLW comment is unclear to me.
Sorry, KevinM, my point was in response to Heme212‘s* paradox —
“but still hottest evah? Lake Erie …” contrast / contradiction implied —
By breaking down the UAH report into regions — such as Northern Hemisphere, a vast region, vs. USA48 — one can see that the Lake-Erie result is part of a ~ local story. There’s no contradiction.
How is that for a clarification?
Cheers, — RLW
Thanks, yes, exactly
Are not all results a part of the whole. Who stated that Lake Erie is not regional. When news reports come out claiming the sky is falling, where are all the , ” It is local only comments?
Ah! A prize should be awarded for the first use by an amateur of the newest CliSciFi buzzword “whiplash.”
Thanks, Dave Fair, don’t you think it’d be good to (ab)use this term whiplash as rapidly we can, so that it can join ‘chaos’ etc. ?
lol. i remember 2017, i think, when the month of february in USA48 was seeing record colds the whole damn month. new records all throughout montana and the great plains too.
USA48 came in at -0.02
lol. kid you not
Who knows how they judged it in 1973. The real story could be more or less dramatic and we’d never know unless we were there since ’73.
Ice counting reminds of a standup comedian talking about who needs signs to say the floor in a supermarket might be slippery after mopping. “Shiny… Not shiny”.
The Arctic ice cover and depth is setting a record low.
So much for the hottest January evah.
Only the second hottest.
Count again!
1st – January 2024 at 0.80°C.
2nd – January 2025 at 0.46°C
=3rd – January 2016 & 2020 at 0.42°C
Do you want another recount?
Anyone who buys 0.4 C increase on ~ 15 C as being “hot” needs a new pacifier to suckle on.
(maybe one filled with cement in the hope that it helps them harden up)
I don’t disagree, but remember that 6 C global average temperature change is the difference between glacial and interglacial eras so a 0.4 C increase is not insignificant in that context.
Your claim is based on hockey stick temporal resolution fraud.
I did not use MBH98 or MBH99 as a basis for the 6 C value.
Thank goodness for that slight warming since 1979.
Would have been a real problem if it had kept cooling !!
Remember, the LIA was the coldest period in some 10,000 years
Anyone who believes temperature anomalies based on averaging physical measurements (and referenced to a constant absolute value) are meaningful to 0.01 C is just slightly beyond pacifier stage.
That is what WUWT is posting here
Really??? I can’t any find any reference to “accuracy” in the above WUWT article.
Please point such out, specifically.
Or are you just once again stating something to be true, without any supporting basis? (not that I’m expecting an answer from you)
Measurement values are often cited to arbitrary precision (number of digits) without regard to their underlying accuracy.
Nick is saying that WUWT finds enough meaning in the values that they post them.
[Christy et al. 2003] say the uncertainty is ±0.20 C.
I don’t disagree, but there are many here will take offense to your statement.
BTW…UAH provides the values to 0.001 C.
Bellman just stated numbers to 2 decimals. That was all you had to complain about. Those numbers came from the head article, or the associated table for earlier years.
Ok
1st – January 2024 at 0.8°C.
2nd – January 2025 at 0.5°C
=3rd – January 2010, 2016 & 2020 at 0.4°C
My air-con is graduated in 1°C units.
0.5°C is totally insignificant warming over decades…. now turning to cooling
0.5°C is also the cooling in just 8 months since the peak of the El Nino.
Dam, I was hoping for the hottest.
So was I.
Sorry JZ, the warmth of the El Nino is now ebbing away.
Let’s all hope we don’t drop into an even colder period.
Remnants of the 2023 El Nino.
Globe is only a degree or so above the coldest period in this interglacial.
Has been far warmer for most of the last 10,000 years.
Media reported the crisis of exceeding 1.5 degrees of warming to 1.6 (that was 1.2 only 3 years earlier). We await their report of the .4 C decline to 1.2 again….
And here you are posting without needing medical treatment…..
Lower than any reading last year, and December was coolest month of 2024.
Tongan eruption effect slowly wearing off. April will be 12th month of cooling.
At its current rate of cooling, it’ll be snowball earth well before 2100.
Linear projection of women’s Olympic marathon record pace circa 1992
Testosterone helps.
So does change of gender. !
The drop looks to be too sharp to me, to be the Tongan water vapor suddenly dropping out.
I believe it is probably more likely the time delayed reduction in UAH after the end of an El Nino.
Of course, the overprint of the Tongan event (and its dissipation) could still be a significant variable.
Stop propagating the myth that atmospheric temperatures have anything to do with Hunga Tonga. That 1 PPM increase in water vapor has no more power to warm the Earth than CO2 does. Either you’re a climate realist or you’re not. The Hunga-Tongist cult simply prefers its own brand of magic.
Utter nonsense. That eruption increased water vapour levels by around 10% It is you that is not a climate realist
That’s 10% of stratosphere values, which are tiny to begin with.
True, yet papers ten years ago talked of large potential effects of a boarder spectrum GHG like w/v in the stratosphere, then post Hunga Tunga papers delivered. Yet I agree, Hunga Tunga did not produce the unprecedented (modern instrument record) rise in ocean T, and neither did CO2. If it was not sun shine hours, and I do not think we will find it there, then Hunga Tunga may have only been a symptom of global increase in geo thermal heat flow, or some other mystery affect, clearly not CO2. The rapid ocean cooling is equally unexplained.
It was 150 MtH20 total. The 10% figure is for the stratosphere which is already very dry. To put this into perspective since the HT eruption almost 15,000 MtCO2 has accumulated in the stratosphere.
The biggest effect from HTE was cloud reductions. What caused that may be up for debate for awhile but I think the clouds are now starting to return. The water vapor hasn’t completely gone away either.
I only wish it was.
Someone help me out, please.
My recollection is that NOAA predicted a hotter than usual January.
I have not the time nor means at present to check that forecast.
“So much for the hottest January evah.”
Well, the first surface measure, TempLS, is in and yes, it was (by a whisker over 2024) the warmest January in the record:
Jan 2025 1.154 C
Jan 2024 1.116 C
Jan 2016 1.009 C
I remember the 1.154 C hottest January anomaly last month.
I was OK with the 2024 1.116 C January anomaly, but I could have MELTED with the additional 0.038 C last month.
If I was alerted to it.
(I MUST get a new thermometer for my porch. The current one just isn’t giving me the alarming detail I need to survive the universally-publicised “climate crisis.”)
Ouch! 🤣
Story Tip
Russia’s Breakthrough mRNA Cancer Vaccine: Here’s What You Need to Know
The global fight against cancer is at a pivotal moment. A breakthrough in Russia promises to redefine cancer treatment, with the country announcing its first mRNA cancer vaccine. This revolutionary development has the potential to save millions of lives, offering free distribution as early as 2025. Combining cutting-edge mRNA technology, artificial intelligence (AI), and years of cancer research, this vaccine is poised to become a game-changer in oncology.
Hope it’s legit.
But, how is it called a “vaccine” if it’s purpose is to treat existing cancer tumors?
According to the FDA and CDC in the U.S., if you call something a “vaccine”, you can skip most of those costly safety trials AND you can also be shielded from future lawsuits!
If I was the manufacturer of Tylenol, I would also label it a vaccine.
Another piece of language “changed” for expedience at the expense of historical context.
Another good word that has been hijacked, redefined, and repurposed.
I’ll believe that when I see it. I doubt we will here any more about this
Is this temperature anomaly not only linked to atmospheric carbon dioxide but also funding for the IPCC? It just seems too much of a coincidence that Donald pulls out of the Paris Agreement and in the same month Global temperatures start going south.
It’s a conspiracy, I’m sure.
I’m just waiting for the headline when this data hits MSM that Global Warming is causing record freezing.
…well…maybe if our funding was tied to such things. Except we haven’t been funded for years to do the global temperature monitoring, so… 🙂
They already have. Just follow the current headlines and the weather attribution CliSciFi liars’ screaming.
I hope that the Trump administration decides that this work should be supported to provide some of the best measurements we have for temperatures around the planet. They do help to introduce a dose of reality to climate debates.
Some of the best? Not the best by far? I defer.
I’d like better math. Arithmetic averages for non-linear functions? T^4?
Interesting contrast to ERA which has this January warmer than last year.
UAH still makes this the 2nd warmest January. Here are the top 10 warmest Januaries:
Apart from 2025 and 2020 most of the warmest months have been during El Niños.
Here’s a comparison between UAH lower Troposphere and ERA surface anomalies.
It’s interesting how much of a difference there is in timing of the peak. UAH peaks about 6 months after ERA.
Really a strong El Nino effect, wasn’t it…!
But no evidence of any human causation.
Hi Bellman.
Can I please schedule an online discussion with you?
11.45 pm my time would be great.
That’s when my insomnia usually takes hold.
No need to think up new points of conversation, just read out these last tables and graphs.
Ta.
Still waiting for the full data, but here’s the UAH map.
Cold over most of the USA, but above average over much of the Northern Hemisphere. Especially Eastern Europe and North of the Himalayas. This seems to be common pattern recently.
The notion of a global temperature makes no difference here on the ground where it is jolly chilly.
At least there’s little wind, oh wait…
Why are we worried about Polar bears, it’s the alligators we should be concerned about.
It’s official: Last month was the coldest January in +15 years for most of Florida
In Pensacola, January 2025 was the 4th coldest since 2010. The average temperature was 47.7° which is 4.9° colder than the average.
In Jacksonville, January 2025 was the coldest January since 2010. (-6.1° F below normal ). This past January tied for 3rd coldest on record-since 1890.
In Gainesville January 2025 was tied for the 3rd coldest on record, (-6.1° F below normal) and the coldest January since 2003.
Leesburg had its 4th coldest January, Sanford had its 7th, Melbourne 8th, and Daytona Beach had its 4th coldest January as well.
https://www.cfpublic.org/2025-02-01/its-official-january-was-the-coldest-january-in-15-years-for-most-of-florida
It’s hard to get worked up about large toothy eating machines. What you need is “cuddly, furry, seemingly intelligent etc…
How dare you… here kitty kitty
And WIBW Topeka Ks said this was the coldest January in 40 years .
My gas bill agrees ….
Gosh, the satellite readings used to be so accurate when they were close to +1 anomaly, but now they have reverted to being junk science 🙂
Alas, validity — like beauty* — is in the eye(s) of the beholder!
*re ‘beauty’, this dataset is wondrous to behold, but it’s best to wait a couple months in case of revisions yet-to-come. cheers, — RLW
I knew 1979 and she was a cold one.
YEP! 1979 A.D. “she was a cold one“
Anecdotally (& nostalgically), at age 19 years I experienced a freezing August in ‘upper Bavaria’ (‘Hof in Bayern – Ganz Oben’), at the Drei-Ecken (intersection) of the DDR, Czechia & Bavaria — one could see the guard towers from town.
The locals explained that this here was the ‘Siberia‘ of Mittel-Europa. (Being from the vast land known as the Intermountain West, I couldn’t wrap my feeble mind around the idea of a Siberia shrunk into that tiny corner of the planet.)
On the train ride up to see the famous sanatorium-Davos ( the ‘Zauberberg’ — Magic Mountain of T. Mann), I nearly froze … so clueless back then that I thought the Turkish (er Kurdistani) workers crowding the railway were Sicilianos.
Followed by year 1980 A.D., drought & heatwave across the scorched N.-American heartland. Driving solo from Ogden (UT) to upstate-NY, with the Mt-St-Helens volcanic ash haze off to the north, I finally realized that – Yes! – the truckers really were trying to force me off the Interstate-80 into the parched cornfields. Of course, the 55-MPH speed-limit (that’s ~ 90-km/hr for those without the benefit of an imperial-units education) was in force, thanks Carter Admin / ‘Energy Crisis‘ …
But then — talk about Climate Whiplash ! — before we knew it, the ‘Nuclear-Winter Ice-Age’ story was in vogue, and Dr Carl Sagan (his faux-mausoleum home was just around the corner from our humble apartment) was out propagating that wisdom.
Now, the A.D. 1985 Winter-Spring provided all the confirmation one needed to fear the coming re-glaciation. That’s what they’re now busy comparing the present (2025 A.D.) winter. Saved for another day’s reminiscences.
Cheers, — RLW
We have much in common, though from different continents.
‘High above Cayuga’s Waters’?
Scissor:
Yes, that was the year when Industrial SO2 aerosol pollution (which cools our planet) levels peaked at 141 million tons. Fortunately, their levels began falling in 1980 when the Clean Air legislation of the 1970’s began to have an effect.
The amount of SO2 in the atmosphere at that time can be viewed in the SO2 Chem Map images of the NASA/GMAO ReAnalysis site.
I mention this because current images show that the amount SO2 aerosol pollution from China is now approaching that of 1979, so continued cooling can be expected.
Scissor:
Here is the satellite SO2 image for 1980, for comparison
And here is the image for June 8, 2023
Yep, If you look at basically any raw temperature data, especially in the NH, 1979 was the coldest year since since the warm 1930s,40s, also since 1900 in a lot of measured data.
Here’s the Tokyo station, as frequently featured on this site.
1979 was the warmest year up to that point, by almost 1°C.
But 1979 makes little difference to the UAH data. Start in 1980, the trend is the same, at 0.15°C / decade. Start in 1981 it’s 0.16°C / decade.
And all of that warming from the “new ice age” scare endpoint….
… comes at El Nino events.
Tokyo.. massive expanding urban area… irrelevant.
Compare Tokyo URBAN to all of Japan since 1950.
El Nino step between 1995 and 1998, but looking either side…
Thanks for confirming it was hot all over Japan in 1979.
BTW, do you have a source for that data? And is there a reason why you’ve split it into two sections and missed out 8 years in between?
Here’s the BEST figures, which only go up to 2020.
Best is not a source of real data. JMO is.
There was some sort of step change in 1990
Do you want me to include that step change events so you can have a warming trend you can pretend is from CO2 ?. 😉
Could you provide a link for the JMA data? It might just be looking in the wrong place, but all I can find on their website is individual stations or global data.
“There was some sort of step change in 1990”
So you tried to pretend the warming hadn’t happened. And still dodging the fact that 1979 was not one of the coldest years in Japan.
Best data is a waste of time. It shows a hockey stick but little if the individual stations do.
Serious time series analysis is seriously lacking.
Here is another Japanese station that shows NO warming.
And another look
Funny how that works when looking at non-UHI sites.
Thanks for confirming that 1979 was a warm year in Japan.
Here’s the full data for Hachijojima, with a black dotted line indicating 1979, and a red line indicating where, according to JMA, there is “data inhomogeneity caused by changes in instrumentation, observation methods and/or site location”.
And here’s the full data for Naze, which definitely shows a rise since 1930.
Would love to see a picture of the Naze weather station and surrounding area.! 😉
According to Japan Meteorological Agency | Observation table
… it is meant to be at the yellow pin.
Does it ever occur to you to investigate in more detail to see if you are creating spurious trends from non-stationary time series? You are trending two time series Tmax and Tmin. They need to be stationary for proper handling.
Does it ever occur to you to actually try to understand the words you keep spouting. You clearly have no clue what stationarity means and just keep throughing it out to distract from the actual point.
You aren’t even responding to my comment. I said nothing about a trend, spurious or otherwise. The only person fitting trends was you in the previous comment.
You still don’t understand that if a time series has a trend, then by definition it is non-stationary. If you mean that it’s possible it’not trend-stationary, then you need to justify that claim. It would be extraordinary if a temperature time series was not trend-stationary, and every time you have made that claim before, a simple test has shown you are wrong.
And none of this has anything to do with the temperature of interest being an average of max and min.
I understand very well. Do you think I have not had to trend revenues, expenses, people, and equipment in the past. These are all made up of underlying components that must be examined.
I don’t need to justify anything. You are the one that is making a warming claim not me. It is your job to provide the information substantiating your claims. You should realize your projection is made up of many components. Seasonality, Tmax, Tmin all play a role. Have you insured the components are stationary?
Here is a good document from Duke Univ.
https://people.duke.edu/~rnau/411diff.htm
Here are two graphs you need to consider and explain.
Notice the warmest months show no growth over 124 years. This is when insolation is greatest and CO2 should have the largest effect.
The coldest months show a warming since about 1980. This is when insolation is least. Does CO2 have a larger effect in winter?
What do you think causes the annual means to show warming?
Does this mean the GLOBE is warming?
Are warmer winters a danger to the flora and fauna on earth?
“I understand very well.”
Yet nothing you go on to say has anything to do with stationarity.
“You are the one that is making a warming claim not me.”
You claimed “Here is another Japanese station that shows NO warming.”, showing a cherry-picked subsection of data for Hachijojima. I showed the full data set and pointed out where there was a reported change in the station. And you showed two graphs of selected months from Naze and said “Funny how that works when looking at non-UHI sites.”. I assume your “funny” was again implying no warming. I showed the annual data and said it certainly looked to be warming.
Beyond saying it looks like it’s warming I’m not sure what claims you think I’m, making, or why you think you don’t need to justify your claims that there was no warming, and why you think the non-stationarity of the data makes the obvious warming spurious.
“Seasonality, Tmax, Tmin all play a role.”
I used annual figures. There is no seasonality. I used TMean, there is no max and min. I’ve pointed out to you before the dangers of a linear regression on seasonal data.
“For this reason you should be cautious about trying to extrapolate regression models fitted to nonstationary data”
How many more times – if you mean the data has a unit root, you need to provide evidence for that. And it’s pointless to fit a linear regression if the data is stationary. You are quoting a business school. It’s describing statistics for forecasting and still don;t seem to understand what it’s saying.
“Here are two graphs you need to consider and explain.”
Not the Kansas data again.
“Notice the warmest months show no growth over 124 years”
We went through all this a few days ago. Here’s the graph I made for you
Almost no trend in “the maximum month of each year”. Still no idea what point you think you are making – and what you think this has to do with stationarity.
“This is when insolation is greatest and CO2 should have the largest effect.”
You will need to provide a reference for that claim. My understanding is that it’s predicted that rising CO2 will warm winters faster than summers.
“Does this mean the GLOBE is warming?”
Why would you think warming in one tiny part of a small part of the world would prove that the globe is warming?
And what does any of this have to do with stationarity?
Check out the inflection around 1965.
You can have break points in trend-stationary data.
It’s an inflection, not a break point.
Same point. Trend-stationary time series can have trends that change.
That’s a rather “interesting” definition.
My definition is
https://en.wikipedia.org/wiki/Trend-stationary_process
What’s yours?
https://au.mathworks.com/help/econ/trend-stationary-vs-difference-stationary.html
“A trending mean is a common violation of stationarity. There are two popular models for nonstationary series with a trending mean.
clarified by:
“The distinction between a deterministic and stochastic trend has important implications for the long-term behavior of a process:
Same equation for trend stationary, so perhaps we have different interpretations of “trend”.
Unless you’re going with a non-linear function for the trend, any inflection gives different trends at different times.
If you’d said non-linear trends, we’d be in agreement.
They are the same definitions. Maybe the confusion is that the trend does not have to be linear, it can be any function you like, including having inflection or break points. The main point is that it is different to time series with a unit root.
Yes, but that’s not you originally said.
You started off with:
then went to:
before settling on:
I quite agree regarding inflections and non-linearity, but not break points and different trends. Any function with break points or “trends which change” needs to be investigated very closely.
Also, when you get into non-linear trends, you run the risk of misidentifying a difference stationary trend as trend stationary or vice versa. After detrending, you really need to determine if the variance changes during the time period of interest.
“Trend-stationary time series can have trends that change.”
Clumsy wording on my part. I was just trying to point out that the trend does not have to follow a straight line.
“Any function with break points or “trends which change” needs to be investigated very closely.”
Yes. That’s one of my many complaints about Monckton’s pauses. They always produce a break point.
“Also, when you get into non-linear trends, you run the risk of misidentifying a difference stationary trend as trend stationary or vice versa.”
Yes. But that’s the problem of deciding what model best fits the data, not about the definition of the model. And I’ll repeat my point, regardless of the data, it seems improbably that a temperature time series will not be trend-stationary.
“After detrending, you really need to determine if the variance changes during the time period of interest.”
and that’s yet another issue.
We all do that from time to time 🙁
That’s why it’s important to try to eliminate ambiguity.
Any time series just uses time as a proxy for an underlying independent variable. The instrumental time series we have currently assumes time adequately represents the effect of the change in GHGs + aerosols. If that is trend-stationary, the variance should be stationary, or trend-stationary if you prefer.
Not really. The variance should be stationary. I don’t know that I’ve seen variances shown with the means. I might have a look at decadal variances later today, though the small sample sizes will make then pretty vague.
Geoff,
Here are two graphs from NOAA for the state of Kansas average temps.
The one month average shows little change of average temperature during summer months over the 124 years. Certainly no hockey stick. CO2 should cause the largest change in “back radiation” when insolation is highest, i.e., summer. As it is, noone should expect problems from an increase in general temps during summertime.
If you examine the “middle” temps, the concentration has little change over this time frame. Again, no hockey stick stands out that shows the temps in months like April/May or September/October have risen significantly.
Yet as soon as you look at 12 month average, whoa, quite a hockey stick. What causes this growth at the end of the series? One thing that apparent is that winters temps have warmed since 1980. This is confirmed by studies that have found the growing season (last spring frost – first fall frost) is getting longer.
https://www.nature.com/articles/s41598-018-25212-2
Adding this into an annual average, makes the entire average have a higher value but is very misleading as to total warming of the area being examined. This is carried forward into an anomaly calculations. The conclusions reached from examining annual anomalies are entirely wrong.
https://online.stat.psu.edu/stat501/book/export/html/995
Using a fairly simplistic approach using the ERA5 temperatures, split into 25 year periods
period mean sd detrended sd
1850-74 -0.16 0.058
1875-99 -0.18 0.102 0.101
1900-24 -0.28 0.103 0.109
1925-49 -0.04 0.139 0.120
1950-74 0.00 0.090 0.088
1975-99 0.30 0.148 0.099
2000-22 0.74 0.164 0.107
The 1850-74 sd is an outlier, but the F-test says the rest are (barely) the same at a 95% confidence level. That’s detrended, of course, quite a few are different with the trend retained.
Just for giggles, the t-tests say
1850-74 cooling
1875-99 cooling
1900-25 cooling
1025-49 warming
1950-74 nothing
1975-99 warming
2000-22 warming
Ahh, the fun one can have with statistics, even without uncertainties 🙂
Show us a function of ‘t’ in years as a predictor that accurately gives a value of the dependent variable.
You either didn’t read the article closely or didn’t understand it.
You do realize that a stochastic process is a random process, right?
From Wikipedia
If you remove the underlying trend that is a function of time, you just removed the temperature data. LOL.
You are trying to show that a linear regression line is a stationary process. It IS a straight line but isn’t a functional relationship describing a linear relationship between the independent and dependent values. It is a “line of best fit.
Linear regression was originally used to verify that a proposed functional relationship was in fact linear. Time and temperature have no functional relationship.
“Show us a function of ‘t’ in years as a predictor that accurately gives a value of the dependent variable.”
The function doesn’t predict the variables. It describes the mean value at any point in time. The variable will be f(t) + e_t, where e_t is a random value.
“You either didn’t read the article closely or didn’t understand it.”
Stop with this patronizing nonsense – it just makes you look like the idiot. Your quote is just describing the formal definition I gave.
“You do realize that a stochastic process is a random process, right?”
You do realize how big an idiot you sound like, right? What else would you think a stochastic process meant?
“If you remove the underlying trend that is a function of time, you just removed the temperature data.”
No.
“You are trying to show that a linear regression line is a stationary process.”
Idiot. You keep claiming to understand this, but keep demonstrating you don’t.
“It IS a straight line”
The function does not have to be a straight line. It told you that in the first thing you pasted
“It is a “line of best fit.”
Yes, and?
“Linear regression was originally used to verify that a proposed functional relationship was in fact linear.”
Citation required.
“Time and temperature have no functional relationship.”
You still don’t know what functional relationship means, and this is a deflection from stationarity, which is what we were discussing.
“The function doesn’t predict the variables. It describes the mean value at any point in time. The variable will be f(t) + e_t, where e_t is a random value.”
If the function doesn’t predict the variables then it cant predict the mean either. The mean is derived from the values of the function. No values – no mean.
If f(t) is not a constant, i.e. the value of the mean is shifting over time, then it fails the stationarity test and e_t can’t fix that if it is a random variable independent of f(t).
“The function does not have to be a straight line.”
If f(t) is the MEAN value then not only does it have to be a straight line in order to have stationarity, it has to be a horizontal straight line. Stationarity implies that the MEAN and the variance are constant over time. A constant mean would be a horizontal line.
“Citation required.”
Go look up Francis Galton.
“You still don’t know what functional relationship means, and this is a deflection from stationarity, which is what we were discussing.”
————————————————-
A function is a relationship between a set of inputs (called the domain) and a set of outputs (called the codomain) where each input is associated with exactly one output. It is commonly represented as f(x), indicating that for each value of x, there is a unique value of f(x) associated with it.
—————————————————–
Input: 1200UTC, March 1, 2026
Output: ??????
Tell us the functional relationship between time and temperature that will allow you to tell me what the temperature will be.
The increase in temperature typically described is a random walk with drift. I.e. Y_t = Y_(t – 1) + ɑ + e_t
This results in a steadily increasing trend line, i.e. a linear regression best-fit line.
You make it stationary by doing first differences. Y_t – Y_(t-1) = ɑ + e_t
The problem is that unless ɑ is a constant you still won’t get stationarity. And with the “hockey stick” for temperature, ɑ is *not* a constant.
Bottom line? Temperature data is unfit for purpose, whether the purpose is as a metric for climate or for predicting future climate using linear regression.
“If f(t) is not a constant, i.e. the value of the mean is shifting over time, then it fails the stationarity test”
and
“If f(t) is the MEAN value then not only does it have to be a straight line in order to have stationarity, it has to be a horizontal straight line.”
Yes. That’s why it’s trend-stationary, not stationary.
“Tell us the functional relationship between time and temperature that will allow you to tell me what the temperature will be.”
You quote the definition of a functional relationship, but still don;t understand what it means.
“The increase in temperature typically described is a random walk with drift.”
That’s your claim. It makes no sense that temperature, let alone global temperature, follows a random walk. The implication would be that last years record temperature is the new normal. There would be a greater 50% chance that 2025 will be warmer than 2024. In the real world temperatures tend towards an equilibrium. That equilibrium is the trend.
“This results in a steadily increasing trend line, i.e. a linear regression best-fit line.”
With a unit root, there’s no guarantee of that. It depends on the size of your ɑ and e.
Here are 20 runs using your model with ɑ = 0.01, and e coming from a normal distribution with σ = 0.2. Over 100 time units, the trend given by ɑ, would mean an increase of 1. In these graphs the blue line shows the starting point and the red line the expected end point.
It’s quite possible that a positive deterministic trend combined with a random walk results in a negative trend. That’s the problem with unit roots.
“The problem is that unless ɑ is a constant you still won’t get stationarity.”
Once again, we are talking about trend-stationarity, not stationarity.
“Yes. That’s why it’s trend-stationary, not stationary.”
A hockey stick is not trend-stationary.
“You quote the definition of a functional relationship, but still don;t understand what it means.”
Non sequitur. You apparently can’t answer my question about what the temperature will be on March 1, 2026 so how do you justify claiming that there is a functional relationship between temperature and time?
“That’s your claim.”
No, that’s what it *is*. Your formula is for a variable with a constant mean, i.e. stationarity, combined with random noise. That is *not* what the temperature curve is.
“It makes no sense that temperature, let alone global temperature, follows a random walk.”
Of course it makes sense. A random walk, i.e. natural variation, coupled with a drift up or down.
“The implication would be that last years record temperature is the new normal. There would be a greater 50% chance that 2025 will be warmer than 2024. In the real world temperatures tend towards an equilibrium. That equilibrium is the trend.”
Then where does the hockey stick come into play?
You are describing “reversion to the mean”, i.e. a variable with a constant mean. If that were true then the entire base of “Net Zero” is garbage.
“With a unit root, there’s no guarantee of that. It depends on the size of your ɑ and e.”
You have now devolved to repeating what I just told you as if it were your idea. The problem is that you can’t get a hockey stick with a constant ɑ.
“Once again, we are talking about trend-stationarity, not stationarity.”
If the trend is not stationary over time, i.e. the drift is ɑ^d, then you can’t use a *linear* regression to project the trend. You keep circling back to assuming that the drift is constant while refusing to actually state that assumption.
You can’t get a hockey stick with a constant drift. Are you now a climate denier admitting that the hockey stick is a joke?
“A hockey stick is not trend-stationary.”
If by “hockey stick” you mean it’s warming faster now than it was in the past – yes, that absolutely can be trend-stationary. You keep demonstrating you just don’t understand what these words mean. So I’ll just repeat the Wiki page on it in the vain hope you will try to educate yourself.
https://en.wikipedia.org/wiki/Trend-stationary_process
“You apparently can’t answer my question about what the temperature will be on March 1, 2026 so how do you justify claiming that there is a functional relationship between temperature and time?”
You still seem to think that a function has to be known to exist. A function is simply the mapping of one value to another.
“No, that’s what it *is*.”
You assert that a temperature time series has a unit root. That’s just your claim, and one that is demonstrably false. Show me the statistical test you used to demonstrate what ever actual time series you are talking about has a unit root, then we can discuss it. Otherwise it’s just you making wild nonphysical claims, or more likely you just don;t understand what the maths means.
“Of course it makes sense. A random walk, i.e. natural variation, coupled with a drift up or down. ”
And here you demonstrate the lack of understanding. A random walk is not natural variation around a trend. It’s the cumulative sum of all natural variation.
“Then where does the hockey stick come into play?”
What “hockey stick”. You still haven’t explained what time series you are talking about. If you mean something that has an accelerated warming rate, that’s where the non-linear trend comes into play.
“You are describing “reversion to the mean”, i.e. a variable with a constant mean.”
It’s reversion to the trend. The mean changes over time.
“You have now devolved to repeating what I just told you as if it were your idea.”
What you told me was:
What I said, and demonstrated, was that with a unit root that wasn’t necessarily true.
“The problem is that you can’t get a hockey stick with a constant ɑ.”
You can with a unit root. I’m not sure why you are even arguing this as I assume that was the point you were trying to make in the first place. Once again you demonstrate you don;t actually understand what you are arguing.
“If the trend is not stationary over time, i.e. the drift is ɑ^d, then you can’t use a *linear* regression to project the trend.”
That should be “e.g.” not “i.e.”. I’ve still no idea what “linear regression” you are arguing about. The graph Jim was objecting to had no linear regression, I’ve pointed out the problems with trying to use a simple linear regression for non-linear data. Monkton keeps making that mistake.
But you are still wrong. You can easily use linear regression on a polynomial.
“You keep circling back to assuming that the drift is constant while refusing to actually state that assumption. ”
Please quote the specific example where I’ve done that. What I’ll say is that a straight line is often the best starting point. But you always have to look for the possibility that the line is changing.
If by “hockey stick” you mean it’s warming faster now than it was in the past – yes, that absolutely can be trend-stationary
It means you can’t project into the future using a linear regression. If the drift factor is not constant, and it can’t be a constant and get an exponential hockey stick, then linear regression doesn’t
“Once again you demonstrate you don;t actually understand what you are arguing”
I’m not the one that keeps claiming a hockey stick exponential is a linear function with a constant slope.
”You can with a unit root”
What “unit root”? An exponential doesn’t have a unit root. You keep trying to say the hockey stick exponential has a constant slope, it doesn’t.
where are you getting your trend line from if not from a linear regression? And you can’t get a constant drift factor with a constant value from an exponential. Every trend line you provide is a first order linear regression with a constant slipe. It doesn’t matter what you *could* do, it matters what you do do.
“What “unit root”?”
Y_t = Y_(t – 1) + ɑ + e_t
I’ve highlighted it for you.
Rest of you comment is just a load of strawmen. If you disagree with something you need to point tot he actual thing I’ve said or done.
Unit root series are not always trend stationary. If ɑ is also a function of t, which it is for a hockey stick, then you probably can’t have a unit root. Your initial equation WITH NO ALPHA factor can have one. You keep trying to justify your linear regression trends of temperature but keep failing.
My other points are not strawmen, they are pointing out that the hockey stick can’t be analyzed using your least square linear regression and you simply can’t refute that.
“Unit root series are not always trend stationary.”
They are never trend stationary. That’s the point.
“If ɑ is also a function of t, which it is for a hockey stick, then you probably can’t have a unit root.”
You can. See all those graphs I produced using your model.
“You keep trying to justify your linear regression trends of temperature but keep failing.”
Again, Which particular linear equation are you talking about?
“My other points are not strawmen”
They are when you keep attacking me for things I have not done. I’ll ask again without a hope of you responding – point to any specific time you think I’ve tried to use a linear equation to predict more than a year into the future.
That’s one of the reasons it’s difficult to differentiate trend-stationary series from difference-stationary.
6 of the 20 graphs display progressions similar to what we see in the instrumental temperature time series.
That’s why it’s a tricky subject.
I’m still not sure what the issue is here though. I am just saying one particular data set shows warming, when Jim said it didn’t. I’m not saying anything about the cause or trying to predict the future trend from it.
That discussion seems to have drifted off track somewhat. It was about stationarity, and trend stationarity with a touch of random walks (difference stationarity) by the time you put the 20 graphs up.
The point (issue if you prefer) is that if all you have is any one of those graphs, it is possible to fit a trend to it and think it’s trend stationary.
Get it right. The simple, unprocessed, monthly average temperature over 124 years shows no warming in the summer months. That is when CO2:should have it maximum effect because the insolation is at its largest.
When you begin processing with even a small 12 month average you get a hockey stick. Something funky is going on and you seem reluctant to admit it and to find out why.
You might consider what you’ve been told before, averages of averages can be very misleading. Why don’t you get the data and post both daily and weekly temps. What do you think you will get? A hockey stick?
“Get it right.”
That’s difficult when you never specify what you are accusing me of.
“The simple, unprocessed, monthly average temperature over 124 years shows no warming in the summer months.”
Here’s what the summer months look like for Naze. That is what you were talking about I assume.
“That is when CO2:should have it maximum effect because the insolation is at its largest.”
You keep saying that. So far you’ve presented zero evidence that anyone agrees with it. It’s generally said that CO2 should cause more warming during the coldest periods. If anything a lack of warming during summer would rule out the sun as a cause.
“When you begin processing with even a small 12 month average you get a hockey stick.”
You must have some pretty weird hockey sticks.
“Something funky is going on and you seem reluctant to admit it and to find out why.”
“Something funky is going on and you seem reluctant to admit it and to find out why.”
Admit what? All you ever do is speak in riddles. If you are saying that Kansas is not the entire world, then yes I’ve “admitted” it. I just don;t know why you find that surprising, or why you think I alone have to provide a hypothesis. I’m not the one who thinks all of the globe has to behave identically. The climate is complex. There are variations across the globe caused by natural changes, or different responses to a warming world. This is expected.
“You might consider what you’ve been told before, averages of averages can be very misleading.”
Have I ever said they can’t be misleading?
“Why don’t you get the data and post both daily and weekly temps.”
Why don’t you? If you have a hypothesis you need to produce evidence for it.
I would also point out that “seasonality” is not just spring-summer-fall-winter. Seasonality implies a cyclical process. Spring-summer-fall-winter only applies to monthly data. Annual data also has “seasonality” related to cyclical processes such as orbital (around the sun), sunspot activity, etc. You can’t just say that using annual averages removes all “seasonality”, it doesn’t.
Here is another article I had in my bibliography.
https://medium.com/@danaytaman/time-series-forecasting-vs-regression-cf89d0d0f3bd
What does it say? Do you agree with it? Try to answer in your own words.
The article speaks for itself. Auto-correlation is a problem in trending and you keep trying to say that it is not. Show us the transformations you use to remove this from the trends that show if you have done that.
Stop trying to justify linear regression forecasting of a temperature stream that is full of auto-regression. The autoregression starts with daily temperatures and follows through to everything else. A hockey stick junkies ice cream.
Not really worth responding if you are just going to keep lying about me,
“Auto-correlation is a problem in trending and you keep trying to say that it is not.”
Lie. I’ve been saying auto-correlation is a problem as far back as I can remember. It’s one of the many reasons why the uncertainties in your short term pauses are so large.
“Stop trying to justify linear regression forecasting of a temperature stream that is full of auto-regression.”
Lie. I am not forecasting anything. I don;t suggest linear regression is the only way to look at data. Literally all I said about the graph you objected to was that it showed a warming trend. No linear regression just eye-balling the annual averages. This was in response to you’re graphs
and comment “Funny how that works when looking at non-UHI sites.”.
Did you check the stationarity of those graphs? Did you calculate the uncertainty of any trend, or worry about auto-regression?
And then there’s your other graph
Cherry-picking a start date and claiming it “shows NO warming.”.
So what tests for stationarity did you do to make that bold claim? Did you even take into account the fact that JMA state there is a change in the status of the station around 2003?
around 1979 was the lowest point in the AMO .
There is your world temperature trend line, as represented by the AMO: High temperature points in the 1880’s and the 1930’s, and similar warming today, and low temperature points in the 1910’s and the 1970’s (Ice Age Cometh?!).
The U.S. regional chart and all other unmodified regional charts from around the world show the same temperature trendline as the AMO shows, where it was just as warm in the recent past as it is today, meaning we are not experiencing unprecedented warming today as climate alarmists claim.
It is no warmer today than it was in the past, even though more CO2 is in the air today than in the past, therefore, CO2 has had no discernible effect on the temperatures of the Earth’s atmosphere.
Note the similar trend line of the U.S. regional chart (Hansen 1999):
Mmmm… a bit naughdy Tom….. Here is the updated version with the last 20 years.
https://data.giss.nasa.gov/gistemp/graphs_v4/
And…. mine is global, which is what counts.
And where live , she was (deep) white …
😉
Story tip
BBC funding go round.
“The obvious alternative is a subscription system – probably with a free basic public service slate and then stepped add-ons – that BBC iPlayer would be well placed to provide.
However, many corporation executives, broadcast unions and ultra-BBC-loyalist media such as the Grauniad fear this outcome because subscription, rising and falling with demand, could not guarantee the status quo: fixed annual income guaranteed years ahead, a staff of around 22,000, some presenters paid footballers’ wages, and the ability to top up the pension scheme from public money if required (a current such rescue plan for the scheme is in place until 2028).
The only alternative to the licence fee that could underwrite most of the above is funding from the tax take, so the DCMS, Nandy and the BBC began to explore it and then fly it in the weekend papers. Unfortunately, their intervention coincided with economic pressure on chancellor Rachel Reeves that may include raising taxes.
Suddenly the government understood the nightmare of having to explain, say, why the exchequer was funding Call the Midwife while cutting real maternity services.
…
stepped subscription now seems the almost certain replacement for the licence fee.
https://www.private-eye.co.uk/media-news
Did CO2 fall too?
Not yet, but the CO2 growth rate will very likely drop from the current level of around 3.5 ppm/yr in the next month or two. As I am sure you are aware, the inter-annual fluctuations in CO2 growth rate are largely driven by El Niño-Southern Oscillation (ENSO), with higher growth rates than ENSO-neutral conditions following significant El Niño events and lower rates than ENSO-neutral conditions with respect to La Niña events. Obviously, we are currently seeing the atmospheric CO2 response to the recent 2023-2024 ‘strong’ El Niño. UAH Lower Troposphere temperature changes are delayed by about 4 to 5 months after sea surface temperatures measured in the Niño 3.4 region and the CO2 growth rate changes 1 or 2 months after UAH.
Apologies if you were being sarcastic, but I thought the info might be useful to some.
Jim is correct, rate of CO2 rise closely follows the UAH ocean data.
You can see the surge in CO2 from each El Nino event, and the rate of growth stepping up with the step change in UAH temperature with the steps caused by major El Ninos.
Of course CO2 increases with SST’s.
That is the natural carbon cycle operating.
Meanwhile the human contribution is not affected by a DeltaT anywhere in the biosphere.
Just on how much fossil carbon we burn.
As Jim Ross said, it will be a change in the rate of change.
When there is a large or prolonged fall in temperature then there will be a few months later a fall in the rate of change of CO2. That is a change in the rate of change. a fall in growth. We would need a very large fall in temperature to get the rate of change of CO2 to fall to zero.
Below is a graph of change in sea surface temperature (HadSST4 https://www.metoffice.gov.uk/hadobs/hadsst4/data/download.html ) and change in CO2 growth over time. (https://gml.noaa.gov/ccgg/trends/gr.html)
The data are monthly subtract. This is when we subtract from each moth the value of that month in the previous year.The changes in SST can be seen to happen before the changes in CO2 growth.
In England this January has been 1.1C below the 1991-2020 mean average temp.
It even managed to dip slightly below the 1961-1990 average.
It’s starting to look like February is going the same way
Jan 2025 CET mean was about 165 coldest of 367, marginally below the 1961-1990 average. First month below average since Dec 2022. Just goes to show how much warmer things are these days. February is currently running above average, unlikely to be significantly cooler than average by month end despite the immediate forecast of marginally colder weather.
The National Weather Service provides daily info that I find interesting in a chart called “Climate Plot”. Try search with: Climate Graphs for the NWS ‘city name’
The story of 2 Volcanoes. The Askja volcano experienced a significant eruption in 1875 with a VEI (Volcanic Explosivity Index) of 5.
I’m all in on additional WV in the stratosphere warming effect.
No one really knows how much ice was blasted into the stratosphere in 1875.
I’ll be updating this plot when the January data is released.
From the above article:
“. . . down substantially from the December, 2024 anomaly of +0.62 deg. Most of this cooling was over the global oceans.”
Well, sort of.
In particular, if one looks at the table in the article and compares Jan 2025 data entries to Dec 2024 data entries, one find that Earth’s southern hemisphere (indeed, having a greater percentage area of oceans than the NH) had a much larger anomaly decrease (0.27 C) than the northern hemisphere (only 0.06 C decrease).
However, the “US48”, which consists of land only, had a whopping decrease of 2.48 C (from +1.42 C to -1.06 C in terms of temperature anomalies . . . of course, I’m assuming there is not a sign typo in the Jan 2025 value that is given. Ummmm . . . what’s up with that???
Also, the Australia (“AUST”) column, again reflecting only land area, reveals an anomaly decrease of 1.06 C, four times the anomaly decrease seen over the ocean-predominated SH.
Several additional comments:
(1) my above observations should NOT be interpreted to mean that I believe UAH anomaly data averages have accuracy to +/- 0.01 C . . . I actually have a hard time believing they have accuracy to even +/- 0.1 C,
(2) one is hard pressed to postulate a global-wide mechanism that would accommodate such large differences in anomaly change between oceans and land areas in a time span of one month (e.g., change is solar insolation at TOA, change in atmospheric CO2 concentration, change is HT volcano injection of water vapor or aerosols put into the stratosphere 3 years ago) . . . but variations in areal cloud coverage month-to-month might be an viable root cause.
Re (2) one is hard pressed to postulate a global-wide mechanism that would accommodate such large differences in anomaly change between oceans and land areas in a time span of one month.
try the time-lag in heat transfer (the sequence given may be represented by tropical ocean —> tropical skies —> ex-tropical ocean/skies —> land skies —> land surfaces).try ‘Polar Vortex’, https://en.wikipedia.org/wiki/January_2025_North_American_cold_wave … as emphasized below.**Cheers, — RLW
———** Here, a separate response to HEME212* (above) ———
Re ‘Lake Erie freezes over’ —
Take another look at the report (UAH Tabulation),
look at the Column headed by ‘USA48‘
referring to that tiny speck of the globe that (nearly) includes Lake Erie:
Entry for Dec. ’24 +1.42
Entry for Jan. ’25 –1.06
Difference: -2.48 degrees Celsius (that’s minus 2.5 degrees whiplash)
Does that help ya out, just a little bit? [aka ‘Polar Vortex’ descends]
Cheers — RLW
*[boiling blood?]
Really? Your assertion of a heat transfer time-lag in your offered sequence must be compared to UAH data showing oceans warming at an average rate of +0.13 C/decade for the last 46 years compared to land warming at an average of +0.22 C/decade over the same time. This doesn’t reveal any time-lag as much as it reveals a difference in effective heat capacity (oceans much greater than land) for typical Earth surface temperatures in the range 210-320 K. Also, across this temperature range, the oceans have slightly higher LWIR emissivity (~0.98) than averaged land surfaces (~0.95), so this also a small but accountable difference.
You fail to address (a) the Dec24-Jan25 anomaly changes being a reversal to cooling, not a continuation of characteristic warming, and (b) over this one month interval the land cooling rates based on US48 and Australia being 8 to 3 times, respectively, faster than the tropics (TROPIC) which are about 75% oceans in areal extent.
These facts would imply any time-lags involved must be far less than one month in characteristic duration.
ToldYouSo:
See my satellite images of atmospheric SO2 aerosols posted earlier.
Rapid increase in Chinese SO2 aerosol pollution levels.
Yeah, yeah, yeah . . . so your song goes on.
I’m anxiously awaiting newly-revealed characteristics of those largely unappreciated SO2 aerosols (hah!) that explains:
— for the single month span of Dec 2024 to Jan 2025, why the “US48” and Australian land masses have many times greater decreases in GLAT anomalies compare to those measured over oceans, and
— why the SO2 aerosols from Hunga-Tonga’s Jan 2022 eruption “waited” about nearly 3 years to start cooling GLAT (as potentially indicated by UAH, per their graph in the above WUWT article)
Also, you refer to a “rapid increase in Chinese aerosol pollution levels” but the color contour plots of SO2 concentration over Earth’s surface for Jan 22, 2024 compared to June 8, 2023 (that you posted) do not show any really significant such increase. Oh well.
ToldYouSo:
The water fallout from the Hunga-Tonga flushed most of the industrial SO2 aerosol pollution from the atmosphere, causing the 2023 El Nino.
This ended around Nov of 2023, and the on-going SO2 aerosol pollution from China (the cause of the 2020-2023 La Nina) resumed its cooling effect.
You are mistaken about the color contour maps. They show a VERY significant increase in SO2 aerosols, much larger than the SO2 from a VEI4 volcanic eruption, which typically causes 0.2-0.4 deg C of temporary cooling.
OK, let’s put that to the test. By eyeball, which of these two color contour plots of SO2 concentrations has the “VERY significant increase” (your words) over China compared to the other (quickly now, and not fair cheating to find the dates on each plot):
I will say it again. @Roy and John. Why report on the temp. trend over land and over oceans instead of rather reporting on NH and SH separately? It creates a wrong impression. Unless that is the impression that you want to create?
Surface Air Temperature (SAT) versus Sea Surface Temperature (SST) | Bread on the water
Errrr . . . if you examine the table presented in the above article you’ll see that Dr. Spencer is reporting monthly variations in temperature anomalies for Earth’s northern hemisphere (“NHEM.”) and, separately, Earth’s southern hemisphere (“SHEM.”). This has also been done in his past articles posted on WUWT.
Using that tabulated data, one could relatively easily construct their own graph of temperature (anomaly) trends over NH and separately over SH, which would also allow linear regression analyses to develop “degree-C/decade trends” for both data sets.
Temperature trends for NH and SH would have a mix of land- and ocean-temperature response time constants (due to differing thermal inertias/heat capacities) and comparing the two hemispheres would mean one fully considers effects of varying solar insolation versus month-of-year for NH vs SH as well as the effects of much great land area in the NH vs SH. Sounds complicated, but perhaps I have a different impression than you.
That does not renove the false impression created.
If you wait a day or two, all the data is published in the links provided. This includes regional breakdowns for land and sea in both hemispheres and various subregions. It also includes the overall trend for each region.
I do wish these data could be updated at the same time as the blog post.
That does not remove the false impression created.
You people are just not getting it. A tiny bit of more CO2 in the atmosphere cannot possibly heat all of the oceans to the extent as being alleged or falsely or erroneously being implied by Roy and John.
It appears to be mostly you that claims UAH satellite data has any asserted dependence on atmospheric CO2 concentration levels or changes thereof.
Certainly, Drs. Spencer and Christy don’t assert such. Nor, AFIK, does the University of Alabama at Huntsville. The above article, as similar ones from Dr. Spencer in the past that have been posted on WUWT, makes no reference to CO2.
Care to post a solid reference/link to where Spencer/Christy/UAH have claimed (or in your word “implied”) that their ocean and land surface temperature measurements have been connected to variations in atmospheric CO2 levels? Such, if it existed, might benefit “us people”.
Maybe, if you read my report you will understand what I am saying. They are creating a wrong impression that even they themselves don’t want…
I did waste the time time to read your gibberish at “Surface Air Temperature (SAT) versus Sea Surface Temperature (SST) | Bread on the water” that you linked earlier.
Not unexpectedly, I didn’t find anywhere therein ANY reference to Spencer/Christy/UAH claiming that their satellite measurements of changes of GLAT over either oceans or land surfaces related in any way to atmospheric CO2 concentrations. This includes your listed 11 “Footnotes (links to the reference reports)” in that blog article.
IN FACT, it is only you that introduces the concept of CO2 affecting global temperatures in your own article.
Care to try a different claim?
All the data is there. The links don’t include January yet. Here’s all of the data through December.
That does not remove the false impression created by the report IN WORDS by Roy and John.
Surely the warming spike that the WEF’s UN’s Guterres called “global Boiling” was the effect of Hunga Tonga and now that influence is waning the globalist cabal are going to find it hard to lie going and Trump Drill Baby Drill will look increasingly vindicated. I think this is amazingly good news. Here in UK the WEF pinup Herr Starmer has allowed Bovear 10 to be put in the cattle feed to reduce methane, no one has been asked and not many even know. So bovear10 in the bovine food chain is an inconvenient hoof
Aaaawwww. As an advocate of warmer-is-better I cannot celebrate a time series with a downward slope. I know the downside is probably due to natural variability or one of the acronym-named oscillations. Still sad. Come on warmer!
I cant’ imagine you are referring mass of Spencer/UAH data, where as clearly stated in the above article “global area-averaged temperature trend (January 1979 through January 2025) remains at +0.15 deg/ C/decade (+0.22 C/decade over land, +0.13 C/decade over oceans). The plus signs, of course, referring to upward slopes.
Do you mean to imply instead that the Jan 2025 data compared to the Dec 2024 anomaly comparisons have established “a time series with a downward slope”???
I meant the last bit, the right half of a spike a few years long. I agree the full span is upward-trending, which I’d prefer to continue during my lifetime. It can correct downward when I’m worm food.
If you squint really closely, you can see the influence of incremental CO2 in this record of ups and downs. Oh, wait, that was a smudge on my glasses. Never mind. The “no effect” null hypothesis remains intact.
Yes, I know about the 0.15C per decade overall warming trend in this record. So what?
That 1.5C (1.3C ocean) per decade 45-year trend came during the warming portion of an approximately 75-year cyclical warming/cooling natural phenonium.
There is no climate emergency.
If you want to investigate the CO2 warming effect of CO2 in the UAH data, you have to look at the periods between these major El Nino events.
From 1980-1997, there was essentially no warming
From 2001-2015, there was no warming
And from 2017-2023.4, there was actually a distinct cooling trend.
Ahhh . . . but to investigate the lack of CO2-warming effect in the UAH data, don’t we likewise have to look at periods between major La Niña events?
IOW, “What’s sauce for the goose is sauce for the gander.”
Re: your statements:
La Nina events occurred in:
2008
2011
2012
2021
2022
and we entered the on-going La Niña in December 2024.
If there is a 2C temperature anomaly on a 60C measurement, that is not the same magnitude change as a 2C anomaly on a 20C measurement. Using this arithmetic is bogus.
2/(60+273.15) is not the same as 2/(20+273.15)
Close, but makes for misleading conclusions.
Must use Kelvin
Will it go below -0.2 this time in the absence of Tonga water vapor?
If it does drop to -ve numbers in a few month…
…. it will be fun to watch the antics of the alarmists. 🙂
For those comparing Australia and Global UAH graphs, here is a comparison.
I started it in 2020, ended at end of Jan 2025, hoping to display the differences with a suitable scale.
The temperature scales are matched. There is far more variability in the appearance of Australian data than in Global.
The “peak” in global 2024 that causes discussion about Hunga Tonga and ocean cycles has rather different character. There would be a naive expectation that with HT in the southern hemisphere, it might appear more strongly in Australia than in northern hemisphere locations.
I am not adequately expert to surmise about the physics driving these charts.
Geoff S
Actually, the HT WV in the stratosphere spread out in about 12 months to cover both north and south of the equator at least to 75N and 75S
So I’m not sure you would expect much difference between hemispheres.
and at 75 N and S by altitude….
Actually, there is no credible explanation as to why it took about 18 months for the WV the H-T eruption of January 2022 injected into the stratosphere to begin causing GLAT warming (evidenced June 2023), as is the oft-cited explanation for the spike in GLAT as seen in the UAH graph posted in the above article
Also, I remain fascinated by those high frequency (i.e., about one cycle per month) oscillations in H2O concentration—amplitude of about 0.5 ppm at 75N latitude and amplitude of about 1.0 ppm at 75S latitude—seen for at least six months starting around May 2024.
Of course, such “has to be real” because it is measured . . . and is explained by ???
Who knew that stratospheric water vapor could behave is such a fashion, especially in both hemispheres and essentially instantaneously across altitude ranges of about 25 to 40 km.
/sarc
This is a basic question. When the global lower atmosphere temperature drops by 0.1C where does the energy go?
The enthalpy of moist air is
h = ha + r(hw)
where h is total enthalpy, ha is the enthalpy of dry air, hw is the enthalpy of moist air, and r is the humidity ratio.
So the energy may not go anywhere. It may just go into a higher value of “r”.
Wow! That was fast! Trump has been in office for only a couple of weeks, fixing so much stuff so quickly that the media can’t keep up. He’s already fixing global warming without taking any credit for it! Something Obama never did. Remember when BO said this upon winning the Democrat Party nomination for president in June 2008?
“this was the moment when the rise of the oceans began to slow and our planet began to heal”
Those who can, do. Those who can’t, run for office as Democrat, Liberal, Labour, Social Democrat, Green, Socialist…
Actually, as noted by Dr. Spencer in the above article:
“The Version 6.1 global area-averaged temperature trend (January 1979 through January 2025) remains at +0.15 deg/ C/decade (+0.22 C/decade over land, +0.13 C/decade over oceans).”
So, in fact, Trump has done nothing—nor can he or anyone else do anything—to “fix” global warming.
“Global warming” is baked into the nature of Earth’s pattern of glacial-interglacial cycles of about 100,000 years periodicity (starting about one million years ago), considering that Earth exited the last glacial period only some 12,000–13,000 years ago.