The atmosphere, including the formation and dissipation of clouds, is the authentic model of its own performance as a variable emitter from its own stored energy, and as a controller of emission from the surface to space.
Let’s just watch from space, in one of the bands of wavelengths in which the radiative “warming” effect of incremental CO2 is claimed to be capable of forcing energy to accumulate on land and in the oceans as sensible heat.
The passive concept of a radiative insulating layer is plainly wrong. It’s powered, not passive.
The static concept of the lapse rate forcing the effective radiating level higher, thus driving the surface temperature up to compensate, while valid in theory in my view – all else being equal – also fails to address the question because obviously all else is not equal.
This is the description from the video.
*****************
Are emissions of non-condensing greenhouse gases (GHGs) such as CO2 a risk to the climate system? Watch from space to see whether the concept of a radiative heat “trap” explains the observed result.
This time-lapse video captures 7 recent days of hourly images generated by NOAA from high resolution full-disk radiance data from the GOES East geostationary satellite for Band 16.
NOAA calls this the CO2 Longwave IR (infrared) band. It is centered at a wavelength of 13.3 microns, at the edge of the “atmospheric window” part of the infrared spectrum. The “brightness temperature” color scale for visualization is such that the radiance at 50C on the scale (red) is 13 times the radiance at -90C (white.) It is in this narrow band of wavelengths that a significant part of the claimed static warming effect of incremental CO2 concentrations is computed.
So what? The emitter output is obviously not that of a passive radiative insulating layer. The motion of the atmosphere is a response to absorbed energy and to the rotation of the planet. These dynamics change everything about where to expect the energy involved in the static warming effect (i.e. the GHG “forcing”) experienced at the surface to end up. The formation and dissipation of clouds dominates the overall result, and the overturning circulations at local, regional, and global scale produce highly variable emitter outputs over time and location. It is all strongly self-regulating as the motion delivers just enough absorbed energy from the surface to high altitude and from the tropics to the poles to be more easily emitted to space as longwave radiation.
The atmosphere is the authentic model of its own performance as an emitter and as a controller of longwave emission from the surface. What do we see and learn from watching it perform? The visualization helps us grasp that heat energy cannot be made to accumulate on land and in the oceans to harmful effect by what increasing concentrations of non-condensing GHGs do in the atmosphere. And for whatever warming has been experienced and measured down here, the minor effect of increasing GHGs cannot be isolated for reliable attribution.
So as I see it, is there risk of harmful warming from GHGs? No. We can see from space that it doesn’t work that way. [Edit 8-23-2023 The color scale NOAA uses to convert “brightness temperature” for the visualization is given here. Brightness temperature itself is computed by NOAA from the radiance data, using an equation and coefficients from the user manual for the imager. The radiance at 50C “brightness temperature” (red) is 13 times the radiance at -90C (white.) Radiance is the strength of the flow of energy being emitted from the planet and sensed at the satellite in this band.]
If honest investigators had started fresh with these visualizations, would there have been any concern at all about rising CO2 driving the climate outcome? I can’t see how.
You have poste the same claptrap “science” here perhaps 100 times. Why don’t you find a few scientists who agree with you and post what they say, as a refreshing change of pace?
Hello again RG, “Does this non-response mean there are NO scientists who agree with your theories?” No, it does not mean that. And for that matter, there is no need for a new or distinct theory at all. I am just describing, interpreting, and showing what others have already discovered, confirmed, characterized, recorded, visualized, theorized, etc.
“You are one of a kind?” It’s not about me, Richard. It’s about the openly available evidence. But sure, I am unique, just like all the other billions of people down here.
Actually what you are calling 1-D are more like 0-D diagrams — they convey no nuance of lateral or vertical variation. Yes, you are correct. They are not especially helpful toward explanation of a complex topic.
Why is the GOES band 16 relevant? It occupies the edge of the range of wavelengths called the “atmospheric window” where partial absorption of IR by both CO2 and water vapor takes effect. A significant portion of the incremental static radiative effect of the 2XCO2 case is within this band, centered at a wavelength of 13.3 microns. This plot uses MODTRAN to show this effect in magenta.
The atmosphere, including the formation and dissipation of clouds, is the authentic model of its own performance as a variable emitter from its own stored energy, and as a controller of emission from the surface to space.
This is the trivial aspect. The dominant control is on the amount of sunlight that the atmospheric ice allows to be thermalised. Ice currently knocks out average of 29% of incoming solar. But over ocean warm pools more than 50% of the incoming solar is reflected and in excess of 85% above a cyclone or tornado.
You say “trivial” but I say let’s first respond directly to the claim that the emitter is de-rated by incremental CO2. I don’t disagree at all with your view of the importance of ice clouds to albedo and thus to the matter of climate system response.
Last year I prepared and shared 2 sets of time-matched GOES West (full disk) images and videos to make the point that the longwave Band 16 visualizations and the GEOCOLOR images go well together to make the case that both the emitter and reflector performance are actively driven. Dynamic self-regulation. More here. https://wattsupwiththat.com/2024/08/18/open-thread-107/#comment-3956907
“Ice currently knocks out average of 29% of incoming solar”
Total BS Clouds block about 20% and most clouds are made of water vapor, not ice. Do you fact check yourself before posting? You should.
Most clouds are made of water droplets, which form when water vapor in the air cools and condenses, meaning they are primarily composed of liquid water rather than ice, although some clouds at higher altitudes can be composed mostly of ice crystals depending on the temperature.
About 29 percent of the solar energy that arrives at the top of the atmosphere is reflected back to space by clouds, atmospheric particles, or bright ground surfaces like sea ice and snow.
According to most information available, clouds typically block around 20% of sunlight, meaning that even on a cloudy day, a significant portion of the sun’s rays can still reach the Earth’s surface; therefore, it is generally considered accurate to say that around 20% of sunlight is blocked by clouds.
I stated the 29% for ice as it is the dominant reflector of solar EMR. All other reflectors are bit players.
The average radiating temperature of Earth is 255K – well below freezing. That means, on average, there is at least 1mm of ice as the long wave emitter to space. That same ice is highly reflective.
On a daily basis the reflected solar EMR ranges from 0 to 360W/m^2. That kills your notion that there are ever present particulates reflecting solar radiation.
The highest reflected solar always occurs with the lowest OLR with a radiating temperature well below 273K so the OLR is being emitted from ice and the solar EMR reflected from ice.
Atmospheric ice is ubiquitous but not always visible.
It’s not 29% blocked by clouds alone
The clouds are mainly water vapor
You were wrong twice but obviously do not care about accuracy.
According to most meteorological classifications, a relatively small percentage of clouds are considered “high altitude clouds,” typically ranging around 10-20% of the total cloud cover in a given area, as high clouds like cirrus are generally less prevalent than mid-level and low-level clouds.
The exact percentage varies depending on location and atmospheric conditions, with estimates suggesting that around 70% of clouds at high altitudes could be composed of ice while lower clouds are more likely to be water vapor based.
10% x 70% is 7%
20% x 79% is 14%
You seem to be claiming that 7% to 14% of clouds, the estimated ice clouds, block MORE sunlight than the 86% to 93% of clouds that are water vapor clouds.
You are not a great observer. Have you ever looked over a field covered in snow? Have you ever looked over an ocean?
Water reflects very little sunlight unless it is at a high angle of incidence. Ice in the form of snow reflects almost all sunlight at any angle of incidence.
The clouds that limit the ocean temperature to 30C form over warm pools at an altitude between 7km and 20km. They are ice clouds. Sometimes not always visible from the surface.
The white portion of this image is ice cloud. The dark blue portion is water. The great portion are water/ice clouds:
Mixed phase clouds are as much solar absorbers as solar reflectors. They appear over ocean and land at a surface temperature below 15C and reduce heat loss from the surface. The high ice clouds work the oposite way they reflect between 70 to 100% more solar EMR than their reduction in OLR so limit surface heat uptake.
Measurements and observations have been made on the development of ice in 90 cumulus (cumulus and cumulonimbus) and 72 stratiform (altocumulus, altostratus, nimbostratus, stratocumulus, and stratus) clouds. Ice particle concentrations significantly in excess of those to be expected from ice nucleus measurements (i.e., ice enhancement) were measured in 42 of the cumuliform and 36 of the stratiform clouds.
The static concept of the lapse rate forcing the effective radiating level higher, thus driving the surface temperature up to compensate, while valid in theory in my view – all else being equal – also fails to address the question because obviously all else is not equal.
Not valid in theory either. It is based on one incorrect assumption … static energy emission in the atmosphere by GHGs. They are not static. Once the correct increase in energy emissions is used, the radiating level is constant for well mixed GHGs.
“Not valid in theory either.” On one hand, you may be right that eventually the radiative transfer theory used, for example, for MODTRAN, will turn out to have been seriously “off”. On the other hand, the computed static “warming” effect does not determine the end result on land and in the oceans in any case. This is the point I often post about with supporting evidence from GOES and from the computed ERA5 outputs.
Make sure to add in the concrete barrier at the end to ensure the plane explodes when it over runs the runway.
Ron Long
January 26, 2025 2:23 am
The Difference between Average and Normal. The average number (sum of all values divided by the number of values), and median (the mid-point between value extremes), even when including some expression of variance (like two standard deviations), is not the same as Normal. If it rains 2 inches one year and 92 inches the next year the mean, median, and variance are irrelevant. Normal is 2 to 92 inches of rain. There, now I feel better.
‘Normal’ is one of those English words with too many meanings, Ron. It can mean ordinary, healthy, harmless, perpendicular, conforming to a norm or standard, and the list goes on.
When I see ambiguity like that, I prefer to go for a more precise word. In your example, and the sense you are asserting, it is not unprecedented to see between 2 and 92 inches of rain.
We need more data to opine on whether 2 or 92 or both are unusual. If (with more data points) the mean is found to not be 47, but those are the extreme values over a long period, then arguably they are not part of a normal distribution.
“Coal powered time machine” – great line! Now Trump supports coal-powered data centers! Gotta love this welcome change from the “existential threat” guy.
Young again, might put in a piece about “ “Large blocks of ice…” ”floating down the Mississippi past New Orleans in 1899. Made it to the Gulf two days later when inch thick ice formed in the bays. (Berry, J. 1899. Climate and crop service. Monthly Weather Review. 27(2):53-55; Henry, A. J. 1899. The weather of the month. Monthly Weather Review. 27(2):50-53.)
I wasn’t there, and don’t remember many details, but I did read about icebergs being visible off the east coast during the 20th century, all the way down to Florida, as they made their further south to melt.
This analysis of the full 25 years of NASA CERES mission data demonstrates a perfectly flat greenhouse effect over time. This matches what was found in Miskolczi 2010 and better described in his 2023 paper.
What we now have are two separate analyses, based on different data, demonstrating a constant greenhouse effect over the last 77 years. There is no longer any reason for skeptics to argue among themselves. All of the climate changes over the past 77 years were natural.
There is also no need to come up with negative feedback theories. None are needed. All that is needed is understanding why clouds have been decreasing. We now know the decrease has caused more solar energy to warm our planet.
Yes, I’ve heard that claim. The cloud change result requires new science. Right now, all the cloud change claims are based on warming first. But, as this data shows, all the warming came from the cloud changes. There was no “warming first”.
This also requires admitting they were wrong about CO2 causing more warming. Once they do that why would anyone believe anything they say?
Total BS
According to recent research, global cloud coverage percentage has been declining in recent decades, particularly low-altitude clouds over certain ocean regions, which could be contributing to rising global temperatures by allowing more sunlight to reach the Earth’s surface; studies have shown a noticeable drop in cloud cover over the past few decades, with some research indicating a decline of around 1.5% per decade.
I have seen other estimates of a 7% decline over the past two decades.
Both percentages are statistically insignificant as measurements of cloudiness percentage have a margin of error of AT LEAST +/-10%
GLOBAL cloudiness data start in about 1995 with meaningless tiny changes until two decades ago, if you cherry pick ONLY the -7% worst case cloudiness reduction claim for the past two decades.
The current global warming trend began in 1975, almost 50 years ago. NOT two decades ago
“Contiguous U.S. annual average temperature anomalies and trends from the USCRN and ClimDiv relative to a 2005-2022 USCRN period of record. Data available from NOAA’s National Temperature Index.
We can see this clearly if we compare trends over the 2005-2022 period. “
My own quest for reasons explaining cloud changes have found several potential causes.
1) The AMO cycle change of 1995-97 saw a significant decrease in clouds measured by the ISCCP project. With the next AMO phase change expected fairly soon (60+ year cycle), we should get a better view.
2) Another large change occurred from 2014-16. This correlates with a couple of events. A PDO phase change, the buildup to a major El Nino and the eruption of the Bardarbunga volcano. What was unique about the eruption was the ejection of large quantities of chlorine into the stratosphere.
3) In 2022 we had the Hunga-Tonga eruption which also injected lots of chlorine into the stratosphere. This is what got me interested in the earlier eruption. Again we had a large decrease in clouds.
There was also a large climate change in 1976 but we don’t have any cloud data. Turns out an Axial seamount undersea eruption occurred that year. This would also have injected some chlorine into the atmosphere. This one was much deeper and wouldn’t have been nearly as significant as previously mentioned eruptions. So, it’s doubtful.
The PDO also moved into its positive phase in 1976 which is more likely related.
Most warming is at night. Cloudiness percentage is a proxy, not a direct measurement of how much solar energy clouds actually block. Less cloudiness should make days warmer and nights cooler, but nights are getting warmer faster than days. (by nights, I mean TMIN that is often 30 minutes after dawn)
WE not only ignored all evidence of greenhouse warming, he also ignored almost all data from 362 climate and weather satellites. He cherry picked CERES data from a few satellites and came to different conclusions than NASA and Dr. Loeb, who own the CERES satellites, instruments and data. Is there a conspiracy going on?
The WE article was just an extreme opinion, not the gospel. WE contradicted at least 99.9% of scientists since 1896 with his CO2 Does Nothing explanation. But the Peanut Gallery at WUWT loves CO2 Does Nothing. So WE is their hero.
If WE is right
then everyone else is wrong?
Happer is wrong?
Lindzen is wrong?
Spencer is wrong?
Christy is wrong?
Curry is wrong?
No need for more climate articles at WUWT … If WE really has it all figured out
Perhaps WUWT should add CO2 DOES NOTHING
to their home page.
That will really impress people
I’m still not convinced this “RG” account is a genuine single account holder, from it displaying utterly contradictory positions. Guy claims to be an AGW skeptic, but cites pure defamation material copied ‘n pasted straight out of Greenpeace against Willie Soon. Guy claims to be a Trump voter, but uses pure leftist wording elsewhere (under his bimbo avatar commenter account) against Trump. Guy claims to be a blog editor at a site which looks like nothing more than a computer program-generated conveyor belt of other website page links. Folks would take only one look at his eyesore-arranged site and never return again, yet he claims he’s now approaching a million page views – a jump of a quarter million people in just 9 months in 2024 – resulting from nothing more than his own self-promotion in comment sections. That doesn’t pass the smell test.
I’d recommend stopping the “RG” account because of it having every appearance of being some kind of troll account with bad intentions here, operated by more than one person.
WOW! This explains ALOT. Either you’re correct or I just assumed that RG is simply a ‘crotchety old fool’ who is taking a contrary position on everything just to be contrary.
Personally it doesn’t bother me overly much if someone takes a contrary position that they than try to support even against a flood of evidence against that position, at least you can engage in a debate on ‘knowable positions’. But holding no position, or claiming a position and than at every turn undermining that position in a ‘random’ way isn’t someone you can have an agreeable intellectual debate with and thus should simply be ignored.
Unfortunately RG seems to pop up far too much and people engage him far too much. I’m a bit of a ‘free speech absolutist’, so I wouldn’t suggest banning (stopping) him, though censoring for rude/distasteful content can be justified. But the concept of ‘the answer to incorrect speech is more speech’ does NOT mean we have to engage with RG directly. Its hard maybe but I would suggest we just ignore him (e.g. don’t engage directly, post new comments with useful content independent of anything RG posts).
By this time last year, I’d already noticed the commenter’s name before in WUWT comment sections – the “Greene” name stood out a little as being sorta ironic for someone the pro global warming people would despise – but the real attention grabber for me was his tirade in the Jan 2024 WUWT post about Tucker Carlson interviewing Willie Soon — “RG”‘s quote was literally word-for-word copied out of Greenpeace. No AGW skeptic would seriously quote Greenpeace as a source for information on character assassination angles. It was not logical. So, I took a little time to find out when “RG” arrived here at WUWT, which led to my comment post here on the braggadocio claims RG made about the page view counts at his ‘blog.’ What I also ran across in that search effort was his Disqus bimbo avatar commenter account, where in just a year flat, he’d belted out several thousand comments. Now, as of today, “RG” is up to just under 7500 in only two years of existence, which averages out to 10 comments per day, every single day, in addition to whatever comments he put out elsewhere under different commenting systems. The whole persona of “RG” just doesn’t look right.
All Willis did was use CERES data and plot the result. The NASA scientists are the ones calculating solar radiation and outgoing radiation. Is there some reason you believe NASA did it wrong?
There is no evidence of recent greenhouse warming. That is a product of your imagination. There is lots of evidence of warming and there are reasonable explanations for it.
There’s also the physics I have explained a few times which supports the no warming position.
Willis was also a lukewarmer based on most of his related articles. His position appeared to be emergent feedback/s would limit the warming. He would also have been on your list.
Turns out everyone was wrong if they believed CO2 was causing recent warming. I suspect many of them would be pleased to find out they were wrong. Why aren’t you?
Not only that, but someone (I don’t have the link to it now) posted a link to a TWTW (The Week That Was) article from May/2024 which included what appear to be quotes from the CERES team themselves indicating that after ‘correcting’ their data they conclude that the changes in outgoing radiation can be entirely attributed to “Large ASR trend primarily driven by reductions in low and middle clouds.”…e.g ‘changes in Absorbed Solar Radiation’ which is EXACTLY what Willis’ article & calculation concluded from the same data…
Not to diminish Willis’ contribution to the discussion on WUWT but it is not perhaps surprising that the paper you linked to provides the same conclusion. I haven’t absorbed the paper in total (though I plan to soon as it looks very interesting), but the paper references an equation that they call the ‘normalized green house factor’, which, assuming I’m translating definitions properly, is just “1 – (Willis’ Green House efficiency)” (sorry I don’t know how to include mathematical equations in comments).
To that extent the paper linked to comes to the same conclusion because they are effectively calculating the same value. The paper linked to seems to go FAR further in its conclusions than Willis chose to and to that extent I want to take more time to absorb it (I can follow the calculations and argument, just need time to focus) but it does appear quite interesting.
abolition man
January 26, 2025 6:41 am
One thought that has been rolling around in my head, and keeps coming back to the forefront like a bad penny; is just what kind of person would blatantly alter or hide their ”scientific” research data!?
We know from the Climategate e-mails that CRU and others were openly discussing altering data to make the historical record appear cooler, with less variability; and from Steve McIntyre we learned that Mickey’s Hockey Trick was the product, regardless of the data entered! Does that make them stupid or evil!? I believe the correct answer is: BOTH!
Some are clearly stupid, and wouldn’t recognize the Scientific Method if it walked up and slapped them like a jilted lover; while others are obviously sociopathic, selling their integrity for the perks of membership in the Climate Cabal. They have sold their souls for the requisite thirty pieces, and yet continue to profit from GangGreen, and prop each other up as figures of authority!
Might not an investigation into conspiracy to commit fraud be useful? I can just imagine how testimony in front of Congress might cause some leading alarmists to change their tune! And if they avoid criminal charges, there is still the prospect of a class action lawsuit! That’s the nice thing about conspiracies; there is no statute of limitations!
Same thing for data that showed low saturated fat diets were associated with bad outcome.
Beta Blocker
January 26, 2025 6:44 am
The European Union is about to impose a ‘Double Down on Davos (DDoD)’ economic policy which seeks to accelerate the EU’s transition to wind & solar energy while further integrating and centrally controlling all the economies of the member states:
“Brussels is planning to ramp up the European Union’s green crusade, a move meant to make the bloc more competitive, a leaked document seen by Brussels Signal has disclosed. …. The leaked plan also called for member states to hand more power to Brussels, allegedly for the sake of ramping up the bloc’s energy security and defensive capabilities.”
The EU is hell-bent on societal suicide, but it’s getting harder to imagine that a majority of citizens in the EUSSR are going to be willing to continue marching passively to their own slaughter when they see that not only China and India, but also the US refuse to drink the Kool-Aid.
If the Deep State fails to assassinate Trump, that is.
‘Isn’t the only hope for this planet that the industrialized civilization collapse? Isn’t it our responsibility to bring that about?’ – Maurice Strong, UN
It would also seem from recent news that many democrats also believe it is their duty to see to it that Trump fails in his attempts at reform political. My words for that attitude and behavior is “conspiratorial sedition” whereby they don’t care about the results of an election and will do whatever is necessary to preserve the status quo.
The biggest problem for them is that they didn’t foresee his third election, and never thought for a minute about the consequences of giving him 4 years to plan for it.
What is it that Doomberg says? The road from energy abundance to energy poverty passes through riots and insurrections, or something to that effect! We’ll be watching Europe closely to see if and how they navigate their way out of the mess that their ruling classes have led them to!
I hear the Billionaire Boys Club of Davos is setting new, all time records for the number of escorts (prostitutes) hired this year. You’d think that after how hard they have f#(&ed England and Europe over the last few years, they might be ready for a cigarette break and some room service instead!
double down on anti CO2 policies and increased central planing.
i.e. attempt to ensure national suicides before awareness of how un-competitive they are becoming forces Brussels and its lackeys out of power.
willhaas
January 26, 2025 2:04 pm
Despite the hype. there is no real evidence that CO2 has any effect on our global climate system. There is plenty of ratinale to support the conclusion that the climate sensivity of CO2 is effectively zero. The AGW hypothesis has been falsified by science. For the truth abo9ut climate change one should read “The Rational Climate e-Book” by Patrice Poyet which one can download for free from the Internet.
There are multiple ways to disprove the GHE hypothesis, which is nothing but a mathematical artifact of a model that does not represent the Earth atmospheric system. Sadly, it seems that policy now disallows the publication of any articles that do not sufficiently conform to the GHE narrative.
In Poyet’s e-book there are numberous falsifications of the AGW hypothesis. For example facts concerning the dry and lapse rates falsifies the hypothesis. For example the fact that adding CO2 to the atmosphere does not increase the dry lapse rate in the troposphere is evidence that adding CO2 to the atmosphere does not increase the thermal isulating properties in the troposphere and hence does not cause any related sueface warming. Infact adding CO2 to the atmphere slightly reduces the dry lapse rate which causes surface cooling. Any CO2 bassed warming in theory increases the amount of H2O added to the atmosphere. Because the wet lapse rate is significantly less than the dry lapse rate in the troposphere, the adding of more H2O to the atmosphere causes surface cooling and not more warming. Hence H2O should act as a negative and not a positive feedback to any CO2 bases warming. This takes place because of evaporative cooling. In general the AGW hypothesis is based on only partial science and is so full of flaws that the AGW hypothesis cannot be true.
I don’t have any major issues with Poyet’s work. I’ve not read it in detail but I have scanned through it and read some sections. He is on the right track but some of the arguments could be more succinct. The length of his treatment gets in the way to some extent. The climate/weather system is driven by water, solar irradiance, gravity, and the rotation of the Earth. The entire CO2 narrative is a “tragedy of errors.” I continue to work on this, but the sad reality is that there is great resistance even within the so-called “skeptic” community, and so it is very difficult to have a rational discussion about alternative perspectives in an open forum. Right now, I think Tom Nelson’s channel on YouTube is the only forum where contrary hypotheses can be aired.
Poyet’s e-book is very profusely documented and referenced. In many parts of the book he points out where the AGW hypothesis has been falsified by science.You need to read it in enouth detail to find those passages. The falsifications of the AGW hypothesis are very clear and undeniable. You need to adequately study this. Poyet says that to really understand his book one needs to have at least a master’s degree in an applicable subject.
Again, I have no issue with Poyet’s work. It is the length and breadth of the work that gets in the way. The root of the problem is the GHE which only exists in models and relatively easily falsified. While Poyet presents a lot of data and discusses many phenomenological inconsistencies, in order to falsify the GHE one needs to both show what is wrong with the model and why it is not valid and provides an alternative that better fits observations.
You seem to be fishing at the end for my curriculum vitae. I have an advanced degree in mathematical physics and extensive tech/industrial experience with the transport of heat energy under a very broad variety of conditions.
It was reported last night on Fox News that President Trump may decide to make his first overseas trip as president to the UK!
I hope he does! Maybe Trump can expose Labour’s suicide Net Zero plan to the voters a little better than they have had it explained to them before. 🙂
Trump would definitely get the conversation started. He would start out by telling the citizens just how bad windmills and solar are for the UK and their economy.
Nuclear plants too expensive?
In France, the turnkey cost of the 1,600 MW Flamanville plant was $13.7 billion, or $8,563/installed MW
Plants built by Russia, China and South Korea are about $5,000/installed MW
Expensive nuclear plant building is strictly a “rules-based” Western thing.
. Nuclear Plants by Russia
According to the IAEA, during the first half of 2023, a total of 407 nuclear reactors are in operation at power plants across the world, with a total capacity at about 370,000 MW
Nuclear was 2546 TWh, or 9.2%, of world electricity production in 2022 https://www.windtaskforce.org/profiles/blogs/batteries-in-new-england
Rosatom, a Russian Company, is building more nuclear reactors than any other country in the world, according to data from the Power Reactor Information System of the International Atomic Energy Agency, IAEA.
The data show, a total of 58 large-scale nuclear power reactors are currently under construction worldwide, of which 23 are being built by Russia.
.
In Egypt, 4 reactors, each 1,200 MW = 4,800 MW for $30 billion, or about $6,250/kW,
The cost of the nuclear power plant is $28.75 billion.
As per a bilateral agreement, signed in 2015, approximately 85% of it is financed by Russia, and to be paid for by Egypt under a 22-year loan with an interest rate of 3%.
That cost is at least 40% less than US/UK/EU
.
In Turkey, 4 reactors, each 1,200 MW = 4,800 MW for $20 billion, or about $4,200/kW, entirely financed by Russia. The plant will be owned and operated by Rosatom
.
In India, 6 VVER-1000 reactors, each 1,000 MW = 6,000 MW at the Kudankulam Nuclear Power Plant.
Capital cost about $15 billion. Units 1, 2, 3 and 4 are in operation, units 5 and 6 are being constructed
. In Iran, Rosatom started site preparation for a nuclear power plant, 2 VVER-1000 units, each 1050 Mwe, in September 2016. Construction started in March 2017. Units 2 and 3 are planned to be completed in 2024 and 2026. Unit 1 at the Bushehr site went on line in 2012.
.
In Bangladesh: 2 VVER-1200 reactors = 2400 MW at the Rooppur Power Station
Capital cost $12.65 billion is 90% funded by a loan from the Russian government. The two units generating 2400 MW are planned to be operational in 2024 and 2025. Rosatom will operate the units for the first year before handing over to Bangladeshi operators. Russia will supply the nuclear fuel and take back and reprocess spent nuclear fuel. https://en.wikipedia.org/wiki/Rooppur_Nuclear_Power_Plant
.
Russia is the only country with nuclear powered ice breakers.
The biggest ones steadily go through 7 METERS of ice.
.
Rosatom, created in 2007 by combining several Russian companies, usually provides full service during the entire project life, such as training, new fuel bundles, refueling, waste processing and waste storage in Russia, etc., because the various countries likely do not have the required systems and infrastructures
.
Remember, these nuclear plants reliably produce steady electricity, at reasonable cost/kWh, and have near-zero CO2 emissions
They have about 0.90 capacity factors, and last 60 to 80 years
Nuclear does not need counteracting plants. They can be designed as load-following, as some are in France
. Wind: Offshore wind systems produce variable, unreliable power, at very high cost/kWh, and are far from CO2-free, on a mine-to-hazardous landfill basis.
They have lifetime capacity factors, on average, of about 0.40; about 0.45 in very windy places
They last about 20 to 25 years in a salt water environment
They require: 1) a fleet of quick-reacting power plants to counteract the up/down wind outputs, on a less-than-minute-by-minute basis, 24/7/365, 2) major expansion/reinforcement of electric grids to connect the wind systems to load centers, 3) a lot of land and sea area, 4) curtailment payments, i.e., pay owners for what they could have produced
. Major Competitors: Rosatom’s direct competitors, according to PRIS data, are three Chinese companies: CNNC, CSPI and CGN.
They are building 22 reactors, but it should be noted, they are being built primarily inside China, and the Chinese partners are building five of them together with Rosatom.
American and European companies are lagging behind Rosatom, by a wide margin,” Alexander Uvarov, a director at the Atom-info Center and editor-in-chief at the atominfo.ru website, told TASS.
The atmosphere, including the formation and dissipation of clouds, is the authentic model of its own performance as a variable emitter from its own stored energy, and as a controller of emission from the surface to space.
Let’s just watch from space, in one of the bands of wavelengths in which the radiative “warming” effect of incremental CO2 is claimed to be capable of forcing energy to accumulate on land and in the oceans as sensible heat.
https://youtu.be/Yarzo13_TSE
The passive concept of a radiative insulating layer is plainly wrong. It’s powered, not passive.
The static concept of the lapse rate forcing the effective radiating level higher, thus driving the surface temperature up to compensate, while valid in theory in my view – all else being equal – also fails to address the question because obviously all else is not equal.
More in the replies.
This is the description from the video.
*****************
Are emissions of non-condensing greenhouse gases (GHGs) such as CO2 a risk to the climate system? Watch from space to see whether the concept of a radiative heat “trap” explains the observed result.
This time-lapse video captures 7 recent days of hourly images generated by NOAA from high resolution full-disk radiance data from the GOES East geostationary satellite for Band 16.
NOAA calls this the CO2 Longwave IR (infrared) band. It is centered at a wavelength of 13.3 microns, at the edge of the “atmospheric window” part of the infrared spectrum. The “brightness temperature” color scale for visualization is such that the radiance at 50C on the scale (red) is 13 times the radiance at -90C (white.) It is in this narrow band of wavelengths that a significant part of the claimed static warming effect of incremental CO2 concentrations is computed.
So what? The emitter output is obviously not that of a passive radiative insulating layer. The motion of the atmosphere is a response to absorbed energy and to the rotation of the planet. These dynamics change everything about where to expect the energy involved in the static warming effect (i.e. the GHG “forcing”) experienced at the surface to end up. The formation and dissipation of clouds dominates the overall result, and the overturning circulations at local, regional, and global scale produce highly variable emitter outputs over time and location. It is all strongly self-regulating as the motion delivers just enough absorbed energy from the surface to high altitude and from the tropics to the poles to be more easily emitted to space as longwave radiation.
The atmosphere is the authentic model of its own performance as an emitter and as a controller of longwave emission from the surface. What do we see and learn from watching it perform? The visualization helps us grasp that heat energy cannot be made to accumulate on land and in the oceans to harmful effect by what increasing concentrations of non-condensing GHGs do in the atmosphere. And for whatever warming has been experienced and measured down here, the minor effect of increasing GHGs cannot be isolated for reliable attribution.
So as I see it, is there risk of harmful warming from GHGs? No. We can see from space that it doesn’t work that way.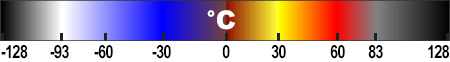
[Edit 8-23-2023 The color scale NOAA uses to convert “brightness temperature” for the visualization is given here.
Brightness temperature itself is computed by NOAA from the radiance data, using an equation and coefficients from the user manual for the imager. The radiance at 50C “brightness temperature” (red) is 13 times the radiance at -90C (white.) Radiance is the strength of the flow of energy being emitted from the planet and sensed at the satellite in this band.]
The visualization also makes it easy to see that the 1D energy balance diagrams (based on averages) are way over-simplified.
If honest investigators had started fresh with these visualizations, would there have been any concern at all about rising CO2 driving the climate outcome? I can’t see how.
You have poste the same claptrap “science” here perhaps 100 times. Why don’t you find a few scientists who agree with you and post what they say, as a refreshing change of pace?
Why don’t you, Richard?
You’re the one who lays claim to the franchise on “honest climate science”.
Nice to hear from you, Poor Richard’s Almanac of stale climate claims! You still don’t have any effective answer to the evidence from space. Be well.
Does this non-response mean there are NO scientists who agree with your theories?
You are one of a kind?
Hello again RG,
“Does this non-response mean there are NO scientists who agree with your theories?”
No, it does not mean that. And for that matter, there is no need for a new or distinct theory at all. I am just describing, interpreting, and showing what others have already discovered, confirmed, characterized, recorded, visualized, theorized, etc.
“You are one of a kind?”
It’s not about me, Richard. It’s about the openly available evidence. But sure, I am unique, just like all the other billions of people down here.
Be well.
You are hardly in a position to talk about ”refreshing”.
Actually what you are calling 1-D are more like 0-D diagrams — they convey no nuance of lateral or vertical variation. Yes, you are correct. They are not especially helpful toward explanation of a complex topic.
Good point.
Great post, David.
Evidence, and more evidence. 🙂
Why is the GOES band 16 relevant? It occupies the edge of the range of wavelengths called the “atmospheric window” where partial absorption of IR by both CO2 and water vapor takes effect. A significant portion of the incremental static radiative effect of the 2XCO2 case is within this band, centered at a wavelength of 13.3 microns. This plot uses MODTRAN to show this effect in magenta.
https://drive.google.com/file/d/175qnVngPPfZJKUPUH13u6t5wolTBl0qi/view?usp=sharing
Here is the NOAA website from which these and other GOES images can be viewed and downloaded. This link activates a 2-hour animation of the full disk Band 16 visualizations.
https://www.star.nesdis.noaa.gov/GOES/fulldisk_band.php?sat=G16&band=16&length=12
This is the trivial aspect. The dominant control is on the amount of sunlight that the atmospheric ice allows to be thermalised. Ice currently knocks out average of 29% of incoming solar. But over ocean warm pools more than 50% of the incoming solar is reflected and in excess of 85% above a cyclone or tornado.
You say “trivial” but I say let’s first respond directly to the claim that the emitter is de-rated by incremental CO2. I don’t disagree at all with your view of the importance of ice clouds to albedo and thus to the matter of climate system response.
Last year I prepared and shared 2 sets of time-matched GOES West (full disk) images and videos to make the point that the longwave Band 16 visualizations and the GEOCOLOR images go well together to make the case that both the emitter and reflector performance are actively driven. Dynamic self-regulation. More here.
https://wattsupwiththat.com/2024/08/18/open-thread-107/#comment-3956907
I also did the same for GOES East CONUS region.
https://wattsupwiththat.com/2024/08/25/open-thread-108/#comment-3959752
You’re welcome.
You have proven my point. The Band 16 is often radiating below 0C across tropical ocean. That means it is coming off ice.
As I said, “You’re welcome.”
“Ice currently knocks out average of 29% of incoming solar”
Total BS
Clouds block about 20% and most clouds are made of water vapor, not ice. Do you fact check yourself before posting? You should.
Most clouds are made of water droplets, which form when water vapor in the air cools and condenses, meaning they are primarily composed of liquid water rather than ice, although some clouds at higher altitudes can be composed mostly of ice crystals depending on the temperature.
About 29 percent of the solar energy that arrives at the top of the atmosphere is reflected back to space by clouds, atmospheric particles, or bright ground surfaces like sea ice and snow.
According to most information available, clouds typically block around 20% of sunlight, meaning that even on a cloudy day, a significant portion of the sun’s rays can still reach the Earth’s surface; therefore, it is generally considered accurate to say that around 20% of sunlight is blocked by clouds.
“About 20%” is not ‘sciencey’ enough.
You need to say “20.43% +/- 0.13%”
I stated the 29% for ice as it is the dominant reflector of solar EMR. All other reflectors are bit players.
The average radiating temperature of Earth is 255K – well below freezing. That means, on average, there is at least 1mm of ice as the long wave emitter to space. That same ice is highly reflective.
On a daily basis the reflected solar EMR ranges from 0 to 360W/m^2. That kills your notion that there are ever present particulates reflecting solar radiation.
The highest reflected solar always occurs with the lowest OLR with a radiating temperature well below 273K so the OLR is being emitted from ice and the solar EMR reflected from ice.
Atmospheric ice is ubiquitous but not always visible.
It’s not 29% blocked by clouds alone
The clouds are mainly water vapor
You were wrong twice but obviously do not care about accuracy.
According to most meteorological classifications, a relatively small percentage of clouds are considered “high altitude clouds,” typically ranging around 10-20% of the total cloud cover in a given area, as high clouds like cirrus are generally less prevalent than mid-level and low-level clouds.
The exact percentage varies depending on location and atmospheric conditions, with estimates suggesting that around 70% of clouds at high altitudes could be composed of ice while lower clouds are more likely to be water vapor based.
10% x 70% is 7%
20% x 79% is 14%
You seem to be claiming that 7% to 14% of clouds, the estimated ice clouds, block MORE sunlight than the 86% to 93% of clouds that are water vapor clouds.
If so, color me suspicious that you are wrong.
You are not a great observer. Have you ever looked over a field covered in snow? Have you ever looked over an ocean?
Water reflects very little sunlight unless it is at a high angle of incidence. Ice in the form of snow reflects almost all sunlight at any angle of incidence.
The clouds that limit the ocean temperature to 30C form over warm pools at an altitude between 7km and 20km. They are ice clouds. Sometimes not always visible from the surface.
The white portion of this image is ice cloud. The dark blue portion is water. The great portion are water/ice clouds:
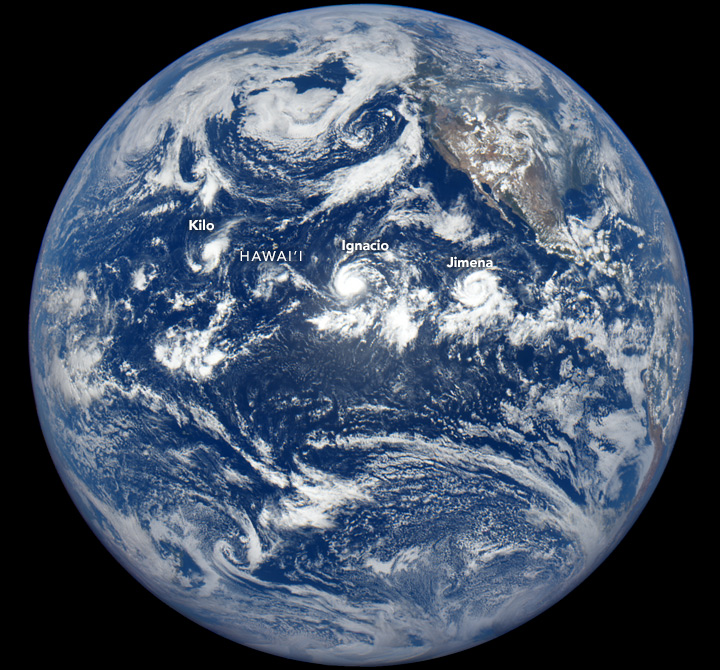
Mixed phase clouds are as much solar absorbers as solar reflectors. They appear over ocean and land at a surface temperature below 15C and reduce heat loss from the surface. The high ice clouds work the oposite way they reflect between 70 to 100% more solar EMR than their reduction in OLR so limit surface heat uptake.
Ice Particle Concentrations in Clouds in: Journal of the Atmospheric Sciences Volume 42 Issue 23 (1985)
Not valid in theory either. It is based on one incorrect assumption … static energy emission in the atmosphere by GHGs. They are not static. Once the correct increase in energy emissions is used, the radiating level is constant for well mixed GHGs.
Tropopause jumps up and down by a significant amount even on a daily basis.
https://youtu.be/XfRBr7PEawY?t=1984
Working with a static radiation height is not realistic.
“Not valid in theory either.”
On one hand, you may be right that eventually the radiative transfer theory used, for example, for MODTRAN, will turn out to have been seriously “off”. On the other hand, the computed static “warming” effect does not determine the end result on land and in the oceans in any case. This is the point I often post about with supporting evidence from GOES and from the computed ERA5 outputs.
If there are any radiative effects from CO2, they are tiny…
and as your videos show…
are part of a much, much larger picture, dominated by air movement, convection, etc.
Exactly. It comes down to the concept of dynamic self-regulation, which becomes obvious as the larger picture is considered honestly.
Pedestrian only. For those who identify as birds.
Make sure to add in the concrete barrier at the end to ensure the plane explodes when it over runs the runway.
The Difference between Average and Normal. The average number (sum of all values divided by the number of values), and median (the mid-point between value extremes), even when including some expression of variance (like two standard deviations), is not the same as Normal. If it rains 2 inches one year and 92 inches the next year the mean, median, and variance are irrelevant. Normal is 2 to 92 inches of rain. There, now I feel better.
‘Normal’ is one of those English words with too many meanings, Ron. It can mean ordinary, healthy, harmless, perpendicular, conforming to a norm or standard, and the list goes on.
When I see ambiguity like that, I prefer to go for a more precise word. In your example, and the sense you are asserting, it is not unprecedented to see between 2 and 92 inches of rain.
We need more data to opine on whether 2 or 92 or both are unusual. If (with more data points) the mean is found to not be 47, but those are the extreme values over a long period, then arguably they are not part of a normal distribution.
There, now I feel better, too! 😀
Bingo! I’ve said that for years and it’s great to hear others echoing these observations.
I equate “normal” to the statistical mode, the most frequent or most common
Willie Soon — time traveler:
https://rumble.com/v6bu5kj-dinosaurs-versus-doom-mongers-willie-soon-time-traveller.html?e9s=src_v1_upp
“Coal powered time machine” – great line! Now Trump supports coal-powered data centers! Gotta love this welcome change from the “existential threat” guy.
And the thought of the dinosaur eating that little Portuguese sausage, the Secretary-General makes me chuckle.
That’s great! Thanks for posting.
I laughed! Soon is also a comedian.
When he said “Crikey!” I lost it.
I had no idea Dr Soon was so funny!
Young again, might put in a piece about “ “Large blocks of ice…” ”floating down the Mississippi past New Orleans in 1899. Made it to the Gulf two days later when inch thick ice formed in the bays. (Berry, J. 1899. Climate and crop service. Monthly Weather Review. 27(2):53-55; Henry, A. J. 1899. The weather of the month. Monthly Weather Review. 27(2):50-53.)
Snow in New Orleans in 2025.
I wasn’t there, and don’t remember many details, but I did read about icebergs being visible off the east coast during the 20th century, all the way down to Florida, as they made their further south to melt.
Brilliant 🙂
Not sure how many readers understand the importance of the “greenhouse efficiency” computation provided earlier this week by Willis E.
https://wattsupwiththat.com/2025/01/22/greenhouse-efficiency-2/
This analysis of the full 25 years of NASA CERES mission data demonstrates a perfectly flat greenhouse effect over time. This matches what was found in Miskolczi 2010 and better described in his 2023 paper.
https://scienceofclimatechange.org/wp-content/uploads/Miskolczi-2023-Greenhouse-Gas-Theory.pdf
What we now have are two separate analyses, based on different data, demonstrating a constant greenhouse effect over the last 77 years. There is no longer any reason for skeptics to argue among themselves. All of the climate changes over the past 77 years were natural.
There is also no need to come up with negative feedback theories. None are needed. All that is needed is understanding why clouds have been decreasing. We now know the decrease has caused more solar energy to warm our planet.
Obviously clouds are reducing because of Climate Change. Don’t you read the media articles ?
Exactly DMac! The climate is changing because of Climate Change ™
Yes, I’ve heard that claim. The cloud change result requires new science. Right now, all the cloud change claims are based on warming first. But, as this data shows, all the warming came from the cloud changes. There was no “warming first”.
This also requires admitting they were wrong about CO2 causing more warming. Once they do that why would anyone believe anything they say?
Total BS
According to recent research, global cloud coverage percentage has been declining in recent decades, particularly low-altitude clouds over certain ocean regions, which could be contributing to rising global temperatures by allowing more sunlight to reach the Earth’s surface; studies have shown a noticeable drop in cloud cover over the past few decades, with some research indicating a decline of around 1.5% per decade.
I have seen other estimates of a 7% decline over the past two decades.
Both percentages are statistically insignificant as measurements of cloudiness percentage have a margin of error of AT LEAST +/-10%
GLOBAL cloudiness data start in about 1995 with meaningless tiny changes until two decades ago, if you cherry pick ONLY the -7% worst case cloudiness reduction claim for the past two decades.
The current global warming trend began in 1975, almost 50 years ago. NOT two decades ago
… just at the time of large scale urbanisation.
These thumbnails, which are frequently posted, are of such low resolution that nothing on them can be read. They are useless.
No urbanization of the oceans, 71% of the surface
Urban areas are 3% of land surfaces
3% x 29% = 0.9% of earth’s surface
0.9% of Earth’s surface controls the average temperature of the other 99.1%
Hard to believe.
” just at the time of large scale urbanisation.”
Which USCRN shows to be accounted for ….
“Contiguous U.S. annual average temperature anomalies and trends from the USCRN and ClimDiv relative to a 2005-2022 USCRN period of record. Data available from NOAA’s National Temperature Index.
We can see this clearly if we compare trends over the 2005-2022 period. “
1975 was also the very bottom of the AMO.
“1975 was also the very bottom of the AMO.”
Yes it was (well a bit past the “very bottom)
I fact the majority of the 60’s and 70’s saw both the AMO and the PDO in -ve (cold) phase …
Which is why (along with high aerosol content) there was the dip in warming as CO2 forcing had not ramped up sufficent to negate those -ve forcings.
Clueless as always.
My own quest for reasons explaining cloud changes have found several potential causes.
1) The AMO cycle change of 1995-97 saw a significant decrease in clouds measured by the ISCCP project. With the next AMO phase change expected fairly soon (60+ year cycle), we should get a better view.
2) Another large change occurred from 2014-16. This correlates with a couple of events. A PDO phase change, the buildup to a major El Nino and the eruption of the Bardarbunga volcano. What was unique about the eruption was the ejection of large quantities of chlorine into the stratosphere.
3) In 2022 we had the Hunga-Tonga eruption which also injected lots of chlorine into the stratosphere. This is what got me interested in the earlier eruption. Again we had a large decrease in clouds.
There was also a large climate change in 1976 but we don’t have any cloud data. Turns out an Axial seamount undersea eruption occurred that year. This would also have injected some chlorine into the atmosphere. This one was much deeper and wouldn’t have been nearly as significant as previously mentioned eruptions. So, it’s doubtful.
The PDO also moved into its positive phase in 1976 which is more likely related.
Most warming is at night. Cloudiness percentage is a proxy, not a direct measurement of how much solar energy clouds actually block. Less cloudiness should make days warmer and nights cooler, but nights are getting warmer faster than days. (by nights, I mean TMIN that is often 30 minutes after dawn)
WE not only ignored all evidence of greenhouse warming, he also ignored almost all data from 362 climate and weather satellites. He cherry picked CERES data from a few satellites and came to different conclusions than NASA and Dr. Loeb, who own the CERES satellites, instruments and data. Is there a conspiracy going on?
The WE article was just an extreme opinion, not the gospel. WE contradicted at least 99.9% of scientists since 1896 with his CO2 Does Nothing explanation. But the Peanut Gallery at WUWT loves CO2 Does Nothing. So WE is their hero.
If WE is right
then everyone else is wrong?
Happer is wrong?
Lindzen is wrong?
Spencer is wrong?
Christy is wrong?
Curry is wrong?
No need for more climate articles at WUWT … If WE really has it all figured out
Perhaps WUWT should add
CO2 DOES NOTHING
to their home page.
That will really impress people
“But the Peanut Gallery at WUWT….”
…..
Ok, I’ll bite.
Stop Richard Stop.
I will retire the phrase Peanut Gallery as there is now a truce between BeNasty and myself. Hopefully it will last longer than peace in the Mid-east.
Interesting history of the phrase Peanut Gallery:
Peanut gallery – Wikipedia
I’m still not convinced this “RG” account is a genuine single account holder, from it displaying utterly contradictory positions. Guy claims to be an AGW skeptic, but cites pure defamation material copied ‘n pasted straight out of Greenpeace against Willie Soon. Guy claims to be a Trump voter, but uses pure leftist wording elsewhere (under his bimbo avatar commenter account) against Trump. Guy claims to be a blog editor at a site which looks like nothing more than a computer program-generated conveyor belt of other website page links. Folks would take only one look at his eyesore-arranged site and never return again, yet he claims he’s now approaching a million page views – a jump of a quarter million people in just 9 months in 2024 – resulting from nothing more than his own self-promotion in comment sections. That doesn’t pass the smell test.
I’d recommend stopping the “RG” account because of it having every appearance of being some kind of troll account with bad intentions here, operated by more than one person.
I’m still not convinced this “RG” account is a genuine single account holder, from it displaying utterly contradictory positions.
I’ve been thinking the same thing for a while. Recent comments appear to be confirming that opinion.
WOW! This explains ALOT. Either you’re correct or I just assumed that RG is simply a ‘crotchety old fool’ who is taking a contrary position on everything just to be contrary.
Personally it doesn’t bother me overly much if someone takes a contrary position that they than try to support even against a flood of evidence against that position, at least you can engage in a debate on ‘knowable positions’. But holding no position, or claiming a position and than at every turn undermining that position in a ‘random’ way isn’t someone you can have an agreeable intellectual debate with and thus should simply be ignored.
Unfortunately RG seems to pop up far too much and people engage him far too much. I’m a bit of a ‘free speech absolutist’, so I wouldn’t suggest banning (stopping) him, though censoring for rude/distasteful content can be justified. But the concept of ‘the answer to incorrect speech is more speech’ does NOT mean we have to engage with RG directly. Its hard maybe but I would suggest we just ignore him (e.g. don’t engage directly, post new comments with useful content independent of anything RG posts).
In short, don’t feed the trolls.
By this time last year, I’d already noticed the commenter’s name before in WUWT comment sections – the “Greene” name stood out a little as being sorta ironic for someone the pro global warming people would despise – but the real attention grabber for me was his tirade in the Jan 2024 WUWT post about Tucker Carlson interviewing Willie Soon — “RG”‘s quote was literally word-for-word copied out of Greenpeace. No AGW skeptic would seriously quote Greenpeace as a source for information on character assassination angles. It was not logical. So, I took a little time to find out when “RG” arrived here at WUWT, which led to my comment post here on the braggadocio claims RG made about the page view counts at his ‘blog.’ What I also ran across in that search effort was his Disqus bimbo avatar commenter account, where in just a year flat, he’d belted out several thousand comments. Now, as of today, “RG” is up to just under 7500 in only two years of existence, which averages out to 10 comments per day, every single day, in addition to whatever comments he put out elsewhere under different commenting systems. The whole persona of “RG” just doesn’t look right.
Good catch.
At least!
Willis derived his result from actual measurements.
I’m pretty sure the people RG mentions only derive from assumptive radiative-only theory.
What was that Feynman quote again ???
All Willis did was use CERES data and plot the result. The NASA scientists are the ones calculating solar radiation and outgoing radiation. Is there some reason you believe NASA did it wrong?
There is no evidence of recent greenhouse warming. That is a product of your imagination. There is lots of evidence of warming and there are reasonable explanations for it.
There’s also the physics I have explained a few times which supports the no warming position.
Willis was also a lukewarmer based on most of his related articles. His position appeared to be emergent feedback/s would limit the warming. He would also have been on your list.
Turns out everyone was wrong if they believed CO2 was causing recent warming. I suspect many of them would be pleased to find out they were wrong. Why aren’t you?
Not only that, but someone (I don’t have the link to it now) posted a link to a TWTW (The Week That Was) article from May/2024 which included what appear to be quotes from the CERES team themselves indicating that after ‘correcting’ their data they conclude that the changes in outgoing radiation can be entirely attributed to “Large ASR trend primarily driven by reductions in low and middle clouds.”…e.g ‘changes in Absorbed Solar Radiation’ which is EXACTLY what Willis’ article & calculation concluded from the same data…
Are you sure it is because of alien machines acting to create confusion and death?
Hi Richard.
Not to diminish Willis’ contribution to the discussion on WUWT but it is not perhaps surprising that the paper you linked to provides the same conclusion. I haven’t absorbed the paper in total (though I plan to soon as it looks very interesting), but the paper references an equation that they call the ‘normalized green house factor’, which, assuming I’m translating definitions properly, is just “1 – (Willis’ Green House efficiency)” (sorry I don’t know how to include mathematical equations in comments).
To that extent the paper linked to comes to the same conclusion because they are effectively calculating the same value. The paper linked to seems to go FAR further in its conclusions than Willis chose to and to that extent I want to take more time to absorb it (I can follow the calculations and argument, just need time to focus) but it does appear quite interesting.
One thought that has been rolling around in my head, and keeps coming back to the forefront like a bad penny; is just what kind of person would blatantly alter or hide their ”scientific” research data!?
We know from the Climategate e-mails that CRU and others were openly discussing altering data to make the historical record appear cooler, with less variability; and from Steve McIntyre we learned that Mickey’s Hockey Trick was the product, regardless of the data entered! Does that make them stupid or evil!? I believe the correct answer is: BOTH!
Some are clearly stupid, and wouldn’t recognize the Scientific Method if it walked up and slapped them like a jilted lover; while others are obviously sociopathic, selling their integrity for the perks of membership in the Climate Cabal. They have sold their souls for the requisite thirty pieces, and yet continue to profit from GangGreen, and prop each other up as figures of authority!
Might not an investigation into conspiracy to commit fraud be useful? I can just imagine how testimony in front of Congress might cause some leading alarmists to change their tune! And if they avoid criminal charges, there is still the prospect of a class action lawsuit! That’s the nice thing about conspiracies; there is no statute of limitations!
Charlatans!
Same thing for data that showed low saturated fat diets were associated with bad outcome.
The European Union is about to impose a ‘Double Down on Davos (DDoD)’ economic policy which seeks to accelerate the EU’s transition to wind & solar energy while further integrating and centrally controlling all the economies of the member states:
Leaked paper shows EU plans for ‘green’ boost to make bloc ‘competitive’
(Peter Caddle, Brussels Signal, 24 January 2025)
“Brussels is planning to ramp up the European Union’s green crusade, a move meant to make the bloc more competitive, a leaked document seen by Brussels Signal has disclosed. …. The leaked plan also called for member states to hand more power to Brussels, allegedly for the sake of ramping up the bloc’s energy security and defensive capabilities.”
The EU is hell-bent on societal suicide, but it’s getting harder to imagine that a majority of citizens in the EUSSR are going to be willing to continue marching passively to their own slaughter when they see that not only China and India, but also the US refuse to drink the Kool-Aid.
If the Deep State fails to assassinate Trump, that is.
One could make a very good argument that it is the EU’s green crusade over the years that has made the bloc less competitive!
‘Isn’t the only hope for this planet that the industrialized civilization collapse? Isn’t it our responsibility to bring that about?’ – Maurice Strong, UN
It would also seem from recent news that many democrats also believe it is their duty to see to it that Trump fails in his attempts at reform political. My words for that attitude and behavior is “conspiratorial sedition” whereby they don’t care about the results of an election and will do whatever is necessary to preserve the status quo.
The biggest problem for them is that they didn’t foresee his third election, and never thought for a minute about the consequences of giving him 4 years to plan for it.
What is it that Doomberg says? The road from energy abundance to energy poverty passes through riots and insurrections, or something to that effect! We’ll be watching Europe closely to see if and how they navigate their way out of the mess that their ruling classes have led them to!
I hear the Billionaire Boys Club of Davos is setting new, all time records for the number of escorts (prostitutes) hired this year. You’d think that after how hard they have f#(&ed England and Europe over the last few years, they might be ready for a cigarette break and some room service instead!
Thak you for the link
I read the article this morning but had to use the immersive reader on my computer to avoid giving out my eMail address.
I wanted this to be the first article recommended on my blog later today and you gave me a good link that works without signing in
Honest Climate Science and Energy
double down on anti CO2 policies and increased central planing.
i.e. attempt to ensure national suicides before awareness of how un-competitive they are becoming forces Brussels and its lackeys out of power.
Despite the hype. there is no real evidence that CO2 has any effect on our global climate system. There is plenty of ratinale to support the conclusion that the climate sensivity of CO2 is effectively zero. The AGW hypothesis has been falsified by science. For the truth abo9ut climate change one should read “The Rational Climate e-Book” by Patrice Poyet which one can download for free from the Internet.
There is plenty of rationale to support the conclusion that the climate sensitivity of CO2 is effectively zero.
Agree completely !! 🙂
There are multiple ways to disprove the GHE hypothesis, which is nothing but a mathematical artifact of a model that does not represent the Earth atmospheric system. Sadly, it seems that policy now disallows the publication of any articles that do not sufficiently conform to the GHE narrative.
In Poyet’s e-book there are numberous falsifications of the AGW hypothesis. For example facts concerning the dry and lapse rates falsifies the hypothesis. For example the fact that adding CO2 to the atmosphere does not increase the dry lapse rate in the troposphere is evidence that adding CO2 to the atmosphere does not increase the thermal isulating properties in the troposphere and hence does not cause any related sueface warming. Infact adding CO2 to the atmphere slightly reduces the dry lapse rate which causes surface cooling. Any CO2 bassed warming in theory increases the amount of H2O added to the atmosphere. Because the wet lapse rate is significantly less than the dry lapse rate in the troposphere, the adding of more H2O to the atmosphere causes surface cooling and not more warming. Hence H2O should act as a negative and not a positive feedback to any CO2 bases warming. This takes place because of evaporative cooling. In general the AGW hypothesis is based on only partial science and is so full of flaws that the AGW hypothesis cannot be true.
I don’t have any major issues with Poyet’s work. I’ve not read it in detail but I have scanned through it and read some sections. He is on the right track but some of the arguments could be more succinct. The length of his treatment gets in the way to some extent. The climate/weather system is driven by water, solar irradiance, gravity, and the rotation of the Earth. The entire CO2 narrative is a “tragedy of errors.” I continue to work on this, but the sad reality is that there is great resistance even within the so-called “skeptic” community, and so it is very difficult to have a rational discussion about alternative perspectives in an open forum. Right now, I think Tom Nelson’s channel on YouTube is the only forum where contrary hypotheses can be aired.
Poyet’s e-book is very profusely documented and referenced. In many parts of the book he points out where the AGW hypothesis has been falsified by science.You need to read it in enouth detail to find those passages. The falsifications of the AGW hypothesis are very clear and undeniable. You need to adequately study this. Poyet says that to really understand his book one needs to have at least a master’s degree in an applicable subject.
Again, I have no issue with Poyet’s work. It is the length and breadth of the work that gets in the way. The root of the problem is the GHE which only exists in models and relatively easily falsified. While Poyet presents a lot of data and discusses many phenomenological inconsistencies, in order to falsify the GHE one needs to both show what is wrong with the model and why it is not valid and provides an alternative that better fits observations.
You seem to be fishing at the end for my curriculum vitae. I have an advanced degree in mathematical physics and extensive tech/industrial experience with the transport of heat energy under a very broad variety of conditions.
if you would like to check out some of my work, you can go to https://www.allaboutenergy.net/component/finder/search?q=tom++shula&Itemid=101
Has anyone found a definitive answer to
‘what is the land mass that seems to be centered in the photo from Blue Ghost that was released today’?
Perhaps it is North America, upside down from the orientation generally used on maps, but if it is, there does not seem to be any Arctic Sea Ice.
https://www.realclearscience.com/2025/01/25/a_private_us_spacecraft_captured_a_glorious_view_of_earth_1087090.html
I think it might be over South America… Certainly not easy to tell, though.!
More of the magic of fossil fuels when you think about it-
‘Magic’: Ferry passengers spot rare Antarctic whale in Sydney
It was reported last night on Fox News that President Trump may decide to make his first overseas trip as president to the UK!
I hope he does! Maybe Trump can expose Labour’s suicide Net Zero plan to the voters a little better than they have had it explained to them before. 🙂
Trump would definitely get the conversation started. He would start out by telling the citizens just how bad windmills and solar are for the UK and their economy.
Nuclear plants too expensive?
In France, the turnkey cost of the 1,600 MW Flamanville plant was $13.7 billion, or $8,563/installed MW
Plants built by Russia, China and South Korea are about $5,000/installed MW
Expensive nuclear plant building is strictly a “rules-based” Western thing.
.
Nuclear Plants by Russia
According to the IAEA, during the first half of 2023, a total of 407 nuclear reactors are in operation at power plants across the world, with a total capacity at about 370,000 MW
Nuclear was 2546 TWh, or 9.2%, of world electricity production in 2022
https://www.windtaskforce.org/profiles/blogs/batteries-in-new-england
Rosatom, a Russian Company, is building more nuclear reactors than any other country in the world, according to data from the Power Reactor Information System of the International Atomic Energy Agency, IAEA.
The data show, a total of 58 large-scale nuclear power reactors are currently under construction worldwide, of which 23 are being built by Russia.
.
In Egypt, 4 reactors, each 1,200 MW = 4,800 MW for $30 billion, or about $6,250/kW,
The cost of the nuclear power plant is $28.75 billion.
As per a bilateral agreement, signed in 2015, approximately 85% of it is financed by Russia, and to be paid for by Egypt under a 22-year loan with an interest rate of 3%.
That cost is at least 40% less than US/UK/EU
.
In Turkey, 4 reactors, each 1,200 MW = 4,800 MW for $20 billion, or about $4,200/kW, entirely financed by Russia. The plant will be owned and operated by Rosatom
.
In India, 6 VVER-1000 reactors, each 1,000 MW = 6,000 MW at the Kudankulam Nuclear Power Plant.
Capital cost about $15 billion. Units 1, 2, 3 and 4 are in operation, units 5 and 6 are being constructed
.
In Iran, Rosatom started site preparation for a nuclear power plant, 2 VVER-1000 units, each 1050 Mwe, in September 2016. Construction started in March 2017. Units 2 and 3 are planned to be completed in 2024 and 2026. Unit 1 at the Bushehr site went on line in 2012.
.
In Bangladesh: 2 VVER-1200 reactors = 2400 MW at the Rooppur Power Station
Capital cost $12.65 billion is 90% funded by a loan from the Russian government. The two units generating 2400 MW are planned to be operational in 2024 and 2025. Rosatom will operate the units for the first year before handing over to Bangladeshi operators. Russia will supply the nuclear fuel and take back and reprocess spent nuclear fuel.
https://en.wikipedia.org/wiki/Rooppur_Nuclear_Power_Plant
.
Russia is the only country with nuclear powered ice breakers.
The biggest ones steadily go through 7 METERS of ice.
.
Rosatom, created in 2007 by combining several Russian companies, usually provides full service during the entire project life, such as training, new fuel bundles, refueling, waste processing and waste storage in Russia, etc., because the various countries likely do not have the required systems and infrastructures
.
Remember, these nuclear plants reliably produce steady electricity, at reasonable cost/kWh, and have near-zero CO2 emissions
They have about 0.90 capacity factors, and last 60 to 80 years
Nuclear does not need counteracting plants. They can be designed as load-following, as some are in France
.
Wind: Offshore wind systems produce variable, unreliable power, at very high cost/kWh, and are far from CO2-free, on a mine-to-hazardous landfill basis.
They have lifetime capacity factors, on average, of about 0.40; about 0.45 in very windy places
They last about 20 to 25 years in a salt water environment
They require: 1) a fleet of quick-reacting power plants to counteract the up/down wind outputs, on a less-than-minute-by-minute basis, 24/7/365, 2) major expansion/reinforcement of electric grids to connect the wind systems to load centers, 3) a lot of land and sea area, 4) curtailment payments, i.e., pay owners for what they could have produced
.
Major Competitors: Rosatom’s direct competitors, according to PRIS data, are three Chinese companies: CNNC, CSPI and CGN.
They are building 22 reactors, but it should be noted, they are being built primarily inside China, and the Chinese partners are building five of them together with Rosatom.
American and European companies are lagging behind Rosatom, by a wide margin,” Alexander Uvarov, a director at the Atom-info Center and editor-in-chief at the atominfo.ru website, told TASS.