The assertion that carbon dioxide is a “pollutant” has been the centerpiece of public policy on climate for the developed world in recent years.
Demonizing CO2 has impacted virtually every aspect of modern Western civilization. It condemns the burning of fossil fuels for electricity, the use of combustion engines for transportation, and the employment of carbon fuels for virtually everything supporting modern civilization – even down to the kind of washing machines and kitchen stoves that are deemed acceptable. It forms the basis for the most grotesque of all the alarmist shibboleths – the “social cost of carbon”.
The theory that CO2 is malevolent was enshrined in the so-called “Endangerment Finding” issued by the Environmental Protection Agency in 2009, which held that carbon dioxide is a “pollutant” that “threatens public health and safety”.
CO2 radicalism rests on one main assumption – that increases in atmospheric CO2 will cause a linear and dangerous increase in global temperature. The belief that more CO2 emitted equals significantly more heat and higher temperature is a cornerstone of the ruling scientific paradigm.
But what if this assumption – the most ubiquitous of all modern conventional wisdoms – turns out to be mistaken?
This conventional wisdom has been questioned over the last decade by impeccably credentialed scientists who have undertaken actual science – not political science – to contradict this primary assumption underlying the AGW belief system.
Case in point is the peer-reviewed analysis completed in June, 2020 by eminent physicists William Happer and William van Wijngaarden. Mr. Happer is Professor Emeritus at Princeton University and van Wijngaarden is a professor in the Department of Physics and Astronomy at York University in Toronto, Both men are accomplished and renowned physicists with over 500 published papers to their credit. Mr. Happer is best known as the brilliant scientist whose insight into the physics of the atmosphere empowered the success of the Strategic Defense Initiative.
They applied highly detailed mathematical analytics to the physics of CO2 in the atmosphere and raised serious doubts about CO2’s ability to absorb heat after becoming “saturated” at current levels of 400 parts per million, and therefore unable to absorb significanty more heat from the Sun. Thus, any further increases in atmospheric CO2 – even doubling that amount to 800 parts per million – would only result in minimal increases in atmospheric temperature of 0.5C, or 1degree Fahrenheit.
This mathematically rigorous finding was validated through a controlled laboratory experiment conducted by a team of seven Viennese researchers in 2024. They measured the back infrared radiation of CO2 in a test chamber with increasing CO2 concentrations emulating realistic atmospheric conditions. They concluded that doubling CO2 from pre-industrial levels from 400 to 800 ppm “shows no measurable increase in infrared radiation absorption, and thus can lead to just 0.5C warming increase at most”.
This conclusion illustrates the reason why climate alarmists have never been able to explain the reason why the Earth has never experienced runaway warming in the past when CO2 levels were 5-10 times more concentrated than today, nor why the UN climate models based on linear warming theory have been proven to be so terribly wrong.
If the CO2 concentration in the Earth’s atmosphere is well beyond the level where increases are causing additional radiation to be absorbed, then all the government policies intended to reduce or eliminate CO2 emissions in order to stop climate change are just as effective as King Canute’s efforts to control the tides.
In short, these saturation analyses thoroughly refute the conventional wisdom that increasing levels of CO2 will cause catastrophic global warming.
And they are not alone.
For example, in 2020 German chemist Michael Schnell published his study “Experimental Verification of the CO2 Greenhouse Effect” which also confirmed that the saturation effect of CO2 results in minimal warming. In addition, Franz-Karl Reinhardt, a professor with the leading Swiss research facility EPF, undertook another study in 2017 which demonstrated that a doubling of the current level of atmospheric CO2 from 400ppm to 800ppm would produce only be one quarter of 1 degree Celsius – too small to even be accurately measured.
The impact of all these recent studies – and there are many more than just the ones mentioned above – is clear: the conventional wisdom regarding CO2 warming is unraveling. The demonization of CO2 – one of the greatest popular delusions in modern human history – may finally be coming to an end.
It may well not be not true that an increase in CO2 causes a linear and catastrophic increase in atmospheric temperature.
The implication of CO2 saturation is a game changer, and should provide the Trump Administration with a substantial line of questioning of EPA’s Endangerment Finding.
“The implication of CO2 saturation is a game changer,”
This is just silly. Saturation was aised by Angstrom in about 1900, in opposition to Arrhenius. His case got a good airing, and had a following for a while, but clearly failed when there were more accurate readings.
The paper of Happer and van Wijngaarden actually verified this. They too found saturation, but theythen calculated the expected ECS – equilibrium sensitivity – and got a value of 2.2°C/doubling. Pretty well exactly what Manabe had got over 40 years before, with essentially the same methods. Here is the key table of results:
That isn’t going to change any games. It is well within the IPCC range.
Oh modelled output? According to AR6 it is actually at the bottom of the range’
https://www.ipcc.ch/report/ar6/wg1/chapter/chapter-7/
“Saturation was aised (sic) by Angstrom in about 1900, in opposition to Arrhenius.”
And Arrhenius had been debunked by 1922:
THE EVOLUTION OF CLIMATE
BY
C. E. P. BROOKS,
M.Sc., F.R.A.I., F.R.Met.Soc.
WITH A PREFACE BY
G. C. SIMPSON, D.Sc., F.R.S.,
DIRECTOR OF THE METEOROLOGICAL OFFICE
LONDON: BENN BROTHERS, LIMITED
8 BOUVERIE STREET, E.C.4
1922
“The theory which connects fluctuations of climate on a geological scale with changes in the composition of the earth’s atmosphere is due to Tyndall and Arrhenius, and was elaborated by Chamberlin. The theory supposed that the earth’s temperature is maintained by the “blanketing” effect of the carbon dioxide in the atmosphere. This acts like the glass of a greenhouse, allowing the sun’s rays to enter unhindered, but absorbing the heat radiated from the earth’s surface and returning some of it to the earth instead of letting it pass through to be lost in space. Consequently, any diminution in the amount of carbon dioxide present would cause the earth to radiate away its heat more freely, so reducing its temperature. But it is now known that the terrestrial radiation which this gas is capable of absorbing is taken up equally readily by water-vapour, of which there is always sufficient present, and variations of carbon dioxide cannot have any appreciable effect.“
https://www.gutenberg.org/cache/epub/72714/pg72714-images.html
This is a different variation of the CO2 self saturation effect, which did linger on in some quarters until the 1950’s. But then more accurate data on radiative properties of gases became available, and the Arrhenius view prevailed.
Stokes is clearly a dinosaur and clearly thins that CO2 has a limitless capacity to absorb LWIR which is nonsense
He ignores the log effect over time because he is a warmist/alarmist stooge who conveniently seem to have forgotten the absurd 4-8 degrees C projection by the pseudoscientists at the IPCC sanitarium, 30 years ago.
Nick, there are many interesting and complicated theories expressed in this thread, but the bottom line is that CO2 concentrations lag temperature.
We have instrumented temperature and CO2 records over the period of greatest warming where the warming is attributed to anthropogenic emissions. Those emissions have not been constant. So, given that we’re talking about photons and atmospheric molecules, the effects of varying anthropogenic CO2 emissions on SAT and SST temperature should have very little delay and be easily detected.
To understand that delay I computed the frequency response between various temperature and CO2 datasets. The answers were consistent. CO2 concentrations lag temperature by six months, even when analyzed over 10-year periods. The seasonal variations (large spike at a frequency of 1 yr^-1) have a shorter delay.
In my analysis I used coherent averaging to reduce the effects of uncorrelated signals. This has the unfortunate effect of reducing frequency resolution, so I’ve shown the result with three different amounts of averaging.
In this result, given the way I computed the frequency response, the negative phase slope indicates CO2 concentrations lagging temperature. If varying CO2 concentrations forced temperature, the phase slope would have been positive. The amplitude response shows that over 10-year periods the sensitivity is 4.9ppm/°C
I did the analysis using a different approach to see if something was occurring over periods longer than 10 years, which was about the limit of the frequency domain approach. The only thing that I concluded from that analysis is that the long-term trends are better represented by a second-order rather than a logarithmic function.
Nice analysis. Why can’t climate science do this?
Thanks, Tim. Wrong answer, I guess. Beyond wavelet transforms, it seems there’s also less understanding of frequency-domain based stochastic analysis techniques.
Because it is not real science?
“the bottom line is that CO2 concentrations lag temperature.”
CO2 emissions cause some amount of global warming. The warming is modest and has been beneficial for about 50 years. Only stupid science deniers say what you did in the quote above. Great way to be ignored and never be able to persuade other people that CO2 emissions are not a crisis and actually benefit our planet.
“Only stupid science deniers say what you did in the quote above. “
Seriously !!!
[yes, Richard was out of line. I noted.~ctm]
[doesn’t justify a return to harrassment.~ctm]
Richard. I’m forcing others to behave. You need to as well.
Robert,
You are looking in the wrong place for the wrong thing. The wrong thing is a time proportionality between ppm and T. GHGs produce an effective heat flux, so you might expect ppm to be proportional to dT/dt, not T.
But it’s the wrong frequency regime. The heat flux mainly heats the oceans, which is a slow process. The high frequency stuff comes from weather etc. There is a weak link there, in that transient warmth increases the otherwise seasonal outgassing of CO2. That is a much smaller effect overall than our burning, but can show up at high frequency.
“GHGs produce an effective heat flux”
Nonsense…. CO2 DOES NOT alter the net radiative transfer, there is absolutely no evidence of that.
Also, that frequency radiation would never be able to heat the ocean, it is only capable of penetrating some micro-metres.
The rest of what you said is also non-science.
1/2.
bnice, you should try to bscientific. You wrote three sentences, and all three of them are incorrect.
This black and white graph is measured data. (I added the colorful annotations.) If “CO2 does not alter the net radiative transfer” (as you wrote) then how do you explain the big notch (which I’ve annotated in green)?
2/2. bnice, you also wrote, “that frequency radiation would never be able to heat the ocean, it is only capable of penetrating some micro-metres.”
That is also wrong.
The claim that 15 µm downwelling radiation cannot heat the ocean, because it is absorbed by the water at the very surface, is false. The ocean is almost never still, and the constantly churning water means that, w/r/t the effect on average water temperature, it does not matter at what depth radiation is absorbed:
Moving water is a marvelous transporter of heat, which is why we use it to cool internal combustion engines. To inform your intuition w/r/t how fast heat can travel in the ocean, notice how fast squid ink spreads:
Sunlight absorbed at an average depth 10 cm or more has neither more nor less warming effect than 15 µm LW IR of the same intensity absorbed at an average depth of less than 0.1 mm. The warming effect of radiation absorbed by the oceans depends only on its intensity, not on its wavelength(s).
Some folks speculate that if a downwelling 15 µm LW IR photon is absorbed by one of the molecules in the very topmost “skin layer” of water molecules, which are in contact with air, then, instead of warming, the water molecule might just immediately evaporate. But that is wrong.
One 15 µm photon has only 82.6565 meV of energy. If you plug in the numbers you can calculate that to evaporate a single molecule of liquid water at 25°C would require the amount of energy provided by absorption of nearly 5.8 billion 15 µm LW IR photons.
In fact, to raise the temperature of water by 1°C requires the absorption of about 9.4 million 15 µm photons per molecule of water. So “skin layer” water can obviously absorb “downwelling” LW IR radiation without evaporating.
I do not think so. The deeper the energy penetrates into the ocean, the longer the energy residence time. If the energy is absorbed at the surface, where the water is already warmest, it is likely to e expended in accelerated evaporation at the surface. Thus lwir has a shorter residence time in the ocean.
Nick, I apologize for the quality of these commenters, but I lean towards free speech.
Charles,
Thanks. I am very happy to read and respond to someone who has done serious analysis, as Robert Cutler did.
with out specificty this can be misconstrued.
Re: “CO2 concentrations lag temperature by six months”
Global CO2 concentration does not vary significantly over a mere six months, so it does not significantly affect temperatures over a mere six months.
Mauna Loa CO2 is not global. Averaged over a longer period of time it approximates the global average CO2 level quite closely, but from month to month its fluctuations are dominated by local factors.
Since you’re comparing to a global temperature index, comparing it to a particular location‘s CO2 measurement record makes no sense. What do you think happens to that analysis if you use a different CO2 measurement location, like Cape Grim?
We know, qualitatively, what causes the seasonal signal in CO2 measurements: it’s plants. In the northern hemisphere, a great deal of vegetation grows in spring and summer, removing CO2 from the air, and then dies and rots in the fall and winter, releasing CO2 back into the air. In the southern hemisphere, the seasons are reversed so the seasonal signal is inverted, and there’s a lot less land and terrestrial vegetation, so the seasonal signal is smaller.
When examining two signals which both depend on the seasons, you cannot infer anything about their causal relationship from their phase relation. Trying to do so is venturing close to “wet roads cause rain showers” territory.
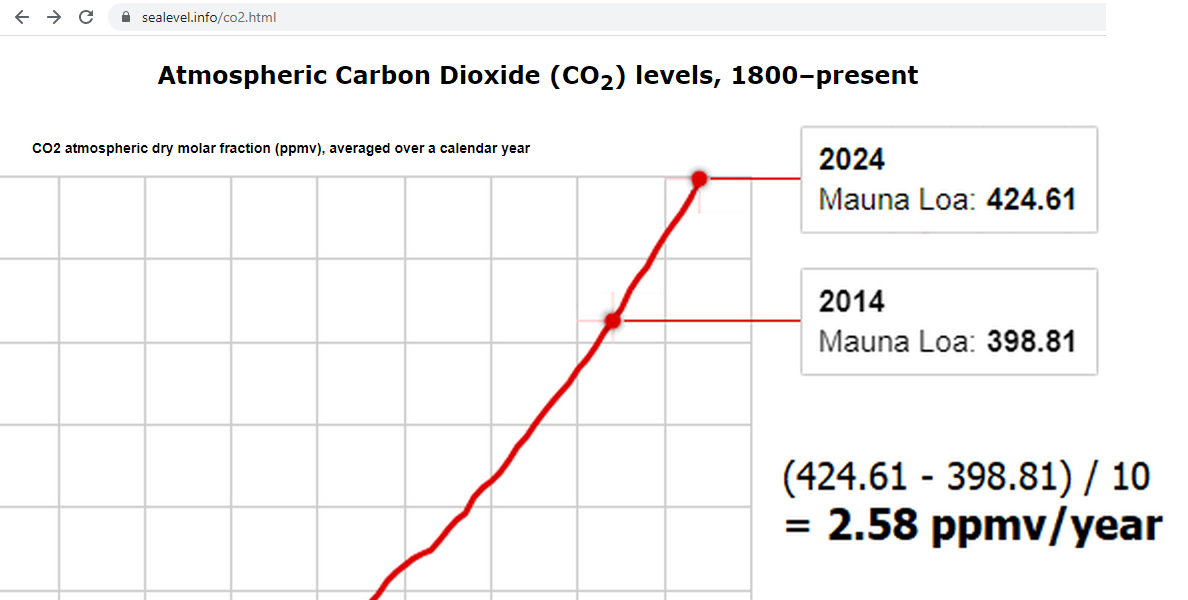
From year to year the globally averaged CO2 level doesn’t change much: only about 2.58 ppmv/year, or +0.6%.
https://sealevel.info/co2.html
+0.6% has the forcing effect of 0.863% of a doubling.
So if we’d get 2°C of warming from a doubling of CO2 (which, contrary to most CMIP models, is a generous ECS estimate!), we could expect only 0.863% of that, or 0.017°C, from one year’s CO2 increase. Over just six months you should expect half that (and, of course, the effect is not instantaneous).
0.009°C is obviously dwarfed by natural variations from things like ENSO. Such minuscule effects cannot be teased out from the “noise signal,” so you cannot deduce anything meaningful about the relationship between CO2 and temperature from temperature variations over such short periods.
However, you can deduce meaningful things about the relationship between temperature and CO2 level by looking at longer time periods, over which CO2 levels changed enough to have a detectable effect on temperatures.
Even then, it’s tricky, and you should try to avoid anomalous endpoints. So start and end your analysis period during ENSO-neutral years. If you do that sort of comparison between CO2 level and temperature, and try to take into account the roles of other factors like CH4, you’ll find that ECS climate sensitivity seems to be at most about 2°C per doubling of CO2, and probably less.
I did that exercise a few years ago; sorry, it’s getting a bit stale:
https://sealevel.info/sensitivity.html
Dave, as I said, I used multiple temperature and CO2 datasets. I even used the ENOS index, For example, comparisons were made between Antarctic CO2 data and Northern Hemisphere SAT data.
I’m not sure you understand my analysis. The advantage of the frequency domain analysis is that I can look at long-term trends, at least up to about 10 year periods given the length of the datasets. It’s also possible to separate processes that operate on different time scales. For example, besides the seasonal process, there is some other process at 0.75 yr^-1 that has a delay shorter than 6 months. Other than that for any period longer than 2 years (frequency < 0.5 yr^-1) the phase response follows the line corresponding to a six month delay.
What does change is the sensitivity. It increases with period (decreases with frequency). The behavior is similar to that of an integrator, which is consistent with the 2nd-order trend. Said another way, temperature changes appear to have a cumulative effect on CO2 concentrations.
The seasonal variations can be found at a frequency of 1 yr^-1. Unlike time-domain analysis where a moving average is often used to attenuate the 1-year cycle, in frequency-domain analysis it’s not necessary to remove the cycle The 1-year cycle can be analyzed at a frequency of 1 yr^-1 At that frequency, the delay is 0.11 year. The presence of the seasonal signal does not impact the analysis at lower frequencies (longer periods).
If CO2 played a role, then at the lowest frequencies one would expect, at a minimum, some level of phase distortion as the longer term variations in [CO2] became significant. There isn’t any. That’s why I used a second approach to see if something was missed. I could find no evidence of CO2 driving temperature over any interval.
I think you’re using the wrong tools for the job. Frequency domain analysis would be applicable if we were examining a periodic process, but we’re not. Over the time frame you’re considering (since 1958), the CO2 level increase has been monotonic, not periodic. The phase of a monotonically increasing signal is meaningless.
What’s more, ten years is not long term. Even major El Niños are typically further apart than that. The PDO is 20-30 years, and the AMO is even longer.
W/r/t the effect of “temperature changes… on CO2 concentrations,” we needn’t guess. We have a lot of good data.
First of all, w/r/t the oceans, we have measurements:
The effect of a 1°C seawater surface temperature increase is only about a 4% decrease in the rate of CO2 uptake. For comparison, the effect of a 52% CO2 level increase is a 52% increase in the rate of CO2 uptake, which obviously dwarfs the small effects of temperature change.
We also have ice core data which show that from MWP peak to the bottom of the LIA (when temperatures probably fell about 1°C), CO2 levels fell by only about 9 ppmv, and took 450 years to do it.
We also have longer ice core records from which we can see the effects of glaciation cycles on CO2 levels. From cold glacial maximums to warm interglacial optimums the typical CO2 level increase was only about 90 ppmv, and it took millennia to manage even that much change, in spite of global average temperature changes of at least 6°C.
All of those lines of evidence show that the amount of warming we’ve had since the late LIA could cause at most about a 13 ppmv of CO2 level increase — yet the CO2 level has actually risen by about 145 ppmv, thanks to anthropogenic emissions.
Fourier analysis is used all of the time for nonperiodic signals. In fact known random signals are often injected into active systems as a way to ensure that the injected signal is uncorrelated to any operational signals during analysis. The purpose of the window function is to force periodicity. You comment on the phase of a monotonically increasing signal is demonstrably false. If I add a sine wave to a ramp, and the ramp is steep enough then the composite signal will be monotonically increasing, but the sinusoid still has both magnitude and phase.
You are correct the long-term trend is incompatible with frequency-domain tools involving Fourier transforms, which is why I detrended both temperature and CO2 records. There’s no causality information that can be determined between two trend lines (linear, or otherwise). The direction of causality can only be detected in the variations on the trend. By detrending the data I reduce the magnitude of the spike at a frequency of 0 yr^-1, and in so doing, avoid window sidelobe issues that might distort the result at other low frequencies.
My goal was to understand, using measured data, what relationship there is between temperature and CO2 concentrations. All the data shows is that temperature drives CO2, and that over the periods shown that temperature follows a linear trend and CO2 concentrations follow a 2nd order polynomial.
Now we get to models, which I have so far avoided. You argue that the long term trends are the cumulative effects increasing CO2 concentrations, but there’s no way to prove that in the data. As far as I’m concerned, it’s a spurious correlation.
I argue that temperature changes drive CO2 concentrations. Here the data does supply some supporting evidence. In the amplitude response I noted that the sensitivity was increasing with period, or decreasing with frequency. In fact the decrease is consistent with integration. In the frequency domain, an integration attenuates in proportion to 1/frequency. Said another way, given the trend for periods shorter than 10 years we can estimate, starting with the sensitivity of 4.9ppm/°C at 10 years, a sensitivity 10 ppm/°C over 20 years and 40 ppm/°C over 80 years. Over this time period the temperature changed by 1°C, so from a starting concentration of 320 ppm we would expect to have a current concentration of 360 ppm due to temperature changes. The rest can come from anthropogenic sources if you like.
Robert wrote, “You comment on the phase of a monotonically increasing signal is demonstrably false. If I add a sine wave to a ramp, and the ramp is steep enough then the composite signal will be monotonically increasing, but the sinusoid still has both magnitude and phase.”
Conceded.
However, this is what the CO2 trend looks like, with the seasonal signal removed (simply by plotting annual averages):
https://sealevel.info/co2.html
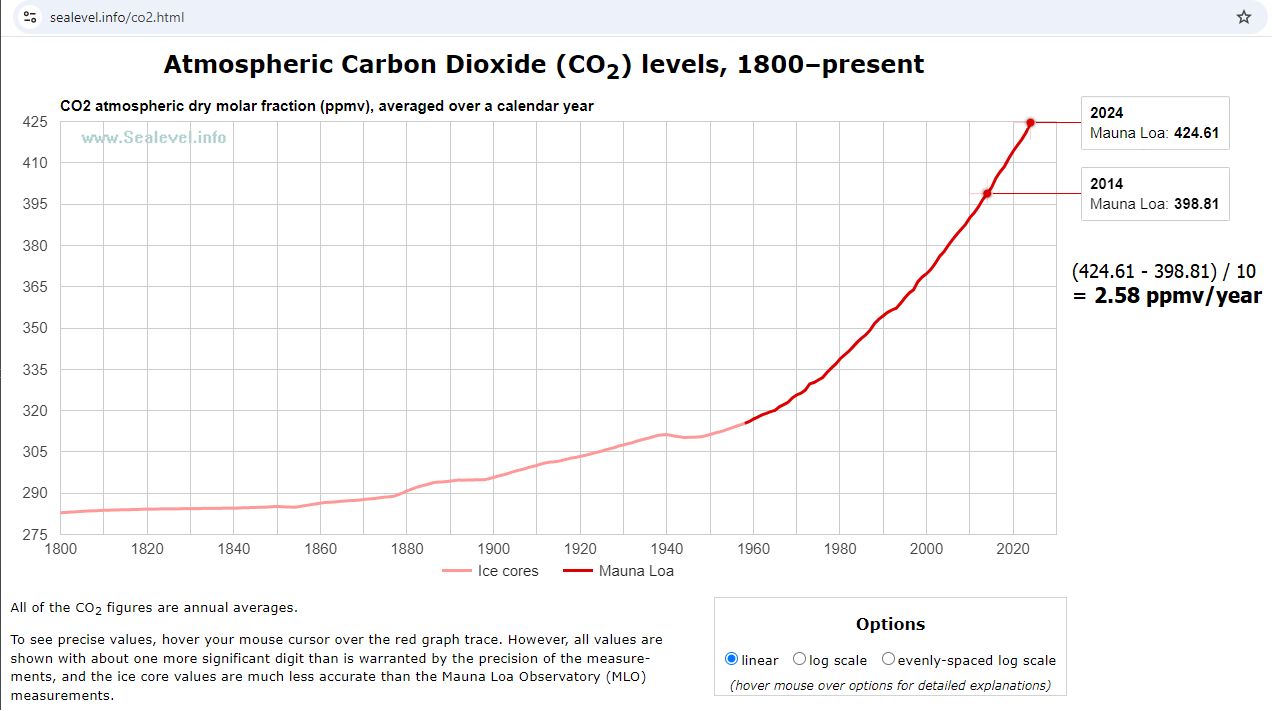
There’s no apparent periodic component. There’s an obvious, strong, approximately exponential, growth trend, because of the approximately exponential growth in anthropogenic emissions. But there’s not much else.
Even super El Niños are barely discernable (can you see the very tiny bumps in 1998 and 2015?). In fact, anything short of Pinatubo is at best barely discernable:
Temperature has a small influence on CO2 level, and CO2 level has a modest influence on temperature. Both of those causal relations are positive, which makes the relationship between CO2 and temperature a positive feedback loop.
That positive feedback contributes to the observed hysteresis between glaciated and deglaciated states over the last million years. The Earth tends to “latch up” in either a heavily glaciated state, or an interglacial state. An electrical engineer would recognize that as similar to a Schmitt Trigger circuit, like the 74LS14, and those are made by adding positive feedback to a circuit design.
https://byjus.com/jee/hysteresis/
Most natural feedbacks are negative (stabilizing / attenuating). But when you see a system with hysteresis, i.e., which tends to latch up in either of two states (e.g., either heavily glaciated, or interglacial), it means you’re probably looking at a system with positive feedback (and considerable non-linearity).
The fact that the rise in CO2 level is due to anthropogenic CO2 emissions is well and truly proven:
Engelbeen F, Hannon R, Burton D (2024). The Human Contribution to Atmospheric Carbon Dioxide. CO2 Coalition. doi:10.5281/zenodo.14231820
The analysis doesn’t require a periodic cycle. That said, there is periodicity in the data. Look at a frequency just above 0.25 yr^-1 in the upper, left spectrum plots of the detrended data. Second, the only significant volcanic influence can be seen in the upper, right plot starting in 1984. This is likely CO2 from the Mauna Loa volcano affecting the accuracy of the CO2 measurements.
I’ve provided my analysis of temperature driving CO2. Without using models or proxy data, convince me that CO2 influences temperature. Most of the significant anthropogenic emissions have occurred during the period where we have instrumented CO2 and global temperatures.
Glaciation over the last 800ky is primarily a function of three periodicities. The 41k periodicity likely omes from earth’s obliquity. There are nonlinearities involved, but I think we’ll eventually figure out that they’re related to processes inside the sun. This is a three-term harmonic model I developed.
I don’t believe this level of confidence is justified. That said, I’ve already allowed that the changes in CO2 concentrations due to temperature changes don’t account for all of the changes in levels. It doesn’t matter. CO2 is not the primary driver of temperature. If you want to know what is, I challenge you to figure out why my sunspot-based model works. I made the model public more than a year ago, but as far as I know, I’m the only one who has figured out why it works. I’ll make that public in the coming months. The basic 99-year moving average model is much more complicated than it appears.
I’m just curious. How is it that adding a couple of hundred PPM of CO2 to the atmosphere is so dangerous to survival, how did this old earth manage not to burn to a crisp when atmospheric CO2 levels were in the 4000 PPM range??, or even higher.
Because there was so much more water vapor to cool the atmosphere. A hot humid earth has a runaway refrigerator effect that leads to glacial periods. The cold dry CO2 atmosphere warms back up.
And here I thought that water vapor was an even stronger “green house” gas than CO2 is. More water vapor should have made it even hotter—witness the recent Tonga eruption.
I don’t think Nick has suggested that CO2 could cause the Earth to burn to a crisp.
Astrophysicists believe that the Sun is increasing in brightness at a rate of just under 0.01% per million years. It’s probably been at least 350 million years since the CO2 level was last near 4000 ppmv, which would mean the “solar constant” was probably about 3-4% lower than now. 3.5% lower would be about –12 W/m² at TOA, compared to now.
4000 ppmv would be 3¼ doublings compared to the current 425 ppmv. If one doubling = about 3 W/m², then 4000 ppmv would give us nearly 10 W/m², which would almost make up for the dimmer Sun.
Yes Dave.
Which puts into context the “but CO2 was at 400ppm x mil ya and it didn’t heat the atmosphere” etc.
Of course Arrhenius, Callender and many others, they all did it wrong. They all stupidly thought “back radiation” had anything to do with it. “Consensus science” refuses to call out the nonsense, because they want to claim a “settled science” being known for a long time.
This is true. In fact, back radiation leads to a cooling of the surface after saturation of the main CO2 spectral bands occurs.
The only warming effect comes from broadening of the CO2 spectral bands into the atmospheric window. This is what Happer/van Wijnggaarten show in their paper. Their error is to then keep relative humidity constant.
Reinhardt simply looks at the energy at the edges to come up with .24 C of warming. Even this minor warming does not persist as back radiation actually initiates a cooling process of about the magnitude.
Richard M wrote, “This is true. In fact, back radiation leads to a cooling of the surface after saturation of the main CO2 spectral bands occurs.”
That is incorrect. Downwelling “back radiation” can only have a warming effect. When it is absorbed by the surface, downwelling radiation makes the surface warmer than it otherwise would have been. The surface, in turn, helps keep the air above warmer than it would have been.
Richard M wrote, “The only warming effect comes from broadening of the CO2 spectral bands into the atmospheric window. This is what Happer/van Wijnggaarten show in their paper.”
That is not true. I don’t know which of their papers you’ve misunderstood, but I guarantee they’ve not said that.
Richard M wrote, “Their error is to then keep relative humidity constant.”
That’s not an error, it’s an approximation.
Richard M wrote, “…this minor warming does not persist as back radiation actually initiates a cooling process…”
All warming causes accelerated cooling. That doesn’t mean there’s no warming.
Radiative cooling, convective cooling, and often evaporative cooling, all accelerate when temperatures rise. Those are the most important negative feedbacks which help to stabilize temperatures on planet Earth.
You are repeating consensus science. It is wrong.
The problem here is one of time frame. At microsecond time scales you would be correct. However, at scales of minutes or more you are wrong.
Almost all the “back radiation” comes from low in the turbulent boundary layer. This occurs mostly when an N2/O2 molecule excites a CO2 molecule during a collision. The photon produced carries energy to the surface where it is absorbed and causes temporary warming right at the surface skin.
This creates an energy imbalance. The air cooled and the surface warmed. This influences the ongoing conduction between the surface and air. You get more energy conducted back into the atmosphere. The temporary warming disappears.
This is all in accordance with the 2nd Law.
You provided nothing but an opinion. Maybe I should have left out “atmospheric window” as that is a somewhat vague term. The key point is energy is now absorbed which was previously radiated to space.
The claim conflicts with decades of NOAA radiosonde data. The data shows a decrease in high altitude humidity.
The problem with this claim is warming never materializes. The evaporation is driven by energy already present at current temperatures but directed at the surface by increased CO2. Two effects, one warming and one cooling, are happening together. As a result nothing changes.
Richard M wrote, “Almost all the “back radiation” comes from low in the turbulent boundary layer. This occurs mostly when an N2/O2 molecule excites a CO2 molecule during a collision. The photon produced carries energy to the surface where it is absorbed…”
That is correct.
Richard M continued, “and causes temporary warming right at the surface skin. This creates an energy imbalance…”
I think you might have an incorrect impression of the scale of the warming from absorbing one of those photons. The energy from one of those 15 µm photons is sufficient to raise the temperature of one H2O molecule by 0.000 000 106 4°C.
In other words, it takes 9.4 million of those 15 µm photons per H2O molecule to raise the temperature of water by 1°C.
So there’s no energy imbalance.
Richard M continued, “The air cooled and the surface warmed.”
That is correct. That is what happens when energy is transported: one thing gets warmer and the other gets cooler.
Richard M continued, “This influences the ongoing conduction between the surface and air. You get more energy conducted back into the atmosphere.”
There’s nothing special about radiative transport. Heat movement tends toward equilibrium.
Richard M continued, “The temporary warming disappears.”
That is incorrect. Heat transport does not bounce back and get undone. That would violate the 2nd Law of Thermodynamics.
I just talked about one photon to describe the process. Why would you even mention this? Did you really not understand the atmosphere contains 4*10^40 CO2 molecules?
Conduction reacts to any change in the energy balance. We just had a change.
Why not? In fact it is a requirement of the 2nd Law. If either side changes energy levels then net energy transport will change. In this case, both sides change. One gets warmer and the other gets colder. Net energy flow will compensate.
I have no idea why you are arguing against the 2nd Law.
It is a question of energy residence time. Does CO2 increase the residence time of the energy it affects? Input is assumed to be constant.
At current concentrations, CO2 has a slight effect on energy residence time estimated to be around 0.2 C per CO2 doubling by a couple of papers.
CO2 also directly drives evaporative cooling of a similar magnitude. The net effect of both these processes is zero.
David: I have quantified this obvious dominant feedback. Which rebalances tiny AGW perturbations of 1.6W/m^2 ina fraction of a degree.
You may find this of interest? Few here understand the 2nd Law of Thermodynamics (see atmosphere heating oceans that absorb most of the solar enrgy that then returns it to the neat 0K of space, or the actual reduction of cooling by increased GHE that requires the internal system to warm to rebalance, and how the whole Earth energy balance system in space controls the balance of these effects in general, heads down GHE rabbit holes, in blinkers.
The Balance of the Earth: An Empirical Quantification of Earth’s Energy Balance
http://dx.doi.org/10.2139/ssrn.4950769
THis is not about the tiny amount of AGW effect. It starts by accepting that, and the WV positive feedback as well. It’s about the elphant in the room, the negative feedback that restores the natural Earth energy balance in a fraction of a degree, that they don’t include when guessing the amount of temperature change, they just assume its all caused by human activity. Which is daft when you look at the geological record or extrapolate this sensitivity level to the larger changes of the ice age cycle.
Just flip to the quantification section at the end? The detail explanation of the approach starts at section 2, after describing how absolutely partial and wrong on the measured facts models are, with the evidence for that, hence abetter method is required. I then produce one. On the measured facts and physics of the whole Earth dynamic energy balance in space, which happens at whatever temperature that balance requires.
Enjoy!
E. Schaffer wrote, “Of course Arrhenius, Callender and many others, they all did it wrong. They all stupidly thought ‘back radiation’ had anything to do with it.”
That is incorrect, E. When LW IR “back radiation” is absorbed by the surface, it warms whatever absorbs it.
Do you remember “conservation of energy” from school? The energy which that downwelling radiation represents cannot just disappear! Instead, it is converted to heat (thermal energy).
In other words, downwelling radiation has a warming effect. When it is absorbed by the surface, downwelling radiation makes the surface warmer than it otherwise would have been. The surface, in turn, helps keep the air above warmer than it would have been.
The effects are easily observable. Have you noticed that on clear nights the temperature outdoors drops much faster than it does on cloudy nights?
The difference is because clouds emit a lot of LW IR “back radiation.” The surface absorbs that radiation, and that energy uptake partially offsets the energy lost by the cooling surface.
Thus, when there are clouds overhead “back radiation” from the clouds slows cooling at night. Here’s a graph:
Source: https://sealevel.info/Harde2013_IJAS-503727.pdf#page=25
The intense downwelling IR flux near 667 cm⁻¹ is mostly from CO2.
From about 750 to 1300 cm⁻¹, note how much more intense the downwelling IR is when there’s cloud cover (black trace), compared to clear sky conditions (green trace). That is why on clear nights the temperature outdoors drops much faster than it does on cloudy nights.
(Caveat: when the temperature drops to the dew point, another mechanism also helps to slow cooling; I’m not talking about that.)
I have a little homework for you. You might do this with a partner, but if you are creative, you might find a way to play it alone.
Take one Dollar (any other currency will do) and give it to your partner. Then ask him to give it back to you. Now repeat this procedure a thousand times. Once you are finished, both you and your buddy will have gotten a thousand dollars.
You do not believe me? The money (both of) you received had to turn into a little fortune, because the value it represents cannot just dissappear! Instead it made you rich..
Completely missing Dave’s point. The dollar didn’t disappear.
But the fortune did.
Now have a third buddy, who we will call “Sonny,” continually hand you one dollar every second in perpetuity. After 60 seconds, how many dollars will be in your pocket?
How would the situation be different if you didn’t have the first friend handing you back a dollar each time you gave one away?
Poor, poor analogy.
That isn’t how radiation between a source and cold body works. Go learn from Planck.
I didn’t pick the analogy, I extended the one offered. But of course that is exactly how radiation works – all objects emit radiation and receive radiation emitted by other objects.
energy residence time is the key, as incoming new energy is constant.
If CO2 increases the residence time of exiting LWIR energy, while solar insolation is constant, then some warming must occur.
The question is feedbacks and both the quantity of incoming insolation, and the change in w/l of solar changes, and the residence time of each solar insolation w/l flux.
Heat loss goes up as an exponential while temp only goes up linearly. Any warming from residence time will disappear pretty quickly.
I do not see how feedbacks can exceed the input.
However I have been curious how at some level a GHG will radiate some energy to space that a non GHG molecule would not?
Dear Nick,
With all this evil CO2 flying around, how come its effect is not apparent in surface temperature data for specific sites, like those investigated at http://www.bomwatch.com.au.
What is going on that there is no trend at Meekatharra or Halls Creek in the Pilbara, Marble Bar anyone (https://www.bomwatch.com.au/data-homogenisation/marble-bar-hottest-place-in-australia/), that could be attributed to the climate?
Why don’t you speak up about the evil process of homogenisation that creates trends in homogenised data that have nothing to do with the climate?
Kind regards,
Dr Bill Johnston
http://www.bomwatch.com.au
It also doesn’t work to explain that climate is not temperature. Climate is heat-related and there are a *lot* of components to that. Temperature is not a good proxy for heat-content and therefore for climate. It’s why you can’t average the temperature of different climates to get an “average” climate.
Heat is defined as the flow of thermal energy across a temperature gradient.
EM is not thermal.
The temperature measurements at any specific site may not be accurate
Also, the change in temperature at any specific site is the NET result of all local, regional and global climate change variables, NOT just a 100% positive correlation with global average CO2 measurements.
40 upvotes for a meaningless argument?
’40 upvotes for a meaningless argument?’
50 now. I’m curious as to why, apart from a base appeal to authority, you accept the consensus premise that Schwarzschild’s mechanism for energy transfer is as appropriate near the Earth’s surface, where convection dominates, as it is higher in the troposphere?
Yes, but when you put the all together they somehow right themselves eh Greene?
Great comment Bill,
There is no evidence that CO2 has any warming effect in the atmosphere or on the surface.
ECS for CO2 is ZERO.
bnice2000 wrote, “There is no evidence that CO2 has any warming effect in the atmosphere or on the surface. ECS for CO2 is ZERO.”
That’s 100% wrong, bnice. The evidence which proves the warming effect of CO2 is from spectroscopy. It’s the big green notch measured emission spectra, like this one:
When self-styled skeptics make obviously false claims like that, all they do is strengthen the climate alarmism movement, by discrediting skepticism. When I cited excellent articles on WUWT to climate activists, they invariably point to comments like that, as evidence that WUWT is a crackpot site, not worth reading.
Please, bnice, stop empowering them!
And, everyone else, please stop upvoting that drek!
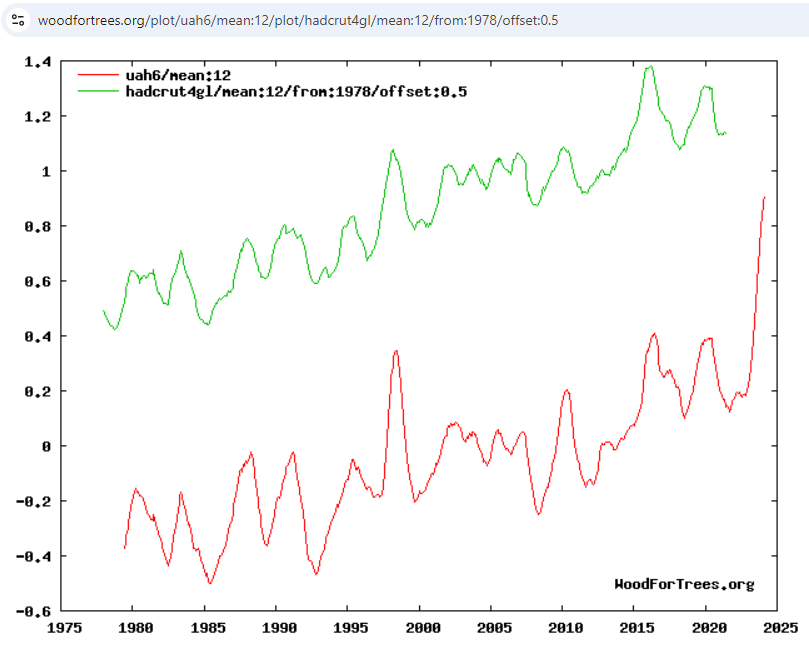
There is also no trend in the 45 years of UAH data that can be attributed to CO2.
Only the spike/step effect of consecutive El Nino events.
Take them out.. there is NOTHING.
bnice, it is not nice to falsify graphs. That is not UAH data. That graph is just plain dishonest. You cannot just insert “corrections” to undo the warming from each El Niño, and leave the cooling from each La Niña.
ENSO does not cause significant lasting global temperature changes. El Niños are warmer than average, and La Niñas are cooler than average. They don’t ratchet-up the long term temperature trend.
Here’s the actual UAH data in red, contrasted with HadCRUT4 in green:
https://www.woodfortrees.org/plot/uah6/mean:12/plot/hadcrut4gl/mean:12/from:1978/offset:0.5
“With all this evil CO2 flying around, how come its effect is not apparent in surface temperature data for specific sites”
Local climate:
For instance having a prevailing wind from off water (lake, sea, ocean).
Even afternoon sea breezes cutting of the max temp, for more temporate climes eg the Med.
Small Islands are notably moderated by the SSTs of the surounding ocean.
McQuarrie south of Tasmania has been brought up here as supposedly an example disqualifying GHG warming.
Nick All they did was use Manabe’s model with a somewhat more sophisticated approach and better data. Of course, they got similar results (more or less). However, a one-dimension analysis with no clouds or horizontal movement of energy doesn’t describe the atmosphere’s general circulation.
Indeed, and it leaves out a lot of feedbacks. But it was the analysis pushed here as a “game changer”.
WUWT has a silly climate science article at least once a week.
They are to satisfy the CO2 Does Nothing Peanut Gallery. These silly articles are like throwing a slab of raw meat to the lions at the zoo. The Peanut Gallery gets excited like a pack of junkyard dogs with one bone.
All evidence of the climate effects of CO2 collected over the past 128 years have been ignored and will continue to be ignored by the You Can’t Prove It Nutters.
They have no idea that science does not prove anything. Science collects evidence to support theories. The Nutters just ignore the evidence and they aways will. You can’t fix an ignorant closed mind. Their CO2 Does Nothing comments make this website a laughingstock among leftists. Who will completely ignore the fact that 19 of every 20 articles here are good.
Mr Stokes, please stop stealing downvotes from me! I was hoping to be the WUWT downvote champion.
They are not arguing that CO2 does nothing.
They usually argue that increases do have a real forcing effect. But they are arguing that the end result of this forcing, when applied to the complicated machine of planet Earth, is not materially to raise global temperatures. This may be right or wrong but its not ridiculously denying basic science. It represents a view, perhaps different from your own, perhaps wrong, but not stupid, of how the various feedbacks in the climate processes work.
I’m not defending the head post by the way. Just asking you to please distinguish between two very different views, one that CO2 does nothing, the other that a rise in CO2 produces heat, but that heat does not produce any material long term rise in temperature. Stop ridiculing the second by assuming it is the first. It isn’t.
The only reason the leftist, deranged, liberal arts, lawyeresque, woke folks latch onto CO2 as evil, is so they can say fossil fuels are evil and should be left in the ground.
Trump will spit in their faces with drill, baby drill, and ban all environmentally damaging off shore wind turbines, and take away all subsidies for any renewables, including battery systems that spontaneously incinerated in dysfunctional California.
Governor News.um is the battery idiocy instigator.
He should impeached or recalled
CO2 is essential for flora and fauna, already for at least 3 billion years.
We, as humans, are just the latest iteration, but certainly not the last.
Trump has never done anything as President to refute climate alarmism, or make even a one minute intelligent statement about climate science, in his entire life. You are suffering from wishful thinking that he will start now, at age 78.
3-1/2 years into the first Trump Administration, he finally got around to appointing eminent conservative climatologists David Legates and Ryan Maue to the White House OSTP, to depoliticize climate science. Better late than never, right?
Wrong. A few months later, after getting pushback from the climate industry, Trump’s OSTP Director, Kelvin Droegemeier, yanked the rug from under Legates & Maue, buried their excellent reports, and smeared their good names.
Trump and his lackeys stabbed skeptics of climate alarmism in the back just like he stabbed pro-lifers in the back.
Will Trump and his people do any better this time? I hope so, but I doubt it.
Perhaps, with leadership from Ramaswamy and Chris Wright, they might do better. But some of Trump’s appointees have obviously been duped by climate industry propaganda, including RFK Jr and Doug Burgum.
RFK Jr is hopeless. He doesn’t have an analytical bone in his body.
Burgum might not be hopeless. He’s a serious thinker, but he’s badly confused about climate change and CO2. Here’s a discouraging interview he did (I think in late 2021) on the subject of “carbon neutrality.”
https://futurefarmermag.com/qa-with-governor-doug-burgum-on-carbon-neutrality/
The administration of Biden has produced much more fossil fuel than the previous Trump administration.
The CO2 Does Nothing Nutters in the various WUWT comment threads DO say CO2 does nothing.
You write that CO2 related “heat does not produce any material long term rise in temperature.”
You fail to define “material”, so you could be assumed to be a Near CO2 Does Nothing Nutter
The author if this article misrepresented Happer’s wild guess effects of CO2, from what I have read. And implies CO2 saturation, that Happer does not ever claim.
Since the long term effect of CO2 and all feedbacks is not known, any claim of saturation or that the effect of CO2 is not material, is BS.
There is a wide range of guesses. 0.5 Degrees C. is below the typical range. And lower than any Happer estimate from any of his many papers I have read over the years.
You label those who disagree with you as “nutters”.
SMH
“The CO2 Does Nothing Nutters ” (says RG.. again….)
And that is despite him being totally unable to prove CO2 does anything.
Obviously the light is on but no one is home at Greene’s place
No one can define material in this context.
Id enough to define do nothing material?
In addition to this, there is an underlying assumption that any change will be net bad and no consideration whatsoever that any warming of the earth might actually be good. It’s just not even on the radar of most people because nobody has ever put it to them.
The Bambi effect from Walt Disney that all baby boomers saw as children. All hunters are evil because one shot Bambi’s mother.
He is manifestly incapable.
The rise in CO2 does not produce heat. It redi uces heat loss to space. So the internal system must warm to restore the enrgy balance of thw whole system. THis is well establsihed fact, not a debating point. The debating point is how much of the temperature change we observe is caused by this paltry AGW perturbation to the total and highly variable negative feedback of LWIR loss that we know must control Earth’s dynamic energy balance in space,
“Their CO2 Does Nothing comments make this website a laughingstock among leftists. Who will completely ignore the fact that 19 of every 20 articles here are good.”
Do millions of leftists look at this site? Probably not more than a few, actually. Nothing to worry about. If somebody posts an article you don’t like- you turn on the your negative charm. A diversity of ideas is good.
You may want to go though life in a conservative echo chamber but I don’t
Well, you can just not come here and if you do come here, you can’t demand what others say. I’m the ultimate skeptic when it comes to religion, politics and the climate- but I like to see what others think even if I don’t agree- maybe try to persuade them to change their minds, but not insult them if they don’t.
Richard, I’d love to go through life in a conservative echo chamber. But there’s nothing conservative about embracing crackpottery.
Conservatives value truth, and honor humility. People who doggedly insist on believing things that are proven false, because they’re too proud to admit that they were ever mistaken, are not conservatives. Even Keynes was more conservative than they are.
You are clearly as delusional as Stokes. CO2 has a limited capacity to absorb LWIR emitted from Earth’s Surface. The saturation argument is clearly valid as recorded in the fossil record
I think your choice of screen name is the best. I have posted your CO2 emissivity chart here several times but finding out CO2 has a near zero emissivity at atmospheric pressure and temperatures doesn’t seem to register.
For Mr. Greene to be correct CO2 can’t be zero emissivity and he has yet to say what he thinks it is. Same with Stokes, etc.
Here it is again.
An emissivity of 0.2 is not “near zero”. Remember, emissivity is a value between 0 and 1. Gases are always less than solids for the obvious reason. There is far less mass to emit radiation.
Average CO2 emissivity is irrelevant.
CO2 is not near the black body emissivity of 1 except for 15 micrometers wavelength
Carbon dioxide/CO2 absorbs hundreds of frequencies grouped into several bands. The 3 main bands are in the far infrared part of the electromagnetic spectrum (wavelength 2.7, 4.3 and 15 micrometers). There are also some weakly absorbing bands in the near infrared.
Emissivity is actually very important. I’m not surprised you don’t understand this.
yes emissivity is very important and can easily be computed using Hottel’s chart
No, see above.
Edit: see below.
yes emissivity is very important and can easily be computed using Hottel’s chart
Richard please note I said at atmospheric pressure and temperatures.
The .2 you mention is at 100 atmospheric pressure and about 1200 K.
The highest at about 1 atmosphere and about 300K is .05 so yes near zero.
Yes, I thought you didn’t have a clue about what the diagram meant. That is not 100 atmospheric pressure. It is 100 bar cm. That is the effect of 100 bar partial pressure CO2 over a path of 1 cm. 100bar cm would be 2.5 km of 400 ppm CO2 at 1 atm. But the path is much longer even than that.
pp of co2 is 0.0004 ats and absorbs to extinction the heat in LWIR in 3500 m reaching saturation
That is 140 bar cm. Leads to about ε=0.2 in Hottel’s chart. Nowhere near extinction. The chart doesn’t go beyond 0.2.
Clearly you have not used the chart for heat transfer calculations. An e of o.2 is enormous for such a low CO2 pp of o.0004 ats. For 20 C and a PcL of 0.0004L e is 0.037. Your e is nearer furnace conditions with high partial pressures of CO2. Think again
0.05 represents a significant number when computing the absorption to extinction of LWIR though the atmosphere vis a vis saturation
??? Air is 0.2. CO2 is 0.002.
….emit and absorb radiation
Hottel’s chart is not suitable for atmospheric heat calculations. Atmosphere is below 300 K so is off chart to the left…where the lines are starting to rise steeply (and would be nearly vertical at the temperature corresponding to 15 microns, about 200K)…. Plus the lines are “bar-cm”…atmosphere is many cm. thick, CO2 partial pressure 400 millionths of a Bar. Hottel made the chart for furnaces with CO2 in the range of 30% and beam lengths of a meter or less. You need to quit confusing people with this mis-application.
Do you prefer this one?
“Do you prefer this one?”
Worse and worse. That one starts at min 500 K.
Hottel’s chart is highly suitable for atmospheric heat transfer calcs in conjunction with Plank’s law and Stean Boltzman
The emissivity of carbon dioxide (CO2) peaks at wavelengths around 4.3 micrometers (µm) and 15 micrometers (µm), corresponding to its primary infrared absorption bands due to molecular vibrations; the 4.3 µm peak is associated with the asymmetric stretching mode, while the 15 µm peak is related to the bending mode.
The emissivity of carbon dioxide (CO2) peaks at a wavelength of approximately 15 micrometers, meaning it most strongly absorbs and emits infrared radiation at this wavelength, which is a factor in the greenhouse effect.
The exact emissivity at 15 micrometers is not a single value. It depends on factors like temperature and pressure. However, it is very close to 1, meaning CO2 is a strong absorber and emitter at this wavelength.
Does anyone disagree with Richard? I don’t. But that instantaneous stretching and bending/absorbing and emitting kinetic energy isn’t the climate control knob. Above 400ppm ATM CO2 the “heat” contribution from that is somewhere between between too little to matter and too little to measure. .
That peak emissivity corresponds closely with the peak emission from the surface.
Yes, you have displayed that many times, but never explained what you think it means. The curves are labelled bar cm. CO2 in air is at about0.4 millibar at surface. But the path length is many cm. The first 10 km is 1e6 cm, so that makes it about 400 bar cm. Way off the top of your graph.
Mean free path of CO2 frequency radiation in the atmosphere is about 10m.
The CO2 laser guys know this.
99.94% of all that frequency is absorbed within 10m and thermalised to the remaining 99.96% of the atmosphere where it become part of the overwhelming convective, conductive and air movements energy transfers.
Any incremental increase in CO2 does absolutely nothing.
That is exactly correct Hoyt C would endorse that
Gas emissivity is a function of co2 pp’ mean beam length and temperature. At L of 10m pp of 0.00035ats and T of 20 C emissivity is 0.037
As the mean beam length L increases so does emissivity. When L is 3600m PcL is 0.00035*3600*3.281 = 4.134FT.ATM .From the chart emissivity is estimated to be about 0.19
The ignorance burns.
The emissivity has nothing to do with it.
Gases do not have true emissivity due to not having a *solid* surface
It is only the wavelength of impinging radiation that is important.
And for CO2 and ~15 micron the efficiency of emission is between 0.95 and 0.98.
Because it causes a CO2 molecule to vibrate due to it being tri-atomic.
”The Earth is warming and the cause is the increase in greenhouse gases like carbon dioxide (CO2) in the atmosphere. Carbon dioxide is a linear, triatomic molecule with a central carbon atom. The harmonic vibrations of CO2 give it its absorption properties.”
https://facultystaff.richmond.edu/~ggilfoyl/cm/examples/vibrations/globalWarming1.pdf
CO2 from 200 to 400ppm has the same effect as CO2 from 400 to 800ppm and CO2 from 800 to 1600ppm. You are living in a CO2 fantasyland.
99.94% of all that frequency is absorbed within 10m and thermalised to the remaining 99.96% of the atmosphere where it become part of the overwhelming convective, conductive and air movements energy transfers.
Any incremental increase in CO2 does absolutely nothing.
This is understandable once you look at the emissivity calculated absorption , that flattens out around 200ppm
bnice, don’t you realize that these two statements are contradictory?
1. you wrote, “99.94% of all that frequency is absorbed within 10m and thermalised to the remaining 99.96% of the atmosphere where it become part of the overwhelming convective, conductive and air movements energy transfers.”
2. you wrote, “Any incremental increase in CO2 does absolutely nothing.”
#1 means that when GHGs in the air absorb radiation, the air is thereby warmed, which is true.
#2 says that does not warm the air, which false. (Warming the air is not “absolutely nothing.”)
That said, #1 is not entirely correct. “Conductive” does not belong in your list, since still air is an excellent thermal insulator. Radiation is a far more important mechanism for energy movement within the atmosphere than is conduction. Also, you omitted evaporation/condensation, which transport a lot of energy.
Conduction always happens at the interface between a solid and a gas. It’s what causes “heat ripples” in the air right above a blacktop parking lit.
when the co2 bands are saturated the 15 micron LWIR exits the atmosphere bypassing fantasyland
Prey, do tell how?
Only a relatively small proportion of the LWIR is absorbed by 400 ppm CO2 the unabsorbed infrared escapes
It would be interesting to see you write a paper on the subject. No doubt, you’ll be citing “science” from the scaremongers.
At least it could be used for a comedy script.
RG is just another science illiterate who “believes” what he wants.
You are also insulting the 99.9% of scientists since 1896 who believe there is a greenhouse effect and manmade CO2 emissions increase it by some amount. But you must be a smarty pants and what do those pesky scientists know?
Many of them didn’t have the increased knowledge of quantum physics and 1000s of experiments. You have no such excuse. You refuse to accept anything but 19th century consensus science. Just another flat earther.
[harrassment ~ctm]
Richard Greene is generally correct, but perhaps a little bit too harsh on the No Nothing Party.
Nope, RG and the entire cadre of luke-warmers are wrong. Try to understand my comments instead of invoking a belief.
I already did on April 23, 2024:
:
Honest Climate Science and Energy: tThe Greenhouse Effect: The CO2 is Saturated Myth
My conclusion is climate change will kill your dog. But not your cat.
Your Statement:
There may be a point where adding more CO2 has little effect, but recent work has cast serious doubt on that (He et al. 2023). We are a long, long way from reaching that point.
My Response:
Summary: Your source may have relevance 1/3rd of the time when ATM CO2 has quadrupled to 1600 ppm
Details
State dependence of CO2 forcing and its implications for climate sensitivity Science
Haozhe He et al
30 Nov 2023 Vol 382, Issue 6674 pp. 1051-1056 DOI: 10.1126/science.abq6872
Quote 1
To avoid the complicating effects of clouds in masking the IRF (7, 19, 20), we further simplified our analysis by limiting it to infrared CO2 forcing at the TOA under clear-sky conditions.
Quote 2
the changes in IRF over time reflect the impact of the stratospheric adjustment from prior CO2 changes on the base state, which in turn amplifies the IRF that would result from a subsequent “hypothetical” quadrupling of CO2.
Because cloud masking has virtually no influence on stratospheric emission, the dominant role of stratospheric temperature also remains under all-sky conditions.
Copilot/Bing/Microsoft
Clear skies exist about 30% of the time over land and less than 10% of the time over oceans. This means that clouds cover approximately 67% of Earth’s surface at any given time.
Copilot/Bing/Microsoft:
Copilot/Bing/Microsoft is not very good at arithmetic. (Sadly, that does not disqualify it from passing the Turing Test.)
“They have no idea that science does not prove anything. Science collects evidence to support theories. The Nutters just ignore the evidence and they aways will. You can’t fix an ignorant closed mind. Their CO2 Does Nothing comments make this website a laughingstock among leftists. Who will completely ignore the fact that 19 of every 20 articles here are good.”
Yep, bang on the money! You’re completely correct about the “deny CO2 effect on principle” mindset that dominates on WUWT. I’ve compared them to mindless football (soccer) fans in previous threads. Many seem incapable of at least trying to be balanced and reasonable. The old saying, “don’t debate with fools” comes to mind. More importantly, your observation that this approach blunts the edge of some of the very good articles that populate WUWT is well made. Let’s see now if I can compete with you for down votes 😂😉
Having said all of that, it must also be conceded by yourself and others that there are also many contributers here who do present some very compelling arguments that do challenge the prevailing CO2 warming narrative.
Here we have another zombie to keep Greene company.
The POINT is that any effect from human co2 cannot be measured and has not even been observed – only postulated. (fact)
Therefore, any effect from human co2 emissions is lost in the noise of natural variation. So…talk of the effects of co2 on the climate is only for entertainment purposes. Pretending there are substantial effects from an EGHE to change policy is evil.
The article does get a few thing wrong, but the overall point is still valid. Saturation of the main spectral band not only occurs, but occurs very low in the atmosphere. This means the only warming effect comes from widening of the spectral band. This is likely pretty weak as Reinhart 2017 found and also Wei et al 2024.
There are several quite unexpected results when one understands the science a little deeper. Downwelling IR does not warm the surface, increased evaporation reduces water vapor’s LWIR absorption, the enhanced greenhouse effect is pseudoscience, etc.
From what you say, as well as (bnice) – with CO2 being saturated (in bnice’s case below 10m).
Then let’s consider WV/H2O Which also absorbs 15 micron terrestrial LW.
FOG to be exact.
Via the above argument would you consider that WV/H2O is saturated by 10m when there is thick fog?
Meaning, I think, that it stops its exit to space?
Because I know damn well that it isn’t.
The LWIR gets through.
Just like with GHE theory the Strat cools.
So does the fog top.
It is radiating 15micron LWIR copiously to space.
(Under clear skies).
Fog cools from the top and not, as unsaturated air does, from the ground.
Instead of the ground being the radiating surface, the fog top is.
Many a night shift I have seen thick fog form until the sky (stars) becomes obscured through it and at that point the ground temp goes above the air temperature (why freezing fog at UK temps most often does not produce an icy road surface).
This cooling via the fog top can easily be seen by an acoustic sounder or from a favourably positioned radiosonde (a very marked inversion forms at the fog top as the whole fog bank cools via vertical mixing under it).
No doubt someone will say my experiences as a N-shift UKMO forecaster at a remote RAF airfield are wrong with a mere hand-wave, but hey, that is what this place is about.
Nope, it means the surface LWIR photons are absorbed and thermalized into the atmosphere. That’s not the end of the story.
Energy can also be dethermalized, that is, a radiative gas can emit a photon after collision with any other atmospheric molecule.
Yes, that is what happens. Energy is constantly being dethermalized and then thermalized again and again. As this ongoing process continues energy moves upward through the atmosphere driven by the reduction in density or finds its way into space quickly.
“Energy can also be dethermalized, that is, a radiative gas can emit a photon after collision with any other atmospheric molecule.”
Yes, that’s called cooling via radiative emission.
Err, you are just describing the very thing I did using different words.
Terrestrial LWIR is not magically stopped by a GHG being “saturated”.
As my recounting of observation of fog formation.
It gets out.
Therefore this “saturation” argument is wrong and specious.
From your above post.
”Downwelling IR does not warm the surface,”
Yes it does, as your putative “dethermalisation” AKA cooling via radiative emission ensures that there must be “downwelling IR”
That is, photons emitted downwards within the 360 deg field of emitted photons as they cool.
You actually think referring to “fog” is relevant? LOL. In fact, saturation means there is no more “Terrestrial LWIR”. All of it has already been absorbed. It has “stopped”.
As I explained elsewhere there is short time period where you can claim it warmed. Your problem … the warming does not persist. It is quickly removed via conduction back to the atmosphere as required by the 2nd Law.
There’s a whole different class of nutter that ignores population increasing to the highest level ever, food production increasing to levels to support the population increases and bad weather changes to be so small as to be statistically zero.
Richard Greene is correct, this article is nonsense and I am disappointed to see it here. I will not bother to read the rest of this sad thread.
It misquotes Happer and colleagues, it claims that the alarmists’ claim is that the effects of CO2 are linear which is NOT what they claim. They get plenty wrong but let’s not put words in their mouth they never said.
This tragedy of an experiment reports results based on model predictions 5 years out. A few watts/m2 added to a planetary mass the size of earth takes decades to be measurable and centuries to arrive at equilibrium. Its like putting a giant cauldron of water on the stove, turning it up to “1”, taking the temperature 7 seconds later and saying “see? stoves don’t heat water!”.
Its absurd, ridiculous, and not right. Its not even wrong.
Minor errors, the main point of the article is reasonable. Saturation is real and does limit the warming effect of CO2 increases.
CO2’s effects are logarithmic, which is why each new ppm has less effect than the one before it.
Saturation implies that at some point more CO2 causes no more warming.
That is impossible by both theory and experimentation. Recall Feynman. It doesn’t matter how beautiful your theory is, if it disagrees with experimentation, it is wrong.
Sorry David, you have not understood the finer details. CO2 has no effect whatsoever.
This it turns out to be true, but not specifically due to saturation. Saturation is what causes DWIR to originate close to the surface which brings conduction and the 2nd Law into play.
You don’t understand the circumstances. There is still a warming effect, but a cooling effect shows up to cancel it out.
See my response to Dave Burton above to understand in more details.
Richard:
Now does this “saturation” effect apply to WV as well ?
Yes, except that water vapor emits different photons with different energy levels. Yes, that makes a difference.
Although I mostly agree with you, David, I do not agree that it takes decades for the effects of a few W/m² to be measurable, and centuries to arrive at equilibrium. The Earth’s climate system reacts quite rapidly to changes in radiative forcing, and the great majority of the effect on temperatures of the anthropogenic CO2 increase has already been realized.
For proof, consider the effect of sudden changes to radiative forcing.
For instance, the combined effects of the IMO 2020 shipping regulations (which suddenly reduced sulfate aerosols) and the 2022 Hunga Tonga eruption have obviously already caused a sudden rise in the various global temperature indexes.
Another example is the 1991 Mt Pinatubo eruption, which is estimated to have caused a 0.5°C decrease in global temperatures in 1992. Minnis et al (1993) Radiative Climate Forcing by the Mount Pinatubo Eruption. Science, 259(5100), 1411–1415. doi:10.1126/science.259.5100.1411 reported: “the [radiative forcing] anomaly derived directly from the data is -2.7 + 1.0 W m⁻².” It obviously did not take decades for that small forcing to be measurable.
In fact, the near total shutdown in civilian aviation following the 9-11-2001 terrorist attacks caused almost immediate measurable temperature changes even though it only lasted for three days! Here’s an article:
https://globalnews.ca/news/2934513/empty-skies-after-911-set-the-stage-for-an-unlikely-climate-change-experiment/
I was speaking in terms of equilibrium. Transient climate response does in fact happen on shorter time scales.
Which equals zero. Lol.
you have little to worry about.
What evidence supports the anthropogenic co2 hypothesis (apart from consensus)
IPCC can’t find it. Maybe you…..
Here you go:
https://sealevel.info/learnmore.html?0=physics#brief
(especially #7 thru #11)
“I was hoping to be the WUWT downvote champion.”
That is why I always upvote your posts 😉
Deserves an upvote
There deinitely is an effect from CO2 GHE that is self evident in the spectra from space and on the surface. But the amount of that due to humans is very small and easily rebalanced in a fraction of degree by the change in LWIR resulting from that warming, mainly change in losses from direct radiation and evapoartion which becomes radiative loss in the Troposphere, which loose more energy to space to rebalance the energy system at the new temperature.
But climate scientists don’t include that, so they are happy that ignorant deniers are so busy denying the scientifically obvious but tiny reality so missing the massive deception. How do you think the Earth manages its energy balance when this varies by up to +/-40W/m^s in a year? Do you think the 240W/m^2 continuously returmed to space to balance the incoming EMR does not change in response to changes within the system or in the primary enrgy input? You would be wrong. It’s the fundamental balance that any planet orbiting its Sun must maintain naturally.
In the whole 500Ma history of the geological record it only changes n by 15 K or so, no tipping points, not bothered. How does it do that?
ANS: Check out the total negative feedback to any radiative pertubation, the cahnge in the main components of the energy balance LWIR per deg K.
Look up images of “solar spectrum” on the internet. You find a large number of similar images demonstrating that the atmosphere is not totally transparent. There are a number of dips in the radiation in the infrared wavelengths that fail to penetrate the air and reach earth at diminished or zero magnitude. This relates to the “greenhouse” effect. The H2O and the CO2 bands overlap at several wavelengths. When the lines hit zero, adding more of these gasses cannot increase the absorption. That’s where we are now. The “greenhouse” effect is nearly saturated.
The greenhouse effect is about CO2 and H2O absorbing IR emitted from the surface, not about absorption of solar radiation.
….which should be compared to the absorbed SW that goes back to the sun and space…..
An evaluation of the greenhouse effect by carbon dioxide | Bread on the water
About 40% of sunlight is IR light. H2O and CO2 absorb some of this IR light. This absorption of IR starts high in the atmosphere and it keeps the earth from over heating.
In a desert with low humidity, much IR light is absorbed by the surface, and the air at surface gets hot. The heat from the surface is removed by convection.
At night the surface cools rapidly because there little H2O to absorb to the out going IR light.
Most solar IR is “near IR” (shortwave), which is not absorbed by CO2. It’s between red visible light or about 780 nm (0.78 µm) down to about 3 or 4 µm. There’s a little bit of solar IR below that, but not much.
The IR which CO2 mostly absorbs and emits is much longer wavelength 15 ±0.8 µm “far IR” (longwave IR). That’s not far from the peak of the Earth’s radiative emission spectrum.
CO2 also absorbs around 4.3 µm and 2.7 µm, but there’s not very much radiation from either the Sun or the Earth at those wavelengths.
Willis got it wrong. The log effect applies to changes in emissivity. That is only part of a bigger picture.
The fact remains that transmission decays exponentially.
The chart references “net downward forcing”. There is no such thing. Any DWIR at the surface is returned to the atmosphere by convection.
Fine, please quantify the slight difference.
All of the warming from CO2 disappears. I’ve explained this in the past and it’s quite complex. I’ll summarize:
1) Downwelling LWIR is mainly conducted back into the atmosphere producing no warming.
2) Downwelling LWIR also enhances evaporation at the surface which leads to a reduction in high altitude water vapor, aka cooling.
3) The emission height for CO2 in the troposphere is fixed due to Kirchhoff’s Law of Radiation.
4) There is a slight warming effect from widening of the main CO2 spectral band (15 µm). This is balanced by 2).
At one time I would have thought all this was impossible. Then I studied the low level physics.
Good chart although the +1 degree C. from CO2 x 2 is just a guess and closer to the lowest part of the typical range 0.7 to 5,5 … but 1.0 happens to be my favorite guess so I have no objections to what’s on the chart. I thought you were a CO2 does nothing guy?
In the scheme of things +1C is “nothing” because it stays below the Minoan, Roman, Medieval Warms (even if the temperature for those periods is only “Regional”.
That 1C does not include any positive feedbacks.
Such as we are seeing now with more SW being absorbed because warmer oceans are reducing low clouds.
Define ”does”
From William Happer:
This is the famous Planck curve that was the birth of quantum mechanics. There is Max Planck who figured out what the formula for that curve is and why it is that way. This is what the Earth would radiate at 15° Centigrade if there were no greenhouse gases. You would get this beautiful smooth curve the Planck curve. If you actually look at the Earth from the satellites you get a raggedy jaggedy black curve. We like to call that the Schwarzchild curve because Carl Schwarzchild was the person who showed how to do that calculation. Tragically he died during World War I, a Big Big loss to science.
There are two colored curves that I want to draw your attention. The green curve is is what Earth would radiate to space if you took away all the CO2 so it only differs from the black curve you know in the CO2 band here this is the bending band of CO2 which is the main greenhouse effect of CO2. There’s a little additional effect here which is the asymmetric stretch but it it doesn’t contribute very much. Then here is a red curve and that’s what happens if you double CO2.
So notice the huge asymmetry. If taking all 400 parts per million of CO2 away from the atmosphere causes this enormous change 30 watts per square meter, the difference between this green 307 and and the black 277, that’s 30 watts per square meter. But if you double CO2 you practically don’t make any change. This is the famous saturation of CO2. At the levels we have now doubling CO2, a 100% Increase of CO2 only changes the radiation to space by 3 watts per square meter. The difference between 274 for the red curve and 277 for the curve for today. So it’s a tiny amount: for 100% increase in CO2 a 1% decrease of radiation to space.
The message I want you to understand, which practically no one really understands, is that doubling CO2 makes almost no difference.
Happer shows the modified spectrum with doubled spectrum, t a fixed 60F temperature, showing a small reduction in upflux. But in steady state, the upflux has to return to the influx value, here 277W/m2. To do that the temperature has to rise. How much? He calculated that – 2.2C/doubling. That is what Manabe got 40 years ago, and is right in the standard range.
From Net Zero Averted Temperature Increase by Lindzen, Happer and van Wijngaarden June 2024
“Using feedback-free estimates of the warming by increased atmospheric carbon dioxide (CO2) and observed rates of increase, we estimate that if the United States (U.S.) eliminated net CO2 emissions by the year 2050, this would avert a warming of 0.0084 ◦C (0.015 ◦F), which is below our ability to accurately measure. If the entire world forced net zero CO2 emissions by the year 2050, a warming of only 0.070 ◦C (0.13 ◦F) would be averted. If one assumes that the warming is a factor of 4 larger because of positive feedbacks, as asserted by the Intergovernmental Panel on Climate Change (IPCC), the warming averted by a net zero U.S. policy would still be very small, 0.034 ◦C (0.061 ◦F). For worldwide net zero emissions by 2050 and the 4-times larger IPCC climate sensitivity, the averted warming would be 0.28 ◦C (0.50 ◦F).”
https://co2coalition.org/publications/net-zero-averted-temperature-increase/
Footnote:
“The proportionality of the temperature increment ∆T to the logarithm of the concentration ratio C/C0 means that the warming from increased CO2 concentrations C is “saturated.” That is, each increment dC of CO2 concentration causes less warming than the previous equal increment. Greenhouse warming from CO2 is subject to the law of diminishing returns.”
Where is graph for H2O?
The absorption bands for CO2 are very limited, and are soon saturated to extinction after a short traverse thru Earth’s atmosphere. No amount of wishful thinking by Stokes can change the physics of Planks Law.
There is still plenty of room in the side lobes
There is no possibility of saturation in the upper atmosphere, where the air is thin and emission to space occurs. So even if we approach a point where the lower atmosphere were saturated, continued emissions would still produce warming.
Nope, as absorption increases (not just in the upper atmosphere but all throughout the atmosphere), emissions also increase. This is demanded by Kirchhoff’s Law of Radiation. The combined effect is a constant energy flux. The entire “enhanced greenhouse effect” is pseudoscience.
Kirchoff’s law of radiation applies to a body in thermodynamic equilibrium, and adding GHGs specifically takes the system out of thermodynamic equilibrium. The warming occurs as the system moves back toward an equilibrium state.
Laughable nonsense. The AVERAGE energy flow will still follow Kirchhoff’s Law.
Adding GHGs applies to BOTH emission and absorption equally and thus changes nothing.
Is there some reason you choose to deny what is very easy science?
Adding GHGs reduces outgoing radiation to space. Since the system is no longer in equilibrium, it will warm as it moves toward regaining that state. If it again reaches equilibrium, Kirchoff’s radiation law will be satisfied.
If we follow the logic of your argument it would suggest that IR cannot affect the temperature of anything, which is rather absurd.
Not for well mixed GHGs like CO2 and CH4. There are two effects and you only understand one of them.
As CO2 increases, the average path length between photon emission and reabsorption is reduced. This is the warming effect you mentioned. What you missed is, more emissions also occur. This is a cooling effect. Kirchhoff’s Law keeps these two effects equal.
The problem with your description is no warming ever occurs. There’s no new equilibrium because the upward energy flux never changes.
This is really simple once you realize more CO2 will always cause more energy emission.
For GHGs which are not well mixed, aka water vapor, this doesn’t quite hold.
In addition, this all happens after surface LWIR is absorbed. You get a basic warming. This is why saturation is important. Almost all the energy is already being absorbed. It’s not that no warming occurs, there’s just a limit and we have exceeded it.
This is not the warming effect. The warming effect results because the effective altitude of emission rises, to a colder layer of the atmosphere, reducing outgoing energy, forcing the system out of equilibrium.
This was a misconception that was disproven nearly a century ago, and it arises from treating the atmosphere as a uniform slab.
And that would be the result of the shortened path length if the increase in emissions didn’t happen. However, Kirchhoff tells us it MUST happen. The combined effect keeps the flow of energy constant. Hence, no change in the emission height is possible.
Utter nonsense. The effect of saturation I have explained is different and is based on knowledge gained over the past century. Your denial is based on ignoring this physics.
At equilibrium.
On average. That is all that matters. Do you believe there’s no such thing as a GAT because the atmosphere is not always “at equilibrium”?
If there is more energy entering the earth system than leaving, there is no “average” equilibrium. The system is gaining energy. The only way to remove energy is via radiation from altitude. Thus the radiation at altitude must increase, and it must do this by the atmosphere warming.
“Thus the radiation at altitude must increase, and it must do this by the atmosphere warming.”
More CO2 means more radiating particles. It doesn’t require a temperature increase to increase radiation, just having more particles radiating will increase the radiation.
There isn’t any more energy entering the Earth System. Same old sun. If there was more energy, then it would warm up. Let us all know when the sun shines a little brighter.
There are more photons moving around, but they come from the same atmosphere. It hasn’t warmed.
All you have to do is make the energy leave a little more slowly, then it will build up in the system. That is what GHGs do. When equilibrium is regained, the reservoir will be higher, the climate will be warmer..
“All you have to do is make the energy leave a little more slowly, then it will build up in the system.”
If that “heat” buildup results in a temperature increase then radiation/convection will go up as well. There won’t be a permanent “heat” buildup. It’s why Tmax is naturally capped since as Tmax goes up so does the heat radiated/convected away. The heat loss goes up as an exponential while the temp rise only goes up linearly.
You’re getting there. The temperature increase is necessary to maintain the radiative balance, so it cannot diminish. That is like saying that once the dam has raised the height of the reservoir, the water level will drop once the stream is able to flow again.
You keep missing the point. The temperature increase is not permanent. For every +ΔT you get a +ΔT^x increase in heat loss driving the temperature back down. The big question is what value “x” has. For a pure black body it would be 4.
“That is like saying that once the dam has raised the height of the reservoir, the water level will drop once the stream is able to flow again.”
It’s not like this at all. You keep using this analogy and it is wrong, especially the “flow again” clause. The water flow never stops, neither will the heat flow. It will wax and wane depending on the heat input but it never stops.
It’s more like you pushing against a wall. You can keep pushing against the wall harder and harder but the opposing force from the wall just keeps going up as well. That’s how heat loss opposes temperature gain.
No, because there is a constant flow of energy trying to move to space, and if that flow of energy is impeded so that the rate of emission to space is less than the incoming solar energy flow, energy will accumulate in the system, and if it accumulates in the system, the temperature increases. The only way for outflow to match inflow is for the temperature of the effective emitting layer to be maintained.
The analogy is effectively one to one for the case of equilibrium. If you can understand why building a taller dam will result in a higher reservoir given the same streamflow, you can understand why increasing the effective altitude of emission will result in a higher surface temperature.
If a CO2 molecule absorbs it can no longer “impede” further flow while energized. LWIR will bypass that molecule until it loses energy by collision or emissions at which time it can absorb LWIR from either the surface or an emitting molecule.. Remember, when it emits, it might be absorbed by a molecule above it or below it, thus it may never reach the surface.
Your analysis of a dam is inept. A dam directly stores water. CO2 does not store energy or, as CAGW advocates say, traps energy. If it did, Mars would have a very hot atmosphere.
But it was energized by flow it absorbed that would have passed right through in its absence.
Or it might not reach spaces without passing through CO2 in a higher, colder layer.
The atmosphere is a reservoir of energy, GHGs are the height of the dam. Mars’ dam has a low height.
Meaningless statement.
Why are you repeating what I said like it was wrong? I said, “absorbed by a molecule above it”. Exactly what is wrong with that. You also didn’t address the fact that it probably wouldn’t reach the surface as “back radiation”.
I didn’t contradict you, just elaborated your point. The higher layers are colder, and emit less intensely than the lower layers. The flow of energy to from these higher layers to space is thus diminished than it would be had it simply passed to space from the warmer layers below.
“No, because there is a constant flow of energy trying to move to space”
The operative word here is “constant”. You have been fooled by climate science always using an “average”. The flow of energy to space is *NOT* constant.
“if that flow of energy is impeded so that the rate of emission to space is less than the incoming solar energy flow,”
Typical climate science religious dogma. I showed you how the emission to space goes UP as temperature tries to go up, it doesn’t stay the same nor does it decrease.
More CO2 means *MORE* emission to space, not less. Yes, the amount per molecule goes down but the number of molecules emitting goes up. Climate science only looks at the emission per molecule and ignores the emission of the total mass – and more CO2 means more total mass emitting.
“If you can understand why building a taller dam will result in a higher reservoir given the same streamflow”
Again, this is an incorrect analogy! A dam *stops* water. CO2 does *NOT* stop energy flow to space. The fact that you had to add the assumption “same streamflow” is a tacit admission that you know I’m right. CO2 either emits to space directly or is thermalizes to the atmosphere meaning latent heat loss goes up. More CO2 means more emission and more thermalization. That increases the gradient with respect to space. Increased gradient means more heat flow. That’s a negative feedback that forces temperature to remain at equilibrium.
ΔT^x ∝ ΔT. You don’t seem to quite understand this simple proporitonality. You are requiring ΔT^x to be 0 (zero) with your assumption of constant streamflow.
The only way to raise the temperature is to increase the rate of energy input. The only energy input to the system known as Earth is from the sun. CO2 is *NOT* an energy source, it can’t increase temperature beyond what the sun provides the energy for.
You are correct about this, but failing to connect the dots. The temperature is going up because emission to space has gone down, so to bring the emission to space back up, temperatures have to go up. If temperatures go down, emission to space also goes down. If emission to space goes down, temperatures have to go up until the planet is in radiative equilibrium with incoming sunlight.
It means the same emission to space as before the CO2 went up, once temperature has equilibrated.
A dam does not stop water, it impedes the streamflow flow until the water rises enough to flow over the dam. Raise the height of the dam and the water will rise more until the same streamflow is attained.
Or reduce the rate of energy output. I can get richer on the same salary by reducing my spending.
“The temperature is going up because emission to space has gone down, so to bring the emission to space back up, temperatures have to go up.”
Simple math seems to elude you.
Total Radiation (TR) = Mass (M) * (radiation (R) / Unit-Mass (UM) )
If R/UM goes down but M goes up what happens to TR?
You keep ignoring the fact that more CO2 means more CO2 radiating, i.e M goes up!
It’s the same kind of assumption you make when you assume “the stream flow is constant” in your dam analogy. They are both unjustified assumptions you need to make in order to make your religious dogma work.
“If temperatures go down, emission to space also goes down. “
You simply don’t know this. If the total mass radiating goes up then the emission to space can stay the same, it can go down, or it could actually go UP!. You haven’t provided a single thing to justify your assumption that total radiation will go down. Climate science never does. It just makes implied, unstated assumptions that are never justified in any way, shape, or form.
“It means the same emission to space as before the CO2 went up, once temperature has equilibrated.”
With more mass radiating that equilibrium temperature can actually be LOWER! You could still have the same heat-in vs heat-out relationship at a lower temperature.
JUSTIFY YOUR ASSUMPTION THAT MORE CO2 MEANS LOWER TOTAL RADIATION! My guess is that you simply can’t. It’s just a statement of religious dogma.
“A dam does not stop water”
Your ability to make rational arguments is failing. A dam *does* stop water. CO2 does *NOT* stop heat from going into space. More mass of CO2 means more mass radiating and thermalizing (i.e. latent heat). You want us to make the unjustified assumption that “the stream flow remains constant” when, in reality, adding more CO2 is like increasing the stream flow by dumping more run-off into it from the surrounding landscape. Even if the individual flows into the stream lessen, the total flow can remain the same or go up, going down is not the only possibility.
In essence, you keep trying to employ the argumentative fallacy of Argument by False Dilemma. You keep offering only one possibility when, in fact, at least three possibilities exist.
Allow me to introduce you to the Stefan-Boltzmann law.
Adding CO2 in isolation drives up both absorption and emission, but emission to space is reduced because the effective altitude of emission is increased.
The sun provides a steady source of energy that must move to space. CO2 and other GHGs set the altitude at which this is able to occur. Adding or removing GHGs alters this effective altitude of emission. If it moves up, the planet warms, if it moves down, the planet cools.
“Adding CO2 in isolation drives up both absorption and emission, but emission to space is reduced because the effective altitude of emission is increased.”
You STILL don’t get the math! The radiation per unit may go down. But if the number of units goes UP, then the radiation has three separate possibilities: 1. stays the same, 2. is less, 3. goes up.
The magnitude of the heat loss from earth is based on the total radiation from the mass. Greater mass emits more radiation.
The S-B law: “The Stefan–Boltzmann law, also known as Stefan’s law, describes the intensity of the thermal radiation emitted by matter in terms of that matter’s temperature.”
If a CO2 mass is radiating less then it means it has COOLED, not warmed. But the total heat loss via radiation is related to the total mass. Add more mass means adding more radiation. And it is total heat loss that is at issue, not the intensity of the radiation from an individual unit mass.
Your assumption that the amount of radiation from the Earth goes DOWN when CO2 is added just isn’t justified in any way. You haven’t offer a single assertion of justification at all. You just keep repeating the religious mantra that total radiation to space goes down when you add CO2.
Adding molecules of CO2 does not change the intensity of emission as a consequence of the increased number of molecules emitting, because the same molecules are proportionally absorbing exactly as much as they are emitting. Just adding molecules alone would have no effect on temperature.
The reason that the intensity of outgoing radiation is reduced when CO2 increases is because the energy being emitted to space is coming from a colder layer of the atmosphere. Colder things radiate less intensely than warmer things. This is not an assumption – this is a law of physics, cited above. A photon emitted from the previous effective altitude of emission is now statistically more likely to interact with a CO2 molecule than it was at the previous lower concentration. The same likelihood of emission to space is now found at a higher altitude.
It means it’s being emitted from a colder layer of the atmosphere. You can visualize this using MODTRAN. Take all the CO2 out of the atmosphere:
And from space it “looks like” most emission is occurring from near the surface. Add 400ppm CO2:
And it “looks like” a band of emission is occurring from high (cold) altitude.
This is just one of the problems I have with climate science. The fundamentals are not studied in sufficient detail. A W/1m² is not adjusted for the actual surface area that is radiating.
If you have a homogeneous solid of 1m², you are correct, adding mass below the surface would not change the intensity. But you are not dealing with a solid. CO2 is a gas. It does not have a solid surface of 1m² that is radiating. Adding additional mass does increase the radiating surface area.
Ultimately, your argument that adding CO2 does not increase the area of radiating won’t hold water. Planck confirms that absorption without emission is impossible. The new CO2 must either emit or it must not absorb. Your position is that CO2 is saturated so new absorption is minimal.
From: The Theory of Heat Radiation by Max Planck.
Planck didn’t deal with conduction. The new CO2 could lose absorbed energy through collision (conduction) but that would increase temperatures and according to you that doesn’t occur either.
What is left? Additional CO2, doesn’t have any effects THAT ARE MEASURABLE.
“The reason that the intensity of outgoing radiation is reduced when CO2 increases is because the energy being emitted to space is coming from a colder layer of the atmosphere”
This is true for each unit of mass. But you are *still* ignoring that the mass has increased due to the increased number of CO2 molecules involved.
The variables involved are prior mass (M1), prior radiation per unit mass (MR1), new mass (M2), and new radiation per unit mass (MR2).
One of three situations can happen
You want us to believe No. 3 is the only possible option based on religious faith alone.
Why can’t you provide justification for this faith-based assertion?
You are correct that slowing down energy flux to space would lead to warming. CO2 increases do not slow down the energy flux. The flux is independent of CO2 concentration.
Nope, more GHGs do not make the energy leave “more slowly”, That would violate Kirchhoff’s Law of Radiation.
There’s just as much energy leaving as there has always been. No change occurs when you increase CO2 concentration. Denying Kirchhoff’s Law is just plain silly.
“There’s just as much energy leaving as there has always been. “
If that wasn’t true the Earth would have never developed life at all.
If you get X emission from a CO2 molecule with a total mass of Y for all CO2 then you get total emission of Total = X * Y. Then you have to calculate the emission of (X-u) * (Y + w) = Total where u is the value of the lower emission and w is the additional mass of CO2.
If (X-u) goes down and (Y+w) goes up what happens to Total?
Climate science always looks at (X-u) and says total emission goes down. Totally forgetting about (Y+w).
If Total stays the same then you get the same heat loss to space regardless.
“What you missed is, more emissions also occur. This is a cooling effect. Kirchhoff’s Law keeps these two effects equal.”
No, what you keep missing is that Kirchhoff’s law does not exist in the atmosphere – it is an example of a non-equilibrium state …
”The Earth system is remarkably different from its planetary neighbours in that it shows pronounced, strong global cycling of matter. These global cycles result in the maintenance of a unique thermodynamic state of the Earth’s atmosphere which is far from thermodynamic equilibrium”
https://pmc.ncbi.nlm.nih.gov/articles/PMC2871909/#:~:text=The%20Earth%20system%20is%20remarkably,from%20thermodynamic%20equilibrium%20(TE).
If it was, then there would be no lapse rate.
There is.
As thermodynamically atms molecules have warmer ones below and cooler ones above.
Not in thermal equilibrium.
A LR.
Of course the atmosphere is constantly changing. However, all that is needed is for the average to follow the lapse rate and the natural energy flow will follow.
I assume you also think there’s no such thing as a GAT. Same argument.
The “argument” is that there is are non-condensing GHGs that cause the atmosphere to *warm via collision and re-emission of LWIR.
You cannot have that if Kirchhoff’s law applies to the atmosphere.
There has to be temp/pressure delta. A LR.
And there always is, as Venus proves.
it is not saturated, because there are always fewer colder CO2 molecules aloft so that the IR eventually gets out – at a colder and weaker rate of emission.
The only part of Kirchhoff’s Law of Radiation that is important is that emissivity is always greater than or equal to absorptivity for any given CO2 molecule. This always holds for gases in our atmosphere at the same altitude. That is all I am referring to and it is obviously true.
‘Adding GHGs reduces outgoing radiation to space. Since the system is no longer in equilibrium, it will warm as it moves toward regaining that state.’
Back to the ‘canonical’ narrative again? Whatever happened to the new and improved paradigm of climate alarmism as ‘informed’ by the models, i.e., OLR increasing concurrently with higher ASR (lower cloud cover)?
You, bdgwx and Anthony Banton need to make up your minds.
https://wattsupwiththat.com/2025/01/16/cloud-reduction-global-warming-crgw-101-a-competitive-theory-to-co2-related-global-warming/#comment-4024342
What I am describing is the basic mechanism by which increasing GHG concentration produces warming, what Anthony is describing is a positive feedback mechanism arising from this perturbation.
What you’re describing is the ‘canonical’ narrative that had to be ‘modified’ because it doesn’t conform with satellite (CERES) observations.
What also doesn’t conform with observations, in this case ice and deep sea drilling cores, is the theory that our CO2 emissions will have any effect on Earth’s surface temperatures. There’s obviously something amiss with the theory.
The Schwarzschild model works great in the upper troposphere where GHGs can freely and reversibly absorb / emit photons in accordance with Kirchhoff’s Law. It is not applicable to energy transfer in the lower / near surface troposphere because GHGs in their excited states are effectively prevented from spontaneously emitting photons due to thermalization by collision with O2 and N2. Thermalization then induces deep convection, meaning that Kirchhoff’s Law, and therefore the Schwarzschild model, is no longer applicable.
The so-called GHE, where the Earth’s near surface temperature is higher than the temperature derived by applying the S-B equation to the LW output seen from space, is a result of this thematization. It is not the result of downward radiation, which is blocked because GHGs in that region are effectively in saturation.
No, I’m describing basic CO2 forcing. This is not “modified” by considering feedback mechanisms – the feedbacks arise because of the initial forced perturbance. Models reproduce the observed change in OLR under CO2 forcing.
That is incorrect. The temperature of the effective altitude of emission is constrained by the S-B law at 255 K – this is the temperature necessary for an object at the earth-sun distance to radiate with sufficient intensity to balance incoming solar radiation. Were there no absorbing gases in the atmosphere, this effective altitude of emission would be at the surface. Conduction from the surface to the atmosphere might initiate convection, but this would not change the surface temperature. There would be no radiative exchange between gases in the atmosphere, all outgoing longwave radiation would simply pass through the atmosphere into space.
‘Were there no absorbing gases in the atmosphere, this effective altitude of emission would be at the surface.’
But there ARE GHGs in the atmosphere. Near the surface, these continually absorb photons in discrete energy bands before imparting most of this energy to non-GHGs via collision in a process known as thermalization. This process warms the lower atmosphere, causing it to convect, thereby transporting this thermal energy to higher altitudes.
Only at higher altitudes, are GHGs that have entered an excited state via collision, effectively able to spontaneously emit photons to space.
Obviously, there is a continuum between a largely convective mechanism near the surface and a largely radiative mechanism near the top of the troposphere.
Yes, you’ve succinctly described the process. Photons are emitted to space from high altitude instead of the surface, whether the energy is carried to that altitude by radiative transfer or convection. The surface is warmer than these high altitudes because of the lapse rate. This is the greenhouse effect. Add GHGs and you push that altitude up higher, where it’s colder. Colder things radiate less intensely than warm things, so the outgoing IR is reduced. This is GHG forcing, and it can never be saturated, because you can keep pushing the effective altitude of emission up indefinitely.
‘The surface is warmer than these high altitudes because of the lapse rate.’
No – thermalization lower / radiation higher in the troposphere causes the troposphere to convect within limits imposed by, among other things, the Earth’s gravitational field. The lapse rate is a manifestation of these processes, not their cause.
Similarly, the ‘effective altitude of emission’, aka the EEL, is also a manifestation of these processes. While it may be useful in Alarmism 101 to graphically show that an increase in EEL will raise average surface temperatures in accordance with the lapse rate, there is no evidence that this is occurring, or has even ever occurred.
Let’s review some basic facts: First, we live on a water planet, meaning that the reservoir of the GHG (water vapor) with the broadest spectrum of radiative activity, including frequencies that completely overlap the most important frequencies of CO2, is effectively unlimited. Second, despite very large swings in atmospheric CO2 content. there is no evidence in the geological record of its having had any impact on global temperatures.
Given that varying CO2 has had no demonstrable effects on surface temperatures, it is only logical to conclude that its role in energy transmission to space is largely residual and mostly limited to emitting photons that were previously emitted by water vapor at altitude. Adding more CO2 to the atmosphere, then, will not result in saturation, or raise the EEL for that matter, because emission from water vapor has already transported most of the energy previously transported from the surface to space.
It is a manifestation of the concentration of GHGs. Without GHGs, the EEL would be at the surface.
Water vapor is a condensing gas and the upper atmosphere is dry. Nor does water vapor completely overlap the major frequencies of CO2, this is simply untrue.
‘Without GHGs, the EEL would be at the surface.’
No kidding. I never said anything to imply otherwise.
‘Nor does water vapor completely overlap the major frequencies of CO2, this is simply untrue.’
Actually, it is effectively true. Just look at Happer’s graphic of the Schwarzschild curve for CO2 concentrations of 0 and 400 ppm. It’s very clear that H2O is radiatively active over the entire range of the spectrum that comprises the so-called notch.
You can play with this using the MODTRAN model on U Chicago’s website:
This is earth with no absorbing gases:
Earth with no water vapor but 400ppm CO2:
And earth with water vapor:
Part of this is the altitude effect I described earlier – the upper atmosphere is dry, and this is where most IR emission to space occurs, so even though water vapor is abundant in the lower atmosphere, noncondensing gases have an outsized influence on the GHE relative to their concentration. The other part is that the overlap is not constant – there are multitudes of gaps in the “picket fence” of absorption lines for H20, where IR can slip through without CO2, even in areas where their absorption seems to overlap.
I have no problem with MODTRAN, as long as we both acknowledge that it is a radiative-centric model of atmospheric energy transfer from the Earth’s surface to space. So, as long as we’re ignoring convection, let’s use Happer’s (and van Wijngaarden) radiative-centric results, since they’ve already included the CO2 doubling case:
(W/m^2)
394 – No GHGs
307 – No CO2
277 – CO2 = 400 ppm
274 – CO2 = 800 ppm
As you will note, the effect of CO2 doubling is only 3 W/m^2, which is quite small, particularly in comparison with the annual variability of solar intensity due to Earth’s elliptical orbit around the Sun.
Having said that, there’s no doubt that CO2 emits photons at tropospheric levels above those of water vapor. The problem is that radiative-centric models don’t account for the fact that convection in the lower troposphere effectively ‘separates’ radiative changes aloft from radiation emitted by the surface.
Yes, the forcing per doubling of CO2 is 3.7 W/m^2 in the absence of feedbacks, this produces about a degree or so of warming.
Any modern climate model includes convective transport.
‘Any modern climate model includes convective transport.’
Yes, a whopping 18.4 W/m^2 according to NASA. Therein lies the problem – convection is basically ignored, which means the modelers are unaware that the bulk of the energy emitted by the Earth’s surface that doesn’t escape directly to space via the atmospheric window is first absorbed by GHGs and thermalized within meters of the surface.
Again, radiative-centric models provide an incorrect mechanism for the transport of energy through the lower troposphere, which is why, contrary to alarmist theory, there is no physical evidence that large variations in atmospheric CO2 content have ever had an impact on surface temperature.
This is an observational result as well as a modeled one. If you don’t like it, please present your contra-evidence.
Again, these estimates are observational, but NASA’s energy budget diagrams do indeed show the bulk of energy emitted being absorbed by the atmosphere:
This is the greenhouse effect.
‘Again, these estimates are observational, but NASA’s energy budget diagrams do indeed show the bulk of energy emitted being absorbed by the atmosphere’
Per NASA, 358.2 W/m^2 are absorbed by the atmosphere. That energy is converted into kinetic energy via thermalization by non-GHGs within meters of the surface. ‘Reverse’ thermalization can only occur higher in the troposphere where a much lower rate of molecular collisions finally allows GHGs to spontaneously emit photons. The 340.3 W/m^2 of ‘back radiation’ is the fictional result of radiative-centric models.
Again, the real GHE is the result of absorbtion / thermalization near the surface, emission aloft and convection in-between,
Unfortunately for your theory, the downward long wave radiative flux is directly measured. see, e.g. Vardavas and Taylor, 2007, or Kruk et al., 2010.
Partly that, and partly radiative transfer. But however the energy gets to altitude, that is where it is finally emitted to space in the form of radiation, and raising the altitude at which this occurs by increasing the concentration of GHGs necessarily forces the temperature higher.
‘Unfortunately for your theory, the downward long wave radiative flux is directly measured. see, e.g. Vardavas and Taylor, 2007, or Kruk et al., 2010.’
I’ll take a look, but I’ll bet what they claim to have measured is only the thermally excited emission of near-surface GHG molecules:.
Given that the KE of air molecules follows a Maxwell-Boltzmann distribution, only 3-4% of air molecules at room temperature have sufficient KE to excite a CO2 molecule, which falls to about 1% at -50C. (The numbers are somewhat higher for H2O).
Such emissions near the surface may be measured and referred to as ‘back radiation’. However. it cannot transport energy over distances due to the process of thermalization
“You, bdgwx and Anthony Banton need to make up your minds.”
No, you need to understand what we (the science) is saying.
The climate system reacts to a *pulse* (in geological terms) of CO2 by having to warm in order to balance energy imbalance (SB law).
It does via the feedback of reduced cloudiness allowing more solar SW to be absorbed.
This explains:
https://www.pnas.org/doi/10.1073/pnas.1412190111
The Donohoe paper, again. You do understand that it was the genesis of my concern over a (very) apparent modification of the CAGW narrative by alarmists given the failure of their theory (reduced OLR) to fit observations (increased OLR)?
As for your statement that you are ‘the science’, you might want to tone down the hubris, and certainly refrain from implementing harmful energy policies, until you can provide evidence that variability in the amount of atmospheric CO2 has caused any appreciable changes in the Earth’s climate system.
Kirchhoff’s law does not apply to the troposphere.
If it did there would be no lapse rate (where the Connollys went wrong).
There is a LR.
And so Kirchhoff’s Law does not apply.
IE: The troposphere is NOT in thermodynamic equilibrium.
It is in hydrostatic equilibrium.
A very different thing.
That is air is essentially buoyant absent convection/mixing.
The mere fact that Earth’s atmosphere has a LR tells you Kirchhoff’s law is absent.
Complete nonsense. Kirchhoff’s Law says nothing about a lapse rate. But, it isn’t even required. All you have to know is the behavior of emission and absorption are consistent.
Denial of basic science is common among climate cultists. Thanks for yet another example.
“Kirchhoff’s Law says nothing about a lapse rate”
It says “at thermal equilibrium, the power radiated by an object must be equal to the power absorbed.”
And I keep telling you that a molecule in the atmosphere is not at thermal equilibrium.
As in it is colder above it and warmer below.
In thermal dis-equilibrium.
That is because there is a LR.
Ergo, if it were in thermal equilibrium it would be isothermal.
Not important to the issue. All that matters is emissivity is greater or equal to absorptivity which is the part of Kirchhoff’s Law of Radiation I am referring to.
This tells that if you increase absorptivity, which increasing CO2 concentration would do, you must also have increased emissivity.
The increased emission of more photons is what balances the affect of increased absorption.
You haven’t studied thermodynamics have you? Kirchhoff’s law of thermal radiation does require thermodynamic equilibrium, but it is applicable to small volumes that can have measurable states. Planck defines these volumes as dτ. Those volumes not so small that atomic interactions becomes important yet are large enough for pressure, temperature, etc. to be measurable.
Read this site and included references. https://www.grc.nasa.gov/WWW/k-12/airplane/thermo0.html
Consequently, the volumes to be assessed need only be small enough for the lapse rate to be negligible when compared to the volumes temperature. Let’s say a cm³ or maybe a m³.
The whole troposphere, that you are declaring is really an argument of ad absurdum. That is not a refutation of anything.
Kirchhoff’s Law still applies to these smaller volumes.
‘Kirchhoff’s law does not apply to the troposphere.’
At least not until the upper reaches thereof.
‘The troposphere is NOT in thermodynamic equilibrium.’, and
‘That [] air is essentially buoyant absent convection/mixing.’
Congratulations! You now understand why applying Schwarzschild’s radiative model to the entire troposphere in order to maintain the CAGW theory that ‘back radiation’ is responsible for the GHE is incorrect.
Exactly, this is where radiation models show additional absorption. However, that is not the end of the story. As CO2 absorption increases, water vapor absorption decreases. This is never noticed in these analyses because they don’t properly model water vapor changes.
What about the SW?
Irrelevant Henry CO2 sw absorption is minimal and totally covered by water vapour, as Knut Ångström measured in 1900 in Mount Teide.
Well within? Try barely within, and at the lowest extreme of the IPCC range.
On the other hand, the so called climate scientists are for the most part pushing claims of 3 to 5C of warming.
I just love how you climate alarmists tune your message to the audience.
AR6 gives a best estimate for ECS of 3°C/doubling. vW&H’s estimate of 2.2°C/doubling is hardly a gamechanger. Especially as they consider only one feedback (wv).
From the paper: “These calculations considered the case of a clear sky one dimensional atmosphere in radiative-convective equilibrium.” Since these assumptions are only an approximation and not reality, how reliable are these results?
You could ask the WUWT author who cited the paper.
yea right – CO2 increases in atmospheric inventory are CAUSED by increased temperatures not CAUSE them.
I have repeated this to this dumb spammer Stokes time and time again, but it’s pointless.
He keeps banging out foolish ascii on his PC regardless of all facts.
“CO2 increases in atmospheric inventory are CAUSED by increased temperatures not CAUSE them.”
Why is the following so difficult to understand for some ?
CO2 is a greenhouse gas.
It exists in nature within the carbon cycle, which IS driven by temperature … and is the normal way it has responded when not perturbed by a large *pulse* of it.
The Carbon cycle has sinks and sources and they should be in balance for the non-condensing gas to keep Earth’s GMST stable.
Remember WV will follow temp also as its atmospheric concentration is dependent on temp, and therefore so will its GHE.
Now orbital changes take place causing a slow redistribution of ASR, most effective over the high NH landmasses. More ASR there and warming occurs globally, the oceans warm and are less able to sink the CO2, even with some outgassing.
Conversely as ASR wanes there, cooling occurs globally and oceans sink more CO2 slowly reducing the GHE as CO2 concentration falls.
The natural carbon cycle.
And so it has been, mostly, over Earth’s history EXCEPT when said *pulse* is injected into the atmosphere (PETM … CO2 pulse from volcanic outgassing).
More CO2, more GHE, warming until balance is achieved.
CO2 therefore ALSO drives temperature thusly.
When introduced from outside the slow carbon cycle.
And this is what mankind has done (increasingly) over the last ~150 years.
Introduced a *pulse* of non-condensing GHG from outside the CC – and the atmosphere must warm as a result.
CO2 both leads AND follows temperature changes.
We need to do a lot of talking about the limits of CO2 to increase global temperature. I think using the term absorbs heat isn’t correct. CO2 slows down the escape to space of long wave radiation. The important point is that CO2 has limits. Considering these limits additional CO2 can not be the crisis the other side is making such a fuss about.
“using the term absorbs heat isn’t correct”
Right Bob. If we are talking physics, scientific concepts and terminology are important.
Heat is a type of energy transfer that occurs between bodies due to temperature differences. Heat is flow. How can flow be absorbed? Energy is absorbed, not heat.
Another nonsense phrase is “trapping heat”. Heat is never trapped. 2nd Law.
And the article discusses an experiment with “back radiation”. There is no back radiation, only radiation.
Non scientific talk produces non scientific concepts.
Correct.
And thermal energy can only be “trapped” (correctly described as reducing the rate of thermal energy flow) by some form of insulation. The notion that an atmosphere consisting of a mere 400 ppm of one trace gas can insulate the surface of Earth such to cause massive run away heating is simply ridiculous.
It is the mass of the entire atmosphere that serves as both a heat sink (ie retains thermal energy) and an insulator between Earth’s surface and the extreme low temperature of space that moderates the surface temperature swings between daylight and dark as experienced on the airless moon, and the very thin atmosphere of Mars.
Of course the major heat sink on Earth, orders of magnitude greater than the atmosphere, is the liquid water of the oceans that cover 70% of the planet’s surface. It is the oceans that “capture” (retain) most of the solar thermal energy. The oceans control energy transfer to the atmosphere, aided by the Coriolis effect and of course ocean current systems that transfer thermal energy from equatorial regions to polar regions.
Heat is a type of energy transfer that occurs between bodies due to temperature differences. Heat is flow. How can flow be absorbed? Energy is absorbed, not heat.
Sorry, this is nonsense. Heat IS a form of energy, and its dimensions are Joules/Kg or Joules/mol. Heat flow has the dimensions of Joules/second or Watts.
A good way of thinking about the heat contained in a body is to consider it as the sum of the kinetic energies of the atoms which comprise it.
It’s interesting that we disagree on this basic high school level physics. Perhaps this Wikipedia page needs editing.
https://en.m.wikipedia.org/wiki/Heat
1. “In thermodynamics, heat is energy in transfer”
2. “As a form of energy, heat has the unit joule . The standard unit for the rate of heating is the watt (W), defined as one joule per second”
”With various other meanings, the word ‘heat’ is also used in engineering, and it occurs also in ordinary language, but such are not the topic of the present article.”
“The terms thermal energy and heat energy are often used interchangeably, as they both involve power created by heat.
” But what is the difference between thermal energy and heat? The definition of thermal energy in science is the stored or total internal energy of a system’s temperature, while heat represents thermal energy transfer. “
Mr. Pentland is correct. For heat to move between two bodies there must be a temperature gradient and the movement of heat will be from high to low. Heat is only recognized at the boundary. Prior to the boundary it is internal energy after the boundary it is again internal energy.
Your claim of Joules/Kg says that mass is involved and that’s not true.
Work and heat are both in Joules.
When we say energy is absorbed we mean it has changed in form. (1st law of thermodynamics)
“They concluded that doubling CO2 from pre-industrial levels from 400 to 800 ppm “shows no measurable increase in infrared radiation absorption, and thus can lead to just 0.5C warming increase at most”.”
Of course it won’t in a lab experiment, with a path length of a few metres. They probably couldn’t observe an absorption at all. But the atmosphere path length is many kilometres.
Of course, none of these studies has achieved publication in a peer reviewed journal.
I did not need a lab experiment to prove that thet net effect of more CO2 in the air is nothing. There is no condensation of CO2 in the air like water. So all you need to do is look at the re-radiation of CO2 in terms of energy viz-a-viz the sun and earth. The results came down to zero.
You don’t understand radiative heat transfer.
Nick, irrespective of the saturation equation, any CO2 warming will be modulated by water vapour the most abundant and effective greenhouse gas as you well know. Current modern warming is proving benign for us and the planet, so what’s the real problem mate?
Nick
There is no heat transfer because except for water vapor and CO2, all gasses are transparent for same re- radiation.The 1 in 10000 molecules of CO2 that were added to the atmosphere have no mass to keep much heat…
“The 1 in 10000 molecules of CO2 that were added to the atmosphere have no mass to keep much heat”
AS Nick said …
“You don’t understand radiative heat transfer.”
Mass has nothing to do with it. (though molecular concentration has).
CO2 and H2O are tri-atomic molecules and as such have a vibrational condition that LWIR exites (specifically important at 15 micron).
This excitation is conducted by adjacent N2 and O2 molecules to warm them.
Anthony, yes, but quantitatively only a miniscule amount.
In percentage terms, of non-condensing GHGs, CO2 is 98% of the 1% that they comprise the atmosphere.
(99% of it being transparent to LWIR).
WV being 1-4%.
Therefore that “miniscule amount” has an outsized effect.
This vid shows visually how it’s EM opacity has deepened going from 280ppm to 400ppm (now 425ppm).
What nonsense, comparing ink in water with the addition of 1 in 10000 molecules in the air…
No not nonsense.
A visual demonstration of the absorption differential of a concentration change by 50% of a substance that absorbs EM radiation. And this takes no account of path-length.
It is of a different wavelength yes, the visible rather than IR, but is still the visual equivalent of a disruption of the passage of EM energy through a medium.
You can rail all you like – but the fact remains that increasing the concentration of CO2 in the atmosphere by 50% has a very significant effect on the ability of LWIR to exit to space.
A silly visual that bears no relationship to what happens in the atmosphere.
Wow. !
You need to watch this video and learn.
That’s the best you can do to quantify the heat or energy, whatever you want to call it, from the 0.04% of molecules “vibrating”. Try again.
Each transfer is only a miniscule amount, however since none of the molecules are destroyed by the reaction, they are available to repeat the transfer over and over again.
Yes, it’s safe to say they are constantly vibrating (molecular bonds stretching and bending) but as they do they aren’t getting hotter or increasing in velocity. None issue.
How exactly does the vibration of a CO2 molecule cause a translation change in N2 or O2?
By collision
“How exactly does the vibration of a CO2 molecule cause a translation change in N2 or O2?”
Watch this video, a couple of times, you will get a better understanding…
There’s are reasons we didn’t run Shula’s post here.
“It doesn’t matter how beautiful your theory is, it doesn’t matter how smart you are. If it doesn’t agree with experiment, it’s wrong.”
Fair enough. I’m a non-physicist, but even I think they were a bit sloppy in their characterizations of the ‘greenhouse effect’ and ‘back radiation’ in the above-referenced video. Nonetheless, I think they have something very important to say about the applicability of ‘consensus’ physics in the lower troposphere, and have tightened up their criticism of same in subsequent videos.
As for Feynman’s quote, we can all agree that the consensus theory (Schwarzschild) agrees well with experiment (satellite data) at TOA, but that doesn’t mean said theory holds at every level of the troposphere. And given that there is essentially zero evidence in the geological record that CO2 is the control knob of the Earth’s temperature, in addition to the many problems we observe in ‘climate modeling’, we should be very keen to investigate alternative mechanisms of thermal energy transfer in the lower troposphere.
Most of us know that our world will be a much poorer place if the worst impulses of the ‘alarmists’ are implemented. We should continue to review and debate their ‘science’ against plausible alternatives well before that happens.
Exactly ….. but it matters not to some.
Look lets rest this bollocks of Shula to rest !!
(But, of course those invested in it never will … until the next “theory” that demolishes the GHE comes along)
Tom Shula states that because the heat loss by radiation from a hot wire in a chamber with a surrounding gas is low that must be the case for the Earth transferring heat to outer space!
The radiation loss from the wire is given by:
𝜀𝜎(Twire^4-Twall^4)
With a constant to allow for the relative areas of the wire and wall, due to the radiation back from the wall the radiative loss by the wire can be very small.
This is why you can’t use the structure of the Pirani gauge as a model for the atmosphere.
He says …
“The input power required to maintain the temperature of the filament will depend on how much energy is being removed via conduction and convection by the gas. ”
No, just no, it also depends on the IR emitted back to filament from the wall.
Also he says:
“In summary, the Pirani gauge tells us the relative contributions to heat transport by radiation versus conduction/convection as a function of gas pressure for an object (the filament in this case) held at a constant temperature. Referring to the paragraph preceding the above image, this is exactly the measurement we are looking for”.
But you cant find it with this experiment ..
Thing is, the Earth’s “wall” is space!
And not whatever ambient temp the “wall” is at.
The “wall” needs to be cooled by liquid Helium to simulate the Earth’s radiative emission to space.
Collisions!
Any heat added to N2 and O2 sooner or later gets transferred to H20 or CO2 to be radiated to space. This also engenders atmospheric movement up and down and release of latent heat. It doesn’t get “trapped”.
I didn’t say it did !
That is a basic and also nit-picking.
Also, neither did Charles – to whom I was agreeing.
Anthony, you seem to believe that atmospheric mass plays no role in surface temperature. I beg to differ.
Any atmospheric gas molecules with 3 or more atoms are polyatomic. They all have potential vibrational modes. The homonuclear diatomics like O2 and N2 not so much, but its much more complicated. The vibrational modes of CO2 pass on to O2 and N2 through collision. The kinetic energy created causes local buoyancy in the atmosphere, and convection causes the kinetic air to rise more. There is no conservation of photons. In fact, the concept of photons leads people astray.
“Anthony, you seem to believe that atmospheric mass plays no role in surface temperature. I beg to differ.”
No, I don’t.
Obviously more molecules will lead to a greater surface pressure at the surface under gravity.
And then becomes part of the convective atmosphere.
All this is controlled by the gravity produced thermal/pressure gradient, which is unaffected by atmospheric CO2
Did you ever find that lapse rate formula that uses anything by H2O ?
The LR is formed via a “heat pump” mechanism, created via vertical motion in the atmosphere.
and conforms to -g/Cp
”Did you ever find that lapse rate formula that uses anything by H2O ?”
It’s called the SALR (saturated a diabetic lapse rate)
https://en.wikipedia.org/wiki/Lapse_rate
Yes, you don’t understand radiative heat transfer. The CO2 molecules don’t have to keep the hat. They rapidly transfer the energy to N2 and O2 molecules that they collide with, and vice versa. A CO2 molecule radiates, not because it absorbed, but because by chance it acquires enough energy from its neighbours.
Nick,
Yes, I beg to differ. In several of my reports I came to the conclusion that the extra warming of earth is coming from the seas and oceans.From the bottom up. Not from the top down.
e.g.
Surface Air Temperature (SAT) versus Sea Surface Temperature (SST) | Bread on the water
Henry:
This from your website: …
“DISCUSSION
The highest rate of warming is observed in the Arctic, above the 70 degree latitude. Strangely enough, the warming rate in Barrow (Alaska) of 0.83K/decade compares to a warming rate of only 0.20K/decade in Nome (Alaska) over the same period 1982-2017 (See sheet 10, footnote a). Nome lies just south of Barrow, at 65 degrees, also on the coast of Alaska. The only explanation I can find for these results is that the Arctic is or was strongly affected by underground volcanic eruptions, as reported in a previous study:”
Your “strangely enough” comment about Barrow.
It is not strange at all if you consider the sea-ice decline in the southern Beaufort Sea and the prevailing wind field for Barrow.
First the prevaining wind is fromthe E to NE…..
Which is directly from off the S Beaufort Sea…. where sea ice has declined most ….
“Fig. 3. (a) Linear SST trend (°C/yr) for August of each year from 1982 to 2022. The trend is only shown for values that are statistically significant at the 95% confidence interval; the region is shaded gray otherwise. White shading is the August 2022 mean sea ice extent, and the yellow line indicates the median ice edge for August 1991-2020, (b,c,d) Area-averaged SST anomalies (°C) for August of each year (1982-2022) relative to the 1991-2020 August mean for (b) the entire Arctic Ocean north of 65° N (indicated by the dashed white circle in (a)), (c) the Chukchi Sea, and (d) the Northern and Southern Barents Sea indicated by smaller blue boxes (intersecting with land boundaries) in (a). The dotted lines show the linear SST anomaly trends over the period shown and trends in °C/yr (with 95% confidence intervals) are indicated on the plots. See Methods and data for source information.”
You can see from that, that SST’s there have risen by ~ 3C, mostly over the last 24 years.
This is why Barrow has a 0.83 C/dec warming anomaly.
For Nome:
It has prevailing winds from …
“Wind roses showing climatological distributions of wind at Anchorage over the 1980-2014 historical period. A wind rose is shown for each calendar month: January (upper left) through December (bottom right). Spokes point in directions from which wind is blowing; yellow and red shades denote higher speeds. Station wind observations were obtained from Iowa Environmental Mesonet”
Note for 6 months of the year (mostly summer) prevailing winds are from the SSE – Off the Bering Sea.
And SSTs in the E Bering sea have evolved thus :
“Observed annual SST for the eastern Bering Sea (from ERSSTv5), 1854-2022 Blue trend line is LOESS fit to the data”.
Showing a rise of ~ 1C from 1982.
And that is why temps at Nome have only risen by 0.2 C/dec.
In short, is imperative to examine the track of the prevailing wind at a location to determine reasons for temperature trends.
Sea tracks are normally cooler than land-tracks (due 4x higher Specific heat).
However along the Alaskan coast sea-ice behavior becomes a large factor … as we can see for Barrow.
So conclusion:
“The only explanation I can find for these results is that the Arctic is or was strongly affected by underground volcanic eruptions, as reported in a previous study:”
Is bonkers.
See my comment to Richard Green below
You haven’t considered the most basic meteorological process that gives a point on Earth’s surface it’s ambient temperature Henry.
You have to start with that and then move on to other possible reasons.
There aren’t any.
As shown in my post.
It is becasue the prevailing wind at Barrow has warmed more than that at Nome.
Because Barrow’s ENEly winds used to flow over more fast sea-ice and now it doesn’t.
It is blowing over more open waters that are above zero C.
Not the case for Nome.
Henry, Thank you, interesting, I commented at the link. I agree and I account volcanic super plumes as a major contributor to El Nino events.
Do you have a report or link on that?
There are zero data on the quantity of underseas heat releases and the trend of those releases over time. Therefore, your theory MUST be data free BS.
Richard
I will call your BS and double up on being able to prove that the warming in the arctic circle is coming or came from volcanic action underneath the waters
https://www.livescience.com/4992-volcanoes-erupt-beneath-arctic-ice.htm
https://agupubs.onlinelibrary.wiley.com/doi/10.1002/grl.50775
e.g. it says
In the last three decades…….. the temperature and salinity in the deep Greenland Sea have increased at unprecedented average speeds, and these trends are among the highest in the global deep ocean.’
Your first link is dead. The second says nothing about volcanoes.
That is strange. Why did that link die? Just like many links that prove that AGW is a lie…..
I kept a quote somewhere. I will look it up.
New evidence deep beneath the Arctic ice suggests a series of underwater volcanoes have erupted in violent explosions in the past decade.
Hidden 2.5 miles (4,000 meters) beneath the Arctic surface, the volcanoes are up to a mile (2,000 meters) in diameter and a few hundred yards tall. They formed along the Gakkel Ridge, a lengthy crack in the ocean crust where two rocky plates are spreading apart, pulling new melted rock to the surface.
(report from 2008)
How much of this energy is lost? There is no such thing as a loss less transfer.
“There is no such thing as a loss less transfer.”
At a molecular scale, there is. For where can the energy go? If not radiated, it can only go into kinetic, rotational or vibrational energy. Which then gets exchanged again.
A CO2 molecules absorbs in the lower atmosphere, but almost never gets a chance to radiate.
Energy is themalised to the other 99.96% of the atmosphere and becomes part of the air-movement/convective cooling controlled by the gravity thermal gradient.
It only gets that chance in the upper atmosphere., where it radiates mostly to space.
The “neighbors” are at the same energy state how can there be flow?
Energy levels vary randomly according to Maxwell-Boltzmann statistics. When a GHG molecule randomly reaches a high enough level, it emits.
Henry wrote, “The 1 in 10000 molecules of CO2 that were added to the atmosphere have no mass to keep much heat“
As Nick and Anthony said, mass has nothing to do with it.
At the most basic level, GHGs are colorants. They tint the atmosphere, though in the far infrared, where the Earth emits strongly, rather than in the visible part of the spectrum. That causes the air to absorb radiation which otherwise would have passed through the atmosphere and escaped to space. Absorbing that radiation warms the air. (That’s very simplified.)
Henry, it sounds like you might have been reading Lightfoot & Ratzer. That’s a mistake, because they’re badly confused:
https://doi.org/10.5281/zenodo.14248969
(Also, a nit: the anthropogenic increase from 280 ppmv to 425 ppmv added 1.45 molecules of CO2 per 10,000 molecules of atmosphere, not “1 in 10000”.)
Let us talk about from 1965 when official records of CO2 started and nobody had heard about global warming. In fact it was cooling in those days and we were all afraid that a new ice age was coming. As it stands, the current interglacial is already longer than the previous one.
In that case we can stick with the 1 molecule in 10000 that was added.
I have noted that most alarmists only talk about LW that is being hold back and never about the SW that is radiated back to the sun and space by the CO2. What is your say on that?
re: “from 1965 when official records of CO2 started”
There’re no “official” records of CO2, but highly accurate measurements began at Mauna Loa in 1958. It was 316 ppmv in 1958.
re: “…about the SW that is radiated back to the sun and space by the CO2. What is your say on that?”
CO2 is transparent to SW (visible and near infrared) radiation.
Dave says:
CO2 is transparent to SW (visible and near infrared) radiation.
Nope. See
Read my report: 😊😊An evaluation of the greenhouse effect by carbon dioxide | Bread on the water
In fact, just so you know, there is even some absorption of CO2 in the UV which is why we can measure it qualitatively and quantitatively on other planets.
Minor correction: it was 316 ppmv in 1959, not 1958.
https://sealevel.info/co2.html
GHG absorb radiation but then through collision pass the energy on to other gas molecules (predominantly non GHG molecules) almost immediately – at lower altitudes. Most radiation from the earth does not excite GHG molecules and passes straight to space. The radiation absorbed by GHGs can only escape near top of atmosphere where the MFP is long enough. As GHGs increase the altitude where the MFP is long enough increases. This will be colder and hence less radiation will be transmitted to space. CO2 saturation is not possible.
Nope. See my comment to Dave.
ghalf, Help me quantify the difference in heat retention from a longer MFP. I’m about as far as someone can be from being a climate scientist so my hypothetical may be ridiculous. Please explain my errors
Difference in Heat Retention
Summary
1 km increase in MFP = 1% increase in heat retention. Do you consider this an existential climate catastrophe like the IPCC wants us to believe?
I don’t understand your .99, but you must adjust for the increased area at each height.
Copilot The percentage drop used in the example—0.5% for 500 meters and 1% for 1 kilometer—was an assumption to illustrate how small changes in altitude could affect the cooling rate and heat retention.
Not true. Radiation from GHGs escapes to space from all altitudes and at a constant rate independent of concentration (for well mixed GHGs).
While the MFP decreases, you get more energy emitted (Kirchhoff’s Law of Radiation). The combination of these two effects cancel out.
Hum, I hadn’t heard that before, “Radiation from GHGs escapes to space from all altitudes”. You mean all altitudes in the MFP at TOA , right?
Nope, I mean all altitudes starting right above the surface. CO2 does not work like shining a light into a fog. CO2 molecules emit more IR at every altitude. If you look at just two layers it becomes clear the higher, less dense layer cannot even absorb all the IR coming from the layer below it. This applies all the way to space.
While it’s true some of that IR will get absorbed at even higher layers, that reduces the amount of IR that layer can absorb from the layer immediately below it. Easier to just think all that energy makes its way to space.
This is a big reason why it gets colder as you go higher. It wouldn’t get colder is no energy was lost.
The error most people make is to think there’s a fixed energy source. In fact, as CO2 increases the amount of energy radiating upward also increases.
“As GHGs increase”
Meaning more molecules radiating at a lower rate for each individual molecule. Does the increase in molecules equate to compensating for the lower rate of radiation? This point always seems to get ignored.
ghalf, I thought I commented earlier about your, “ As GHGs increase the altitude where the MFP is long enough increases. This will be colder and hence less radiation will be transmitted to space. CO2 saturation is not possible”. I don’t see it, so here goes again.
I’ve heard that same statement for many years, so today I gave Copillot a scenario to attempt to quantify the MFP length increase and a corresponding change in ATM heat retention.
Summary
1 km increase in MFP = 1% increase in heat retention. Do you consider this an existential climate catastrophe like the IPCC wants us to believe?
Hypothetical Scenario
Heat Retention Calculation
Heat retention in the atmosphere depends on the balance between incoming solar radiation and outgoing longwave radiation. An increase in MFP affects the efficiency of radiative cooling.
Difference in Heat Retention
You don’t understand convection.
You don’t understand convective stability.
I do and and I agree with Nick.
Bingo. All climate alarmists live in denial of the effects of enhanced convection. They then try to claim it adds to the warming.
Its quite funny to watch them denying how energy moves in the atmosphere, and what actually controls that movement..
ie pressure and temperature gradients.
Yes, I agree when it comes from someone as unqualified and befuddled as you.
You never did tell what qualifications you have as regards climate science.
Did you?
And neither do you! Instead of dealing with averages, why don’t you show us a gradient formula of CO2 radiation as a function of altitude. Like it or not, the amount of radiation as you rise in the atmosphere grows less and less. Some is absorbed by CO2 below, which is radiating more upward than that arriving from above, so it disappears. Some is absorbed by water vapor and disappears as a temperature due to latent heat.
I know you have not studied Planck’s book on heat radiation (Theory of Heat Radiation) because you would know some of the this. He even studied gases along with solids.
Somehow you think your ad hominem means something. Perhaps you should look at Drs. Happer and van Wijngaarden credentials and ask yourself, “do I know more than them”. Your logic would say that you don’t have the credentials to contradict them.
I hav e said nothing against H&W. I think their paper is OK. It have just quoted from it to show what they really said.
This is a good point. The OP claimed the saturation effect somehow trumps climate modeling efforts. That’s false because the models include the saturation effect. W&H got the same answer as the modelers use. I don’t agree with Nick on some points, but on this issue he is correct.
The vast majority of skeptics also don’t understand your point. Energy is lost at all altitudes and it ends up in space. I’m sure Nick thinks the enhanced greenhouse effect is real as well.
To me your words are now obvious, but it wasn’t at one time. It takes some deep thinking to completely understand radiation flow in the atmosphere. It’s anything but obvious until you have a couple of “aha” moments.
The Beer–Bouguer–Lambert (BBL) extinction law is an empirical relationship describing the attenuation in intensity of a radiation beam passing through a macroscopically homogenous medium with which it interacts. Formally, it states that the intensity of radiation decays exponentially in the absorbance of the medium.
In other words, diminishing effect as the concentration increases.
It’s in the equation.
Yes. it is a pity that the word extinction (that we used originally to describe this phenomenon) somehow was changed with the word ‘absorption’ as it creates another impression. I have explained this in my report:
An evaluation of the greenhouse effect by carbon dioxide | Bread on the water
Henry:
Do you agree that the oceans heat the atmosphere?
And that any land station that lies on a coast and has a prevailing wind from off that ocean has it’s temperature necessarily modulated by that basic fact?
That is what I show in my lengthy post to you (of course you will defend your position, as you have obviously invested much time/effort into it)
But I’m sorry, it ignores a very basic (the most) method of heat transfer within the climate system.
My analysis shows that the DeltaT’s of Barrow and Nome are driven by the predominant prevailing sea-tracks of their respective climates.
In the case of Barrow it has warmed by 3C (due the decline of sea-ice).
In the case of Nome by the SST warming by ~ 1C.
Meteorologically that is unequivocal.
I gave a reply to Richard Green showing that there have been underseas volcanic eruptions in the arctic, forcing much heat and salinity in the Greenland sea between Norway and Groenland, down to the Baltic.
@Anthony
You must give me an explanation of the results in Table 1 : Mondiale opwarming? Hoe en waar? – Climategate Klimaat
No I shouldn’t.
The answer to your questions lies in a basic (the most basic indeed) meteorological process in determining the ambient temperature of a location on Earth.
It was within the calculation required for many Met processes that I had to determine as an on-the-bench UKMO forcaster.
It is over what terrain has the prevailing airmass travelled !
Bad Luck,
For you, I mean…
You agree that the heat that warms the atmosphere comes fron the 70% water on earth and you don’t see the uneven distribution of that heat going +90 to -90 degrees latitude?
Oh, for god’s,sake.
Please read and understand my analysis.
Unless you wish to remain wedded to your bonkers theory.
Silly statement by me !
Of course you do.
But won’t get anywhere other than contrarian blogs however.
Well, the big inhomogeeity in the atmosphere is temperature (and density). But Beer’s law assumes no emission. The proper form here is Schwarzschild’s equation for radiative transfer
in which the term for emission is added to the Beer Law absorption.
From your link: “you may calculate the intensity of any flux of electromagnetic energy after passage through a non-scattering medium when all variables are fixed, provided we know the temperature, pressure, and composition of the medium.”
Doesn’t sound like our atmosphere. Should we really be disrupting our energy security based upon an hypothesis so full of uncertainties?
That’s like saying you can’t figure out the mass of the atmosphere because its density varies. Of course you can, if you know what you are doing.
Calculating the mass is not easy. The density is a continuous function. You can’t use average values. More importantly, the pressure and temperature components from the ideal gas law are not constant. Gravity does change over the Earth’s surface.
Does that mean that averages won’t give an answer that is close enough for government work? Maybe. But as you drill down into how all the components are related, averages won’t suffice.
Keep in mind that law assumes a fixed energy source. That’s not the case with our atmosphere. Initially, there’s multiple fixed beams associated with different spectral regions and absorbing gases. There’s also energy conduction and latent heat and a little solar energy absorbed into the atmosphere.
All this bulk energy is essentially the source for beam. As a result, when you increase concentration you not only reduce intensity but you also increase intensity by utilizing more of the energy available in the bulk atmosphere.
If you understand radiative heat transfer, Nick, please tell us what the emissivity of CO2 is at atmospheric pressures and temperatures.
Again, you just don’t understand this stuff, including the diagram you have been hawking. Gases do not have an emissivity. Gas layers do, but it depends on their thickness. Hottel’s diagram gives the emissivity of a 1cm layer of gas at the indicated partial pressure.
The actual values are not all that important. The key point is that as temperature and quantity of a radiating gas goes down, so does the emissivity.
It seems it is you that doesn’t understand heat transfer of any sort..
You need to watch this video
And neither does Shula …
Tom Shula states that because the heat loss by radiation from a hot wire in a chamber with a surrounding is low that must be the case for the Earth transferring heat to outer space!
The radiation loss from the wire is given by:
𝜀𝜎(Twire^4-Twall^4)
With a constant to allow for the relative areas of the wire and wall, due to the radiation back from the wall the radiative loss by the wire can be very small.
This is why you can’t use the structure of the Pirani gauge as a model for the atmosphere.
He says …
“The input power required to maintain the temperature of the filament will depend on how much energy is being removed via conduction and convection by the gas. ”
No, it also depends on the IR emitted back to filament by the wall.
In summary, the Pirani gauge tells us the relative contributions to heat transport by radiation versus conduction/convection as a function of gas pressure for an object (the filament in this case) held at a constant temperature. Referring to the paragraph preceding the above image, this is exactly the measurement we are looking for.
But you cant find it with this experiment ..
Thing is the Earth’s “wall” is space!
And not whatever ambient temp the “wall” is at.
The “wall” needs to be cooled by liquid Helium to simulate the Earth’s radiative emission to space.
“Of course it won’t in a lab experiment, with a path length of a few metres.”
Tyndall’s experiment was conducted in a brass tube about 1M long with salt crystal ‘windows’ in either end. How representative is that of planetary atmosphere?
https://www.rigb.org/explore-science/explore/collection/john-tyndalls-radiant-heat-apparatus#:~:text=In%201859%2C%20discovered%20the%20Greenhouse,of%20gases%20in%20the%20atmosphere.
He never said it was. In fact, it was as near to 100% CO2 as he could get.
Tyndall discovered that CO2 (and H2) were “conductors of radiant heat”.
And did not establish the Beer-Lambert relation of path-length.
He was (obviously) not able to do that in a lab.
https://earthobservatory.nasa.gov/features/Tyndall#:~:text=Tyndall's%20experiments%20also%20showed%20that,warmer%20than%20its%20surrounding%20areas.
A longer path length upwards also includes a longer path length downwards. That means radiation from a higher altitude will be reabsorbed by CO2 before it reaches the surface. In essence, it is feedback that self-limits the amount of total radiation that can be absorbed by CO2.
If one does a lapse rate analysis, about every 50 feet, the temperature drops 0.1°C. Since cold cannot warm hotter, that colder layer cannot warm the layer below it. Consequently, less and less radiation is available toward the surface from CO2 in the atmosphere.
The atmosphere path length varies with altitude. I guess you never heard of gravity and the density change it forces.
We actually know that the surface flux is absorbed within less than 10 meters. This would also be true of any reradiation low in the atmosphere. It would only reach km values up in the stratosphere or higher. Hence, we should be able to measure this in a laboratory. Not really necessary though since radiation models also make this clear.
“The atmosphere path length varies with altitude. I guess you never heard of gravity and the density change it forces.”
It varies with the height of the 255K (-18C) isotherm.
Obviously that varies depending on the airmass.
But the inhomogeneity doesn’t matter, as it will average out.
“But the atmosphere path length is many kilometres.”
WRONG
Heinz Hug calculated the attenuation of the 15 micrometer CO2 band to be 99.94% over 10 meters at ~380 ppmv
CO2 laser scientists know the path length in the lower atmosphere is in the 10m range.
So you are saying that precious little LWIR never gets beyond 10m above the surface ?
Really?
You really have no conception how to join things up.
If that were the case then the world would be a roiling mass of convection.
It would be a massive creation of instability.
Just think about the consequences of the radiative emission from the surface being mostly thermalised in that lowest layer.
It is a physical impossibility as observation shows.
Additionally, if 15 micron IR were to not get beyond the near surface than how come that satellite obs show otherwise?
The Earth in that case could only cool via the atmospheric window.
Also what about WV that absorbs/emits in the 15 micron range ? – so another massive impediment to planetary cooling..
You just say stuff for the sake of it.
No, he is saying 10m is the highest surface emitted LWIR reaches due to saturation. Fact is, that HITRAN computation was done 30 years ago and CO2 is now 50 ppm higher. It’s even lower now.
Of course, CO2 molecules in the atmosphere also emit LWIR. This does create an upward flux of energy which eventually reaches space. This is the source of energy for the claimed “enhanced greenhouse effect” which I have shown to be incorrect.
Winters here in Milwaukee are warmer than they were in the ’60s & ’70s. You don’t need a thermometer or The New York Times to know that. Is that due to an increase in CO2 or some other factors? In any case, it isn’t a problem.
The increase is due to super El Niños. Nothing else!!!
And UHI.
Which does not and cannot show up in the UAH TLT product.
If it did we really would be in trouble.
Try to work out how much energy is required fom the putative “UHI” effect to heat the whole atmosphere by approaching 1.5C (hint: it is the equivalent of 3W/m-2 across the Earth’s surface (5.1×10^14 m^2).
Dr. Roy Spencer of UAH fame has some information about that. See: Urban Heat Island Effects on U.S. Temperature Trends, 1973-2020: USHCN vs. Hourly Weather Stations « Roy Spencer, PhD
Maybe you have the credentials to refute Dr. Spencer’s work, or maybe not. Let us know which.
Try to understand what I am saying please (and Roy too).
The UAH TLT product is an average of several vertical km of atmosphere.
That whole volume of atmosphere must necessarily contain the extra energy that any UHI effect would create (it doesn’t) IF it were to reflect the excess heat of any UHI.
Roy is referring to :
“Use of the hourly station data provides a mostly USHCN-independent measure of the U.S. warming trend, without the need for uncertain time-of-observation adjustments. The resulting 311-station average U.S. trend (1973-2020), after removal of the UHI-related spurios trend component, is about +0.13 deg. C/decade, which is only 50%Â the USHCN trend of +0.26 C/decade.”
That is USHCN and not his UAH TLT v6.1
(by the way USCRN over the last 20 years shows that his UHI contamination of USHCN not to be the case for the US)
In other words he is talking of the heat produced (UHI) at the surface (a 2D plane) and not vertically integrated over 3D
That is why it is physically impossible (by 13 orders of magitude (see below) for UHI to be warming the UAH TLT product.
Oh, and … “Maybe you have the credentials to refute Dr. Spencer’s work, or maybe not. Let us know which.”
No I’m not more qualified …, but i do know meteorology at least as well as Roy and that is enough to know that to imagine that Urban UHI can warm his TLT product to the degree seen is bonkers (by 13 orders of magnitude )
There I’ve let you know ….
See below.
Now how does heat created on a 2D plane (the surface) manage to spread out into a 3D volume of great extent and still exhibit the same temp anomaly as at the surface??
A physical impossibility.
And why I said work out the energy imput required to do that by taking the current GHG forcing of ~ 3 W/m^2 and x the area of Earth’s surface (though strictly it should be 29% of that (sea = 71%)
Earth’s surface area is equal to 5.1 x 10^14 square meters.
29% of that = 1.76×10^14 m^2
The % of landmass covered by urban areas is estimated to be 2%
Therefore 2% of ~1.8×10^14 m^2 = 3.6×10^12m^2 @ur momisugly 3/W/m^2 (extra RF forcing due to GHE)
Must produce ~= 10.8 x10^12 W/m^2
So that area of Earth’s surface would need to produce 5×10^14m^2 x 10.8 x10^12 W/m^2 (10.8TW for each m^2)
= 54 x10^26W in order to be comparible with 3W/m^2 over 5×10^14m^2 plane surface.
The 2021 world total energy production was about 19.6 TW of power generation.
Say 50% is exhausted as waste heat ~=10 TW = 10^13W
Humans then emit 10^13 W of heat vs 25×10^26 W needed to = that provided by the extra GHE forcing up to date.
That is 13 orders of magnitude more than what human waste heat can provide !!!
Yes, I do know that that calc does not factor in absorbed solar on dark surfaces … but it does show the magnitude required.
Oh, and another (very important thing).
90%+ of excess TSI is entering the oceans.
So not everything, like H2O, radiates based upon its temperature? Can you show how you arrived at that conclusion, I would be interested in seeing that. Remember, evaporation is not the only way the oceans cool.
No kidding, farms and forests replaced with blacktop, asphalt and concrete.
Yes no kidding
What UHI is warming the oceans?
What warming of the oceans?
They claimed warming amounts to only about 0.003C, which is so far below the resolution of the sensors being used that it simply does not exist.
No, you need to look at OHC …
NB: the Y-axis is in 10^22J
Could it be related to CO2 released by beer production? Or not?
b
Well Bill, we get plenty of methane from beer consumption, so maybe that compensates in some small way for beer production’s piss-poor performance at CO2 production?
“Is that due to an increase in CO2” NO
“or some other factors?” YES
Air conditioning, The Urban Heat Island effect & Better clothing, plus cyclical weather.
It was in the early 1980s, that I realised that the climate had become warmer, when the canal no longer froze over, like it did just five years previously. Somehow, I don’t see CO2 increase, warming the climate so quickly and significantly.
More CO2 surely caused some of the warming. Air pollution abatement also contributed.
But another reason is the anomalous starting point for the comparison. The 1960s and 1970s were a worrisomely cold period.
https://sealevel.info/newsweek_old.htm
It is impossible to reconcile this observation with the CO2 Warming hypothesis.
It is possible if you remember that the contribution from CO2 is much smaller than the contributions from other factors.
Now it is impossible to reconcile this observation with the claim that CO2 is the master control knob for the climate.
It is still impossible
“It is impossible to reconcile this observation with the CO2 Warming hypothesis.”
Which is why they had to be changed.. and we now have GISS et all.
No it’s not if you consider all climate forcings at the time …
In the 30’s/40’s CO2 RF was only barely 1W/m2 and now it’s ~ 3/W/m2.
The reason was the -ve RF offset of aerosols.
As a result NV had prominence and that was provided by warm PDO and AMOs.
After that they went cool and the ramp-up of aerosols post WW2 dampened forcing further until the clean air acts came in and anthro GHE was able to break free.
IE: a multi-variate analysis is required and not to presume it was all CO2 what dun it or didn’t dun it.
I would love to know how they know what the forcings were prior to the satellite era.
Solar from Be^10 in ice cores.
Aerosol load from Ice cores
Yes, they have been slightly warmer in agreement with the AMO. Since the AMO is due to revert back into its cool phase within a few years, those colder winters are likely to return.
No its not; it is as irrelevent as all the other BS about CO2 changing Earth’s energy balance.
Happer’s more recent discovery of ice in the sky (clouds) having profound influence on the radiation balance is far more important than any CO2 saturation.
https://iowaclimate.org/2025/01/13/happer-cloud-radiation-matters-co2-not-so-much-2025/
CO2 has negligible impact on the energy balance on Earth. Ice dominates by orders of magnitude over CO2, 10 times or more over water vapour and a factor of two or three over water condensate.
You cannot understand climate drivers unless you understand ice in the atmosphere, ice on land and ice on the water.
Trump is right – CO2 induced Climate Change™is a scam. He should task the resources of Space X to challenge the BS that comes out of NASA GISS and their naive, cloud parameterised models.
It is worth noting that Happer still has a lot to learn. A pyrgeometer does not measure radiation. He gets it partly right that it is cooling but It measures a rate of cooling for a narrow range of frequencies that is used to infer a radiation value based on calibration to the S-B relationship. Radiation cannot go against the electric field which is always present between objects in the same way as gravity is always present.
RickWill wrote, “Happer still has a lot to learn.”
I’m sure he would agree with that. After all, he’s only revolutionized two scientific fields, so far.
Rick wrote, “A pyrgeometer does not measure radiation.“
Huh? A pyrgeometer does measure radiation. Do you mean that it doesn’t measure the wavelengths of radiation?
Rick wrote, “Radiation cannot go against the electric field which is always present between objects in the same way as gravity is always present.”
Huh? Sorry, that’s gibberish.
Have a look at how pyrgemoters are calibrated. They IMPLY back radiation by being calibration to the S-B equation. They do not measure energy. It is impled energy and it is nonsense. There is no physical equivalence for separating the temperature terms inside the brackets of the S-B equation.
Pyranometers measure radiation energy. They do not need any calibration to the S-B equation.
Then read this paper to get some appreciation of your misconceptions on how EMR transfers energy:
The word “radiation” is shorthand for electro-magnetic radiation. It exists by virtue of the electro-magnetic field between objects.
Photons are electrically neutral, they aren’t influenced by electric fields.
EMR only exists in the electro-magnetic field. Photons are discrete quanta of EMR.
Pyrgeometer readings generally have a big dip in region of the CO2 15um band…
… showing that CO2 actually REDUCES downward radiation. 🙂
That’s wrong. CO2 very strikingly INCREASES downwelling LW IR at 15µm.
Here’s is an example of “the downwelling radiance recorded by a ground station in Reno over one day with strongly varying cloud coverage”:
Source: https://sealevel.info/Harde2013_IJAS-503727.pdf#page=25
The intense downwelling IR near 667 cm⁻¹ (15±0.8 µm) is mostly from CO2. (As CO2 levels rise, the intensity of that downwelling IR from CO2 is increasing, albeit just enough to be barely measurable in clear sky conditions.)
From about 750 to 1300 cm⁻¹ (or convert wavenumbers to wavelengths, if you prefer), the intensity of the downwelling IR varies greatly depending on the cloud cover. When there’s cloud cover (black trace) there’s a lot more downwelling IR, compared to clear sky conditions (green trace).
That’s why on clear nights the temperature outdoors drops much faster than it does on cloudy nights, even when temperatures remain above the dew point. The surface absorbs downwelling radiation, and that energy uptake partially offsets the energy lost as the surface cools.
There are two variables in this situation: atmopheric carbon dioxide; and incoming EMR of the frequency absorbed by carbon dioxide to cause warming.
When carbon dioxide levels are limiting, temperature increase is proprtional to increases in carbon dioxide levels. As the situation shifts toward incoming EMR levels (which are relatively constant) becoming limiting, then incremental warming trends toward zero.
This is a classic asymptotic curve found ubiquitously in the natural world, not least in enzyme kinetics.
Science is irrelevant as the U.N are fixed on their destruction of Western economies, their influence on our politicians will remain and continue the observable decline in so many Western country’s economies.
Control and make energy very expensive shackles the economy making that country far less competitive. U.K. has been badly affected and Germany even more.
All on the trojan horse that is CO2!
That is once again countering bad science with worse science.
Not true! As anyone can easily look up, the consensus forcing is F = 5.35 * ln(C1/C0). For a doubling of CO2 you would thus yield F = 5.35 * ln (560/280) = 3.71W/m2, and that is for any doubling. These are not “linear” increases in forcing, but logarithmically declining ones.
Both Harde & Schnell and Reinhardt did it fundamentally wrong, their claims are pointless. Happer & Wijngaarden name a 3W/m2 forcing (for doubling) TOA. That is true, as anyone can easily check for himself with modtran. The problem is, they did neither consider clouds (reducing that figure to ~2.15W/m2), nor what “consensus science” actually claims, because that is a totally different story, and one that needs to be discussed.
Myrrhe, Stordal 1997 for instance provide some insights on what the consensus claim is. CO2 forcing would be the sum of “fluxes” at the tropopause, that is how much less radiation is “upwelling” plus how much more radiation is “downwelling” from the stratosphere above. These two “fluxes” would then add up to about 3.7W/m2.
This position is, to say at least, quite “creative” and highly questionable. Not just that, it is also inconsistent with CO2 forcing for natural CO2 levels, which are indeed just based on the TOA approach. So we have an amazing inconstistency within consensus science, producing a CO2 forcing “hockey stick”..
And that is the discussion we should be having, instead of some unsubstantiated claims.
https://greenhousedefect.com/unboxing-the-black-box
Why is Nick Stokes always in there early trying to defend the indefensible? He appears to want to deflect proper discussion with his nonsense.
He has nothing else to hang his hat on … imagine his ‘reputation’ and whole life’s work hung on the wrong hatstand?
That comment is typical of this rabbit-hole of a forum.
The acceped science most certainly is not “nothing else to hang his hat on”.
When countering the many ignorant and specious alternate *theories* posted on here … often described as “game-changing”.
….rabbit-hole of a forum….
Maybe go somewhere else?
These are just people, citizens and voters, and what they see is harm being inflicted on them and their societies by people attempting to do impossible and silly things which will have no effect on a supposed (and in their view imaginary) problem.
The amount of money and resources being devoted to the attempt to lower CO2 emissions in Western countries makes this an important policy and political topic. They cannot responsibly not think about it, just roll over and let it happen. The UK, as an example, is probably spending far more than it would take to have an adequate health service, instead of the current scandal prone one with millions on the waiting list. And yet the political consensus is to spend the resources which would remedy that on wind subsidies, idiotic attempts at carbon capture, the whole net-zero-in-generation project..
Faced with what seems to them like complete idiocy in the UK and other countries, they are trying to understand the rationale, starting with the CO2 – global heating argument. And it makes no sense to them. Neither does the energy policy that is being argued to follow from it. Sometimes, as in the present head post, they just make basic misunderstandings. Other times they get things spot on right.
But don’t ridicule them for taking seriously one of the largest policy decisions of any of our lives. In the UK as a for instance, energy policy is liable to play a key role at the next election. It already probably has played some role in the US elections. This is how politics works in representative democracies. Its not clean, its very messy, but its merit is to be less bad than any of the alternatives that have been tried.
I would add that climate activists have made the first and most basic mistake radicals can make. They have proposed and are implementing policies to remedy the ills they are organizing around. The problem is, this draws attention away from the ills to the merits of the remedies, in this case net zero. And that is fatal, because its politics as usual.
Its the energy policies and their pending failure that will sink climate hysteria. I would give it another few years, but once they started implementing the great move to wind solar EVs and heat pumps, they were doomed. Its just a question of when.
Well-stated, michel.
Well said michel.
Accepted science is by definition an anti-scientific attitude.
If that’s all you have to hang your hat on, then don’t look now, but your hat is on the floor.
[cut it out~ctm]
Bless, can’t you do better than that in the ad hom conversion of my surname Mike.
NB: I don’t, especially since Charles put his foot firmly down on bnice2000.
Cobblers.
Accepted science is just the consensus of where it is at at the moment.
Which is all we can know and act on.
If we wait until we are certain…
1) we can never be 100% certain
2) It will be too late to act, if necessary.
You know, just like people are sent to the gas-chamber on evidence that is just “beyond reasonable doubt”.
That is the deffo the case for anthro-caused GHG warming.
No matter how much peeps here cry fowl.
The so-called “accepted” science is built on quicksand and clueless erroneous models and simulations….
That is what you and Nick try to support…
And it it is collapsing…. Can’t even support Nick’s hat. !
“That is what you and Nick try to support…”
And it’s extremely easy to bnice.
Thanks all the same.
Here is an echo-chamber of anything that peeps think can possibly deny the GHE of anthro GHGs.
Doesn’t matter what.
Whatever is the flavour of the day.
Propounded by some aging scientist or outlier contrarian
“citizen scientist” such as the Connolly family (quals in Chemistry).
And of course they are reflexively deemed to be correct (by many).
Whereas I, Nick, AlanJ and a few other brave souls follow what the scientific field of Climate has built on since the middle of the previous century.
If it were wrong someone or other would have noticed.
And the satellites too.
Here we go again… what does the ”accepted science” mean to you? Believing in Mann’s hokey stick? Lol.
I certainly do.
As it has been replicated by different proxies many times since.
Mann is merely the doll you like to stick pins into.
As he is hated for being the first to reveal that the MWP and the LIA were not globally synchronous.
Why shouldn’t he.
And no it is, not indefensible.
It is the current accepted science, and that you and someothers don’t acept it with similar accepted science (other than by *contrarians* – does not a valid argumant make).
BTW: He lives in OZ and so articles posted overnight in the US are often seen by him first.
Yes, this one appeared at 5pm here, when from UK to Cal were asleep.
“It is the current accepted science”
That doesn’t make it correct !!
In a few years, there will be a different “current accepted science”.
Flat Earth, Earth-centric, Fixed continents, and Thalidomide, are a few examples of “the current accepted science”
Some people are ahead of the curve & some are behind; sadly, you & Nick are behind.
The tipping point of CO2’s demise as the control knob for climates will be when “Big Science” declares that CO2 is “SAFE and EFFECTIVE”.
Then we will all know for sure & certain that the claims about CO2’s magic molecule capabilities are total bullshit.
The tipping point for the CO2 Hypothesis is tomorrow, when DJT will be inaugurated as 47th POTUS. With the US withdrawing its support, the big money will dry up, and that will be the end of the biggest scam of al time.
There was no tipping point in 2020. Remember that 95% of federal workers cannot be fired by the president.
Also, most of the grants are years long and can’t be halted once awarded.
Trump can slow the rush, but it will take 3 or 4 conservative presidents in a row, plush control of the House and Senate for the same period.
A final point is that there needs to be a fillibuster proof majority in the Senate in order to “control” it.
Sounds nice but won’t happen that fast. Marxism was shown as a flawed, failed, and ultimately deadly system yet half the pols still cling to it 30+ years after the collapse of the USSR. These people have billions of dollars/euros/whatever and decades long careers tied up and invested in Climate Change!™. They’re not going quietly.
Hear! Hear! I’ve been listening to this CO2 as the demon molecule for more than 20 years. The Donald will set the stage for climate scientists to state what they’ve known all along but didn’t dare admit to at risk of losing advancement opportunities or loss of employment. CO2 was most likely not the climate control knob ever, and it absolutely positively is not at >400 ppm ATM. The real deniers are those who continue to insist otherwise. Climate may be complicated, but this little sliver of it is not.
“And no it is, not indefensible.”
Yet he, and you, seem incapable of defending it.
All you have is highly dubious models and propaganda.
No you are incapable of understanding it.
In fact, it seems, you refuse to even try.
Maybe we should start with the premise that the planet would be at -18ºC without GHGs. How plausible is that? Dr Markus Ott explains ‘greenhouse’ theory, why it is garbage and presents a more logical explanation of the planet’s temperature:
https://www.youtube.com/watch?v=Bj6ORbRBZ2s
https://www.youtube.com/watch?v=JXKHfL55G2A
https://tomn.substack.com/api/v1/file/71a8adc6-7aa4-42e4-88eb-caa6d0f04057.pdf
I suspect that the oft cited 255K (= –18.15ºC) figure is probably too low.
With an IR transparent atmosphere and uniform temperatures:
E = ε⋅σ⋅T⁴
so T = ∜(E / (ε⋅σ))
where:
ε is emissivity, avg ≈ 0.95 (not far from a black body)
σ is the Stefan-Boltzman constant = 5.670374419e-8 W/m²K⁴
T is temp in Kelvin
E = radiative emissions, which needs to balance absorbed incoming solar.
Incoming solar ≈ 340.5 W/m², but not all of it is absorbed. With clouds, about 30% is reflected away. But if there were no water vapor there’d be no clouds, so only about 15% would be reflected away.
85% of 340.5 = 289.425 W/m²
T = ∜(E / (ε⋅σ))
= (289.425 / (0.95×5.670374419e-8))^0.25
= 270.74K = -2.41°C
That’s the effective emission temperature of the Earth’s surface with an IR-transparent atmosphere.
(15°C = 288.15K) – 271.74K = only about 16.4°C
However, that’s assuming uniform temperatures. Earth’s temperature is far from uniform, nor would it be uniform if it had an IR-transparent atmosphere. Any body with a non-uniform temperature will have an average temperature below its effective emission temperature.
I’ve not found or calculated how much difference it makes, but I very much doubt it is as much as (33-16.4) = 16.6°C. So I think that the common 255°K estimate is probably too low (i.e., the 33°C estimate for the total GHE is probably too high).
I encourage anyone to check my calculations.
Shouldn’t that be (15°C = 288.15K) – 270.74K = only about 17.41°C
Yes, thank you for the correction, Dan. I don’t know how I turned 270.74 on one line into 271.74 on the next.
It isn’t that your calculations are wrong, but they are averages. With an IR transparent atmosphere, temps would vary from max at zenith to minimum when the sun is twelve hours away, i.e., nighttime. It would probably end up colder longer than warmer each day.
I agree, Jim. Since the Earth would be of uneven temperature its average temperature would be lower than its effective emission temperature. That’s why I wrote:
“However, that’s assuming uniform temperatures. Earth’s temperature is far from uniform, nor would it be uniform if it had an IR-transparent atmosphere. Any body with a non-uniform temperature will have an average temperature below its effective emission temperature.”
Consider a blackbody of uniform temperature, say 200K. It will radiate at an intensity E = ε⋅σ⋅T⁴, where T = 200K.
Now consider another blackbody of the same size, but with half of it at 100K and the other half at 300K. It has the same average temperature, but its emissions will be (100⁴/2 + 300⁴/2) / 200⁴ = 2.5625 × greater than the emissions from the uniform temperature blackbody, even though their average temperatures are identical.
If we assume equilibrium, where outgoing radiation equals incoming radiation, if incoming radiation is invariant, then the object with uneven temperatures must have a lower average temperature than the object with even temperatures.
What’s more, the more uneven the temperatures the lower the average temperature must be. A slowly rotating body like the Moon will have greater light-to-dark-side temperature differences than a quickly rotating body. So an airless Earth with albedo identical to the Moon would presumably have a higher average temperature than the Moon has, even though they get identical amounts of sunlight, simply because the Earth spins much faster.
Unfortunately, I don’t know how to calculate what that temperature difference would be. But my intuition suggests that it would be substantial.
“But if there were no water vapor there’d be no clouds”
That isn’t the postulate. Clouds are not vapor. The usual postulate is that Earth’s albedo remains unchanged.
Lacis et al more realistically computed the effect of just removing noncondensing GHGs and got a drop a little larger than 33C. The reason is that as it got colder, it got cloudier.
Yes Nick and so it precipitated more (and more snow).
A postive feedback to cooling as well as increased albedo.
Different people mean different things when they talk about “saturation.”
Some people say that CO2’s absorption of LW IR is saturated if you cannot “see” emissions from the surface of the Earth from outer space, at 15 µm. By that definition it is, indeed, saturated.
Other people say that CO2’s effect is saturated only if adding more CO2 has no additional warming effect. By that definition it is not saturated. Not quite, anyhow.
If you were to “look down” at a cloudless place on the Earth, with an infrared spectrophotometer in outer space, you would “see” emissions at various wavelengths coming, on average, from different altitudes. At some wavelengths (the 10 µm “atmospheric window”) you could see all the way to the surface; much of that LW IR from the surface escapes to outer space. But at other wavelengths a negligible amount of radiation makes it all the way from the surface to outer space, and all of the emissions you can “see” from space are coming from within the atmosphere. The average altitude from which emitted IR comes, which makes it out of the atmosphere, is called the “emission height.”
Increasing the atmospheric concentration of a GHG which absorbs & emits at a particular wavelength raises the emission height at that wavelength. That is to say, if you’re looking down from orbit you with more of the GHG you won’t see down as far at that wavelength.
If the emission height is within the troposphere (where we live), then raising the emission height decreases the average temperature of that GHG at the emission height, according to the “lapse rate,” which averages about 6.5 °C/km of altitude. According to the Stefan-Boltzman relation, E = ε⋅σ⋅T⁴, cooler gases emit less radiation, so those emissions have less cooling effect.
Thus, even at wavelengths where the atmosphere is “saturated” (meaning you can’t see the ground from orbit at that wavelength), adding more of the GHG has a warming effect (because it reduces cooling).
Note that a “controlled laboratory experiment” obviously cannot replicate that.
However, near the center of CO2’s 15µm absorption band, the emission height is already so high that it’s approximately at the tropopause. Adding more CO2 raises the emission height, but at the tropopause temperature does not decrease with additional altitude, so raising the emission height does not reduce emissions, and does not have a cooling effect.
So the warming effect from additional CO2 is from the fringes, where it absorbs & emits only weakly, and isn’t as saturated.
Caveat: the absorption & emission spectra of radiatively active gases in the atmosphere vary with altitude, due to “pressure broadening.”
The bottom line is that, while it is certainly true that anthropogenic warming is modest and benign, and the EPA’s Endangerment Finding is dead wrong, it is also true that, as Nick says, these “saturation” arguments are not going to change any games.
Here are some resources where you can learn more about this:
https://sealevel.info/learnmore.html?0=atmosphere#physics
P.S. — re: “why climate alarmists have never been able to explain the reason why the Earth has never experienced runaway warming in the past when CO2 levels were 5-10 times more concentrated than today”
I do not agree that they’ve “never been able to explain” that. I think that many climate alarmists understand why runaway warming isn’t possible.
The very silly people who hype a supposed risk of “tipping points” triggering “runaway warming” get a lot of press, and scare children, but there aren’t many of them.
Most fundamentally, the “reason why the Earth has never experienced runaway warming” is that as temperatures rise, stabilizing negative feedbacks increase in strength.
That’s why the burner on your electric kitchen stove doesn’t continue to get hotter and hotter, even though you’re continuing to pump energy (electricity) into it: the hotter it gets, the faster it loses heat. So if you increase the voltage to the heating element within the burner, it only gets hotter until the rate of heat loss has increased enough to match the increased energy input.
Radiative emissions (which cause cooling) accelerate with the fourth power of temperature, per the Stefan-Boltzman relation: E = ε⋅σ⋅T⁴. So as temperatures rise it becomes progressively harder to raise temperatures. That’s a negative (stabilizing) feedback (usually called, oddly enough, “Planck feedback“).(Convective and evaporative cooling also accelerate with increased temperature.)
Also, we know that added CO2 has a logarithmically diminishing effect on radiative forcing, which also contributes to temperature stability.
But even people who’ve never heard of the Stefan-Boltzman relation and negative feedbacks should be able to understand the most obvious proof that rising CO2 levels cannot cause “runaway warming.” That proof is history: For >98% of the Earth’s history the atmospheric CO2 concentration was much greater than it is now, yet the Earth never experienced “runaway warming.”
On the shorter scale of the last 800,000 years, we can see from ice core data that warm climates have been much more stable than cold climates (which is obviously incompatible with hypothetical “tipping points” and “runaway” warming). Glacial periods are punctuated by numerous large, rapid temperature changes, called Dansgaard-Oeschger cycles. That never happens during interglacials.
It is not conclusively known why that is, but the leading theory is that Dansgaard-Oeschger cycles are caused by large changes in freshwater discharge patterns into the North Atlantic, because of changes in the great Laurentide and Fennoscandian ice sheets. Those freshwater flows affect thermohaline circulation, especially the AMOC and Gulf Stream, which in turn affects northern climate. But that does not happen during interglacials, probably because, other than Greenland, the great northern ice sheets don’t exist during interglacials.
Another proof that warmer climates are more stable than colder ones is Arctic Amplification: the well-known fact that “global warming” isn’t really very “global.” It disproportionately warms chilly climates at high latitudes, especially in winter. The tropics and summers are affected less (which is nice, because they’re warm enough already).
The bottom line is that climate tipping points are imaginary and runaway warming is impossible.
Thanks Dave, it had to happen, and it finally did, someone had to provide an excellent analogy of why runaway warming is impossible, and you did it with your how an electric stove burner temperature is self regulating/limiting.
copy/paste
Most fundamentally, the “reason why the Earth has never experienced runaway warming” is that as temperatures rise, stabilizing negative feedbacks increase in strength…That’s why the burner on your electric kitchen stove doesn’t continue to get hotter and hotter, even though you’re continuing to pump energy (electricity) into it: (the) hotter it gets, the faster it loses heat… proof is history: For >98% of the Earth’s history the atmospheric CO2 concentration was much greater than it is now, yet the Earth never experienced “runaway warming.”
Note: Dr. Herman Harde, also does a great job on quantifying negative feedbacks, and how they “increase in strength”. No wonder the IPCC insisted (blackmailed?) the publishing journal to withdraw his 2017 Paper.
“Note: Dr. Herman Harde, also does a great job on quantifying negative feedbacks, and how they “increase in strength”. No wonder the IPCC insisted (blackmailed?) the publishing journal to withdraw his 2017 Paper.”
Harde that argued that most of the rise in atmospheric CO2 was natural.
Bonkers – so where has all the C that mankind has emitted (as CO2)?
Not the oceans as as the ocean warms, it becomes less efficient at absorbing CO2 and can even release it back into the atmosphere.
It was not the IPCC it was the editorial board of “Global and Planetary Change”, .. and in fact it was not withdrawn…
This from Ken Rice (andthentheresphysics)
“Ultimately, the editorial decision was that the original Harde paper should not be retracted, as no unethical action was found. I mostly agree with this. I think that papers should really only be retracted if there is evidence of plagiarism, or fraud. Unless requested by the author, I don’t think that a paper being wrong is a reason for retraction.”
Now I get what is meant by “dizzy heights” 😫
Dave,
A clear write up
Much appreciated.
It would be great if some numbers were put on these upward and downward IR radiations, in terms of W/m^2 for each wavelength and the heights of these power fluxes
Not true in general for well mixed GHGs. In some cases you might see a small change in specific lines, but the overall measure of a spectral window should be about the same.
Therefore, there is no effect at all. The view you mentioned is known as “the enhanced greenhouse effect” and is based on using Schwartzchild equations incorrectly.
Well, there are two general cases:
1. On one hand, the simplest case is for trace GHGs which have lines within the “atmospheric window.” At wavelengths for which the only radiatively active gases are in very low concentrations, most radiation from the surface escapes directly to space.
Every increase of the trace GHG simply increases the fraction of radiation which, instead, is absorbed in the atmosphere. That warms the air.
2. On the other hand, there’s CO2, which exists in such high concentrations that for the wavelengths that it absorbs most strongly nearly all of the emissions that escape to space originated within the atmosphere. The average altitude from which those escaping photons originate is the “emission height” for that wavelength.
Increasing the amount of CO2 in the atmosphere raises those emission heights.
For wavelengths for which the emission heights are within the troposphere, raising the emission heights means that the average air temperature where the escaping photons originate is colder, which reduces the intensity of those emissions, which means they cool the air more slowly. I.e., they have a warming effect.
For wavelengths for which the emission heights are at the tropopause, raising the emission heights has little effect on the average air temperature where the escaping photons originate, so there’s no “greenhouse effect” for those wavelengths.
In fact, at high latitudes, where the tropopause is low, there can even be an inverse greenhouse effect for those wavelengths, because the emission height can be above the tropopause (within the stratosphere). That presumably reduces Arctic Amplification.
3. On the gripping hand, there’s water vapor. It is very important, but not well-mixed. Its concentration depends heavily (but not entirely) on air temperature, so it is concentrated at low altitudes. It also move a great deal of energy via evaporation and condensation (latent heat transport). Like everyone’s favorite Facebook “relationship status,” it’s complicated.
(And let’s not talk about clouds.)
Nope, that is what I told you was not true. The analysis which leads to your claim is based on an incorrect definition of the situation. I realize you are likely hearing this for the first time.
The view that leads to an emission height increase is based on a fixed energy beam into an absorbing medium which then works its way through the medium. That’s not what happens in Earth’s atmosphere.
Instead, all of the fixed energy beam is absorbed low in the atmosphere and thermalized. It joins up with lot of other energy from water vapor, methane, conduction, latent heat, etc. None of this energy has any identity. This now becomes the source of the energy beam radiated upward.
And, it all gets absorbed in a few meters and thermalized yet again. So once again you start over with another new energy beam.
The big difference (in general) is the beam itself increases as CO2 increases at all layers of the atmosphere and must be taken into account. The claim for an emission height increase is based on a fixed energy source. This is why it is wrong.
“A fixed energy beam”? “A fixed energy source”?
Sorry, I have no idea what you’re talking about, Richard.
Consider this scenario: you’re in a satellite or space station, in low Earth orbit, and at the moment there are no clouds beneath you, on Earth. You look straight down at the Earth with a directional spectrometer, and examine the radiation which is coming up at you, from below.
1. At some wavelengths you can see all the way down to the surface. That includes the visible wavelengths, and also the 10µm “atmospheric window” band. So there is no “emission height” within the atmosphere for those wavelengths. Most of the photons which reach you in orbit at those wavelengths traveled all the way from the surface.
2. At other wavelengths, where radiatively active gases in the atmosphere absorb and emit very strongly, you cannot see very far down at all. Between about 14.2 and 15.8 µm the average altitude of the light which reaches you in orbit in clear sky conditions is about the tropopause!
The photons (at one of those wavelengths) which are reaching you (in orbit) from below had to originate somewhere! Where did they come from? They didn’t come from the surface, obviously. So they must have been emitted from within the atmosphere. Are you with me so far?
So the question is, WHERE in the atmosphere? What was the average altitude from which the photons (at that wavelength) originated, that reach your instrument in orbit?
That is the so-called “emission height.”
3. At other wavelengths, the “fringe wavelengths” where the radiatively active gases in the atmosphere absorb and emit only weakly, you can “see down” farther into the atmosphere from orbit, but not all the way to the surface. At such wavelengths, the average altitude of the photons which reach your instrument in orbit is above the surface, but below the tropopause.
Those are the wavelengths which are most relevant to the so-called (poorly named) “greenhouse effect” of increasing atmospheric CO2.concentration.
The higher the CO2 concentration, the higher the average altitude from which those photons (that reach you in orbit) originate. I.e., if you raise the CO2 concentration the emission height increases for such wavelengths. Since the emission height for those wavelengths is within the troposphere, higher altitudes mean colder air temperatures, so emission intensity decreases.
That is why additional CO2 has a (modest and benign) warming effect.
“Since the emission height for those wavelengths is within the troposphere, higher altitudes mean colder air temperatures, so emission intensity decreases.
That is why additional CO2 has a (modest and benign) warming effect.”
Unit emission intensity decreases. But the number of units (i.e. CO2 molecules) has gone up. So does the total emission change? Does it go down? Go up? Stay the same?
The energy (i.e. heat) loss is based on total emission, not on unit emission intensity. It is the total heat loss that determines the temperature of the thermodynamic system, not the unit emission intensity.
The assumption that temperature goes up because unit energy emission goes down is just that – an assumption. I’ve never actually seen it justified however.
Harold the Organic Says:
ATTN: Everyone
RE: CO2 Does Not Cause Warming of Air.
Shown (See below) in the chart are plots of temperatures at the the Furnace Creek weather station in Death Valley from 1922 to 2001. In 1922 the concentration of CO2
in the air was 303 ppmv (0.6 g of CO2/cu. m.), and by 2001 it had increased to 371 ppmv,
(0.7 g of CO2/cu.m.) but there was no corresponding increase in the air temperature at this remote arid desert. The reason there was no increase in air temperature is quite simple: There is too little CO2 in the air to absorb incoming or outgoing long-wave IR light.
Presently at the MLO in Hawaii, the concentration of CO2 in dry air.is 425 ppmv. One
cubic meter of this air has 0.8 g of CO2 and a mass of 1.29 kg. In air with a temperature
of 70 deg F and 70% RH the concentration of H2O is 14,780 ppmv. One cubic meter of this air has 11.9 g of H2O, 0.77 g of CO2 and a mass of 1.20 kg. The amount of the greenhouse effect (GHE) H20 is given by:
GHE = moles H2O/moles H20+moles CO2 = 0.66 + 0.018 = 0.97 or 97%
On the above calculation and empirical data, it is concluded that the claim by the IPCC
since1988 that CO2 cause warming of air and is the control knob of the climate and hence global warming is lie. The purpose of this lie is provide the UN the justification for the distribution of donner funds from the rich countries, via the UNFCCC and the UN COP, to poor countries to help them cope with global warming and climate change. At the recent
COP29 conference the poor countries came clamoring not for billions but trillions of
funds. The poor countries left the conference empty handed with no pledges of funds from the rich countries.
NB: The chart was taken from the late John Daly’s website:
“Still Waiting for Greenhouse” available at: http://www.John-Daly.com. From the home page,
scroll down to the end and click on “Station Temperature Data. On the “World Map”, click on a country or region to obtain access for weather station temperature data there. Joh Daly found over 200 weather stations whose temperature data showed no warming up to
ca. 2002
That’s completely wrong, Harold. So-called “greenhouse gases” (hereafter “GHGs”) are gases which are radiatively active in the far (LW) IR, below about 4 µm, where the Earth emits strongly. They are all triatomic (or greater), with bending modes which correspond to the energies of those long wavelength photons. (Monatomic Ar and diatomic N2 & O2 don’t have bending modes, so they’re transparent to those wavelengths.)
GHGs help warm the Earth by absorbing LW IR radiation emitted by the Earth, which otherwise would have escaped to space. By absorbing that energy, GHGs warm the atmosphere. (For very sparse/minor GHGs, that’s a pretty complete description of how they work, but for major GHGs like CO2, it’s more complicated, because there’s a lot of reabsorption & readmission going on.)
You might think that absorbing all that outgoing LW IR would make GHG molecules hotter than the N2, O2 & Ar in the atmosphere. That would be true, were it not for the fact that the air molecules are continually colliding with one another. Those collisions cause continual and and rapid exchanges of kinetic/thermal energy (heat content) among the various gases in the atmosphere, keeping them all in near perfect thermal equilibrium.
So the GHGs act as dyes (colorants) of the atmosphere, tinting it in the far IR. It really doesn’t matter which GHG molecule absorbs a photon, its energy ends up just fractionally warming the bulk atmosphere.
If you want to understand how adding more CO2 causes (benign!) warming, here are some resources:
https://sealevel.info/learnmore.html?0=physics#brief
A message from The Guardian/Observer
This is the moment for truth
The policies of the next US administration could have profound consequences for the future of the climate, the wars in Ukraine and the Middle East and the global economy.
Our rigorous, fact-based independent journalism will hold those in power to account…
Lol Lol Labour approved.
If you search the term “propaganda”, The Guardian’s logo should be the top result.
Our rigorous, fact-based independent journalism will hold those in power to account…
Thanks for the laugh, Guardian!
As always, the problem is that there are two “sciences”: The IPCC main report and the report
for decisions makers which is not at all the same thing, the second one unfortunately being the one that drives the climate narrative. One can discuss all we want, it won’t change a thing.
They even send the reports from the science panels back to their authors for editing in line with what the political Policymakers reports made up.
And something makes me believe, the author has not read the articles he uses as reference. Reinhardt 2017 for instance:
https://www.entrelemanetjura.ch/BLOG_WP_351/wp-content/uploads/2017/01/2017.01-20-FKR-sur-CO2.pdf
Don’t put all of your chips on The Donald doing something about it.
Harold the Organic Chemist Says:
ATTN: Everyone
RE: Absorption of IR Light by CO2
Shown the Fig. 7 (See below) is the IR absorption spectrum of a sample of Philadelphia city air from 400 to 4,000 wavenumbers (wn’s). The gas cell was an aluminium cylinder 7 cm in length with KCl windows.
The absorbance of the CO2 peak at ca. 675 wn is 0.026. if the gas cell was 700 cm
(7 meters) in length the absorbance would be 2.6 and greater than 99+% of the IR light would be absorbed.
For the H2O peak at ca 400 wn, the absorbance is 0.045. If the gas cell was ca 300 cm in length the absorbance would be ca. 2 and 99% of the IR light would been absorbed.
Above ca 1,300 wn H2O and CO2 are not absorbing out-going long wave IR, but are absorbing incoming IR light in sunlight.
NB: Fig. 7 was taken from the essay: “Climate Change Reexamined” by
Joel M. Kauffman. The essay is 26 pages and can be downloaded for free.
“King Canute’s”
One slight correction. It’s King Cnut’s.
Nope, it’s not a typo, but an interesting anagrammatic twist
SpellCheck ain’t gonna touch that one 🥺
Another slight correction,
That’ll be …
Knut the Great (Knut II, Danish: Knud den Store or Knud II) (d. 1035), Viking king of England, Denmark and Norway
Thanks, for the origins of his name
And he wasn’t trying to stop the tides, he was demonstrating to his followers that a King’s power is limited.
Not like Rachel from accounts then : )
My “goto” for a realistic evaluation of the effect of CO2, is with Dr Happer and Dr Wingaarden.
As many of you will recall, they published a complex and detailed paper on their mathematical analysis, and modelling outputs.
The significant difference with their models, was that they were compared to actual measurements and observations. The result were virtually identical, or as the scientists would say, a six sigma.
So, I prefer to trust the scientist that gives the evidence to support their stance, rather than those who make bold statements based on unproven models.
“The implication of CO2 saturation is a game changer, and should provide the Trump Administration with a substantial line of questioning of EPA’s Endangerment Finding.”
I find the “CO2 saturation” argument weak. It may score some points.
But from direct observation from space on NOAA’s “CO2 Longwave IR” band, centered at a wavelength of 13.3 microns at the edge of the “atmospheric window”, one can see that it is overturning circulation, and the formation and dissipation of clouds, that dominate the highly variable emission to space. It is not possible to isolate the minor static radiative effect of incremental CO2 – whatever that value turns out to be – for reliable attribution of ANY of the reported warming on land and in the oceans.
More here. Full explanation in the text description.
https://youtu.be/Yarzo13_TSE
And from the dynamics of the general circulation, the concept of energy conversion completely obscures any attempt to identify cause and effect related to non-condensing radiatively active gases such as CO2, CH4, N2O, and the like.
More here. Again, the full explanation is in the text description.
https://youtu.be/hDurP-4gVrY
I have to apologize, David. Every time I see your name I think Duane Dibbley (Red Dwarf fans will know).
LOL – I had to look it up.
“energy conversion completely obscures”
How true… the amount of energy transferred by air-movement, convection, conductance totally overwhelms any theoretical, unmeasurable tiny radiative absorption/thermalisation by atmospheric CO2 in the first 20 or so metres of the atmosphere..
“How true… the amount of energy transferred by air-movement, convection, conductance…”
Energy transfer and transport by the motion are indeed powerful factors both horizontally and vertically. But please understand, that is not the same thing as the power intensity (W/m^2) of conversion of one form of energy (kinetic) to another (internal energy + potential energy) and vice versa in a particular location. The plots in the video show the daily min/median/max values of that intensity, which can be positive or negative, at 1440 of those locations (1/4 degree longitude divisions) along the 45N latitude line, for one year. This concept arising from the physics of gases is why the so-called “warming” effect (internal energy) of the minor incremental radiative absorbing power from rising concentrations of CO2 cannot be isolated from “expansion” (potential energy due to altitude) and “acceleration to higher velocity” (the generation of kinetic energy, which drives and maintains the circulation.)
David,
Have you seen this analysis of balloon data that shows the gas laws are totally in control of the troposphere.
Always striving for equilibrium, but rarely getting there…
and yet we still get an absolutely linear relationship between energy and molecular density (R² =0.99x)
Yes, I have. Thank you for the reminder.
I stopped watching when he said that the atmosphere is in thermodynamic equilibrium.
That would be Kirchoff’s Law.
It’s not.
Every tropospheric molecule (mostly) has molecules below that are warmer, and molecules above that are cooler.
It’s called the lapse rate, created by gravity via the relation -g/Cp (Cp = specific heat of air).
All parts (usually) of the troposphere are very much not in thermodynamic equilibrium.
The atmosphere is a non-equilibrium system
That is why a GHG molecule on average can pass on its LWIR upwards.
The flux is upwards from the heat of the surface to the 3K of space.
And aside from that most of the LWIR energy is transferred via collision to adjacent molecules then back to further GHG molecules etc with molecules higher up at lower pressures and with more opportunity for the LW photon to be able to go up rather than down as a result.
In fact if the atmosphere were in thermodynamic equilibrium then there would be no lapse- rate and it would be isothermal, and obviously then no convection.
Complete pseudo-science from “Connolly Scientific Research Group is a family-run independent research group based in Ireland”
“CO2 radicalism rests on one main assumption – that increases in atmospheric CO2 will cause a linear and dangerous increase in global temperature. The belief that more CO2 emitted equals significantly more heat and higher temperature is a cornerstone of the ruling scientific paradigm.”
No it is not. IT may be a cornerstone of idiot activism, it is not a cornerstone of the academic science that supports climate change as a problem and attributes all temperature change to AGW. THAT is the false premise, based on no science, pure attribution, denying natural change and the natural control feedbacks.
So this premise is presumptive:
The way in which saturation increases is proven to be logarithmic by observations, so it will always increase with concentration, but by exponentially reducing amounts. Hence the doubling of CO2 causes a similar temperature change. Plot the line for yourself.
For those from other disciplines, it has a similar form to a capacitor charging from a fixed voltage through a resistor, or a simple inverted cooling curve, or the rate of flow out of a wine box, or petrol can?
WORSE: This is ALL a distraction from what matters. The changing effect of CO2 is so small relative to the much larger negative feedbacks to any radiative perturbation to the system that stabilise the earth’s enrgy balance in space by returning absorbed enrgy as LWIR in the 240W/m^2 of OLR. All well measured from space, BTW. Not a debate, perhaps some inaccuracies, but not at scale..
The primary energy loss controls are those of direct radiation and latent heat convected from the cooling oceans that become radiative losses to space in the troposphere, from where it must leave to colder space. The 2nd Law makes sure it heads for colder space, not hotter ground, BTW. Not controversial either. It’s all set out in the NASA and other static enrgy balances. Check it out.
These feedbacks are strongly variable, powerful enough to maintain the earth in its dynamic enrgy balance in response to such tiny changes as AGW, which is is rebalanced by the change in these feedbacks in response to a fraction of a degree change to the surface and atmopshere within the energy balance system. These controls are self evident in the NASA energy budget, as static quantities, which must vary with temperature. Even the concept of a tipping point from such a small perturbation when subject to such strong controls is nonsensical. Because it’s partial, as regards the Earth’s overall enrgy balance.
The problem is allowing ignorant activists AND deceitful academics to distract you by arguing about the tiny effect of AGW, while simply failing to consider the the scale of this natural planetary control. The claim that the whole of earth’s temperature change is due to a tiny change in AGW, an internal atmospheric transfer function within the larger system, is self evidently bogus. And does not happen in the reality of what we measure change to be. So a false premise. It also denies the natural feedbacks that must be real.
SO debating down the CO2 rabbit hole where these dominant realities no longer exist is playing their game, allowing them to set out a partial debating space. Having the wrong argument based on at least three provably false premises.
nb: The 3rd is that it was warmer by degrees during the Eemian and Holocene when CO2 was 280ppm, so CO2 was clearly not the “dominant control” of these warming. THat claim is demonstrably false on the many proxy observations of ice age cycles, that also show the rise to 280 from 180ppm lags temperature and is explained by Henry’s law. A cause ot an effect. Its colder now at 420PPM
Totally Bogus. Bill and Ted, (1989)
So even having debates about the idea of 1.6W/m^2 of AGW controlling Earth’s energy balance in space with no serious control feedbacks is almost as far down the UN’s deceitful science fiction rabbit hole as you can get, and serves the purpose of the deceivers very well. ITS NOT TRUE.
I close with the point, again, that Earth’s energy balance is controlled by the laws of thermodynamics, not the claims of IPCC pseudo scientists. It has been stable within a few 12/15º over 500Ma, is now close to the coldest in 10Ka on millenial time scales, also coldest in 1,000’s of millenia, BUT….within a few degs variability, between a thermonuclear furnace & the absolute cold & emptiness of space. Story Tip
The Balance of the Earth: http://dx.doi.org/10.2139/ssrn.4950769
Excelent summary!
This makes thermodynamic sense as I studied it.
Total BS
CO2 never saturates
Happer’s claim is just one of many wild guesses
No reason to assume he is correct.
Happer’s wild guess has varied from 1.0 degrees C. to 0.7 degrees C. over the years. I have never seen his name associated with 0.5 degrees C., which is lower than almost all other CO2 ECS wild guesses, which are in a range of +0.7 to +5.5 degrees C. per CO2 x 2
Obviously no one really knows.
I believe the attribution of 0.5 to Happer is a lie.
0.7 is CO2 lab spectroscopy with zero net feedbacks. There is some evidence of at least a modest water vapor positive feedback.
0.5, which I have never seen associated with Happer, is just another wild guess with almost no support from any scientists
Nick Stokes,
I used to accept the physics in the conventional manner that you describe, for saturation. Then, years ago, it was apparent that saturation is only one factor of many operating in the real atmosphere.
You need to face the broader question. If CO2 is interacting with natural energy, what happens to that energy? Of course, some is involved in convection. If convection is taking energy to high altitudes where it can fly off to space more easily, the mechanisms for energy production like saturation, become academic.
The matter is hard to confirm by experiment, so it is fertile ground for alarmists. Much has been made of the radiative balance at top of atmosphere, but the inaccuracy from satellite measurement platforms causes errors too large to allow even the sign of the balance to be stated.
Likewise, the IPCC has made a feast of the concept and numerical values of climate sensitivity. Their numbers plus others published, range from zero to 7 units or so, which is huge for the importance of sensitivity. Surely, the inability of IPCC to arrive at a figure in 3 decades of study should cause you, as a mathematician, some pause. Instead, you seem to be at home with the official narratives, not questioning them forever, as I and many other scientists do. And must do. Geoff S
At 400 ppm lwir is absorbed to extinction after as short traverse thru the atmosphere. An increase to 800ppm CO2 would absorb no more lwir merely shorten the distavce to extinction
The logarithmic effect is not the same as the saturation effect.
Climate sensitivity is warming per CO2 doubling, so is fundamentally logarithmic in behaviour.
Saturation of the logarithmic effect does not occur below 2 percent co2 concentration, far beyond the worst case emission scenario.