
A new study reveals that plants have been absorbing 31% more CO₂ than previously believed. Yes, 31%—a glaring error that casts serious doubt on climate models, emissions scenarios, and policy prescriptions like Net Zero. For years, we were told that the “science was settled,” and that urgent action was needed to avoid catastrophic warming. But this discovery suggests that our models have been dramatically underestimating nature’s ability to manage CO₂. This revelation not only upends the rationale behind aggressive policies but also raises broader questions about the supposed certainty of climate science.
The Myth of “Settled Science”
The phrase “settled science” has been the bedrock of climate advocacy for decades. We’ve been told that if we don’t make rapid, costly changes, we’d face imminent disaster. Skeptics were treated as heretics, while the so-called consensus was portrayed as unquestionable. Yet, it turns out we were 31% wrong about something as fundamental as plant CO₂ absorption. This isn’t a minor correction; it’s a massive revision that undermines the credibility of models driving policy.
The Unraveling of Climate Models
Climate models are the tools used to predict warming and guide policy. They’ve been treated as scientific scripture, driving policies from emissions reductions to renewable energy mandates. But with a key assumption proven wrong, the models’ projections are called into question:
- Overblown Emissions Impact: Climate models predicted rapid CO₂ buildup, assuming limited natural absorption. This inflated the urgency of drastic emissions cuts. Correcting for higher CO₂ absorption rates means that CO₂ accumulates in the atmosphere slower than models predicted, weakening the case for urgent, economy-wrenching measures.
- Questionable Feedback Loops: Many models rely on dramatic feedback loops—such as reduced plant CO₂ absorption at higher temperatures—to justify emergency interventions. But this new data shows plants can handle more CO₂ than anticipated, making these feedback loops look less inevitable and more speculative.
- Policy Implications: If the models guiding climate policy have been this far off, then the entire framework behind policies like Net Zero becomes shaky. Policies driven by these models were never proven to be beneficial, but were only assumed to be so. The discovery that plants are absorbing significantly more CO₂ undermines the supposed need for extreme measures.
Integrated Assessment Models: Revisiting Flawed Assumptions
Integrated Assessment Models (IAMs) blend climate and economic data to suggest policies that balance costs and benefits. They have provided much of the justification for global measures ranging from carbon taxes to renewable subsidies. But with CO₂ absorption rates off by 31%, these models face a major credibility problem.
- Cost-Benefit Analysis Loses Its Basis: IAMs assume a certain rate of CO₂ absorption to weigh the costs of emissions cuts against the benefits. If the natural absorption is higher, then the benefits of aggressive cuts are lower than the models projected. In short, many of these “benefits” were assumed rather than demonstrated.
- Marginal Abatement Costs Are Likely Wrong: If plants are more effective carbon sinks, the cost of reducing each additional ton of CO₂ may be overstated in current models. This means that the high costs of immediate interventions may not be justified by the reduced warming they are supposed to achieve.
- Tech-Centric Solutions Become Harder to Justify: Expensive technological carbon capture schemes, often seen as a cornerstone of Net Zero strategies, become less urgent in light of nature’s greater CO₂ absorption capacity. Relying on natural processes might be more cost-effective, while prioritizing costly tech solutions could be a waste of resources.
The Net Zero Push: Unproven and Assumed to Be Beneficial
Net Zero policies are often presented as inherently beneficial, with no need to prove their value. The assumption is that reducing emissions rapidly will stabilize the climate and prevent catastrophic warming. But the reality is far less certain:
- Urgency Based on Unproven Models: The rush to Net Zero has been justified by models that assumed much lower natural CO₂ absorption. With plants taking in more CO₂, the urgency diminishes, raising questions about whether this policy was ever justified, beyond mere assumptions of benefit.
- Economic Costs Without Clear Benefits: The transition to Net Zero is projected to cost trillions, requiring massive infrastructure changes and energy system overhauls. These changes were sold as necessary to prevent dire outcomes, but with natural systems absorbing more CO₂, the supposed benefits become even murkier. The costs are real, while the benefits remain speculative.
- A Flawed Logic of Assumed Good: Proponents argue that even if Net Zero doesn’t deliver promised benefits, it’s better to “play it safe.” But this logic ignores the very real economic and social costs of these policies—costs that can harm the most vulnerable. If models were wrong about something as basic as CO₂ absorption, then continuing these extreme measures without re-evaluation is irresponsible at best.
Climate Sensitivity: Rethinking the Crisis Narrative
Climate sensitivity measures how much the Earth’s temperature will rise with a doubling of CO₂. It’s a core figure in climate models, typically estimated to be between 1.5°C and 4.5°C, with policy-driving models often assuming a midpoint of 3°C. If plant CO₂ absorption rates were so underestimated, it suggests that the models might also be overestimating climate sensitivity.
- Slower CO₂ Accumulation Reduces Sensitivity: If natural absorption is higher, the atmospheric CO₂ concentration increases more slowly, which may imply a lower climate sensitivity than currently assumed. In other words, less CO₂ means less immediate warming, contradicting the dire predictions that have justified extreme policies.
- Overestimated Warming Scenarios: The upper estimates of climate sensitivity have driven much of the urgency around climate action, but this new data suggests that the Earth may not warm as rapidly as claimed. If the worst-case scenarios are less likely, then the aggressive timelines for emissions reductions look increasingly unjustified.
- Time to Adapt, Not Panic: If climate sensitivity is indeed lower, it means we have more time to adapt to any changes, that may in fact be natural, rather than rush into drastic mitigation measures that haven’t been proven to work. Adaptation becomes a more reasonable and potentially effective strategy, given the new information on natural absorption rates.
The Bigger Picture: Science Isn’t Settled, and Neither Is Policy
The discovery that plants absorb 31% more CO₂ than we thought reveals just how far off the mark climate models—and the policies based on them—can be. It’s not just a matter of revising a few numbers; it’s about rethinking the entire narrative of “settled science.”
- Assumptions, Not Proof: Policies like Net Zero were based on assumptions of benefit, not evidence. They were sold as urgently needed to prevent catastrophe, but those catastrophic outcomes were based on models that got a core assumption wrong by nearly a third.
- More Surprises Await: If this key factor in the carbon cycle was so miscalculated, how many other natural systems might also be misunderstood? The real danger may not be climate change itself, but the overconfidence of those who claim to understand it fully.
- The Real Risk Is Bad Policy: Extreme measures based on flawed models can do more harm than good. If the costs of policies like Net Zero outweigh their uncertain benefits, then pushing ahead with them is reckless and potentially damaging.
Conclusion: Stop Assuming, Start Reassessing
The revelation that plants absorb 31% more CO₂ than previously estimated is a major blow to the models driving global climate policy. It challenges the core assumptions behind policies like Net Zero, which were never proven to be beneficial but only assumed to be so. If climate sensitivity is lower, warming slower, and natural CO₂ absorption higher, then the rush toward extreme measures looks increasingly unjustifiable.
It’s time for policymakers to recognize that the science is not “settled” and that uncertainty remains the defining feature of climate science. Instead of doubling down on unproven policies, it’s time to pause, reassess, and adapt to evolving evidence. Continuing the rush to Net Zero without a fundamental re-evaluation isn’t prudent; it’s a gamble with society’s resources and well-being.
Abstract
Terrestrial photosynthesis, or gross primary production (GPP), is the largest carbon flux in the biosphere, but its global magnitude and spatiotemporal dynamics remain uncertain1. The global annual mean GPP is historically thought to be around 120 PgC yr−1 (refs. 2,3,4,5,6), which is about 30–50 PgC yr−1 lower than GPP inferred from the oxygen-18 (18O) isotope7 and soil respiration8. This disparity is a source of uncertainty in predicting climate–carbon cycle feedbacks9,10. Here we infer GPP from carbonyl sulfide, an innovative tracer for CO2 diffusion from ambient air to leaf chloroplasts through stomata and mesophyll layers. We demonstrate that explicitly representing mesophyll diffusion is important for accurately quantifying the spatiotemporal dynamics of carbonyl sulfide uptake by plants. From the estimate of carbonyl sulfide uptake by plants, we infer a global contemporary GPP of 157 (±8.5) PgC yr−1, which is consistent with estimates from 18O (150–175 PgC yr−1) and soil respiration ( PgC yr−1), but with an improved confidence level. Our global GPP is higher than satellite optical observation-driven estimates (120–140 PgC yr–1) that are used for Earth system model benchmarking. This difference predominantly occurs in the pan-tropical rainforests and is corroborated by ground measurements11, suggesting a more productive tropics than satellite-based GPP products indicated. As GPP is a primary determinant of terrestrial carbon sinks and may shape climate trajectories9,10, our findings lay a physiological foundation on which the understanding and prediction of carbon–climate feedbacks can be advanced.
Discover more from Watts Up With That?
Subscribe to get the latest posts sent to your email.
Models…
Whilst they are evidence of nothing they have (conveniently) become the new gold standard in evidence – whatever the claim.
Climate crisis caused half of European heat deaths in 2022, says study
[The researchers modelled data on 854 cities to estimate deaths from hot and cold temperatures across the continent. ]
https://www.theguardian.com/environment/2024/oct/29/climate-crisis-caused-half-of-european-heat-deaths-in-2022-says-study
https://www.theguardian.com/society/article/2024/aug/21/heat-deaths-in-europe-may-triple-by-end-of-the-century-study-finds
I found this to be a fantastic paper, although I’m probably one of the few people around that has a gas chromatograph and carbonyl sulfide standard in their basement.
Gee . . . why am I not surprised that “statistical analysis” (hah!) of the outputs of the 30-something supercomputer climate models used by the IPCC in their periodic CMIPx comparisons-of-predictions failed miserably to detect the ~30% discrepancy in the CO2 land vegetation actually absorbed (per the above article) versus the science-is-settled-value that those high-paid climate modeling “experts” just assumed?
ROTFL.
Any chance that the IPCC will learn anything from this embarrassing turn-of events . . . not a snowball’s chance in hell!
Keep in mind that much of the data included in models are estimates, many of which are compiled from troves of estimates distilled to one ‘estimate’.
Dissonantia Clima Mathmaticalis Cognitiva.
No, it’s settled all right.
That only ever referred to the fact that CO2 is along lived GHG, and that man’s injecting it into Earth’s atmosphere will lead to warming.
A certain Swedish scientist even established that as far back as 1855.
Yet we have dinosaurs on here every day who know better.
The rest is just the usual denialist straw men.
Such as this.
See what I did there Charles …. Given your post dozens of extra rants.
That is utterly meatheaded. Unless one assumes runaway feedback, the climate sensitivity is such that it is lost in the noise. And you are assuming warming is a Bad Thing, utterly unfounded given the history of the Little Ice Age. And what caused that? Mann’s lame attempt to make it go away was a sign of the IPCC going full advocate, rather than claiming to do “science”.
The IPCC is political organization and does no research.
Plus they rewrite the research summaries for political purposes.
Which Swedish scientist was that, and in what year did he establish that? 1855, you say. Are you sure about that?
To address the serious point, what has been known for a Very Long Time is that CO2 rises have a warming effect. Whether that warming effect results in planetary climate warming however, and if so how great it is, that is a completely different question, and it certainly was not established in 1855. Nor in 1896. Nor in 1908. Nor for that matter is it established today.
Why pick 1896 and 1908? Well, that was when a different Swedish scientist than the one you have in mind published two well known papers….
As usual you are confusing the fact that CO2 increases have a forcing effect with the claim that this forcing effect will lead to global temperature rises. Not necessarily, the climate is a complex chaotic system, with lots of feedbacks, positive and negative.
Did you get the name of the Swedish scientist you meant, yet, and his date of publication?
The only thing all the physicists claimed was that CO2 absorbs a certain wavelength band of incoming radiation. The experiments were carried out in large test tubes. Even Aurhenius dismissed the impact that discovery would have on the atmosphere and also dismissed the warming concept.
No, CO2 absorbs a wavelength band of the outgoing radiation.
It was Arrhenius.
The point being that GHGs have been known about for over a century and have been recognised as of miniscule importance. Everything else dwarfs their effect.
That was until the 1980s when feedback effects were imagined that suddenly made them a problem.
It’s newsworthy AGW that’s controversial, not spectroscopy.
Arrhenius based his conjecture on erroneous simplification of the atmosphere using a very simplistic model.
All he actually found was that CO2 is a radiatively active molecule.
He made absolutely ZERO measurements of anything in a free atmosphere.
No, feedback effects were not first recognised in 1980s. Arrhenius allowed for water vapor feedback – the biggest one. And so he got a warming of 1.6C/doubling without feedback, 4C/doubling with feedback. And those are not of minuscule importance.
Do you believe that the real climate sensetivity is between 1.6C/doubling and 4C/doubling?
Nick will believe anything that supports the narrative.
Except it was based on a very simplistic and erroneous model of the atmosphere.
Hence an utterly meaningless conjecture.
Not only that, but the equations he used were dimensionally inconsistent, making it even more meaningless.
Oh and “feedback effects” are still just a postulated conjecture.
See my comment above about positive water feedback nonsense.
Both numbers are only wild ass ball park estimates- something you apparently don’t comprehend. Real science, like physics offers numbers like- the mass of a proton is 1.67262192 × 10⁻²⁷ kilograms.
And with the negative feedback that has to exist, to have anything approaching a stable climate at all?
I know it was Arrhenius!
My question was, whether Anthony Banton does.
The positive water feedback proposal is nonsense. 71% of the earth’s surface is covered with water and water does not any help by CO2.
The wind is a major force that transports water out of the oceans onto the land. Climate models do not take into account the effects of the winds. The recent hurricanes dumped enormous of water into the southern US.
Yes, this has been demonstrated In Miskolczi’s work using radiosonde data (See his 2023 paper for more detail). In fact, water vapor is a negative feedback of about the same magnitude as CO2 energy absorption.
This is the reason there’s been no warming from increases in CO2 over the last 200 years.
The whole thing is balanced out by the gravity induced energy gradient.
Of course any mythical WV feedback appears to totally cancel out mythical CO2 warming.
Wasn’t it Dalton, in the 1860’s, who identified the non-condensing radiative gases and their properties, using spectroscopy?
No. Dalton died in 1844, and anyway didn’t do that sort of thing. You may mean Tyndall.
Use of a thermoelectric pile as a detector is not spectoroscopy.
You are referring, I suspect, to Arrhenius’ papers in 1896 and 1904(?). Nice work, but he used a “Standard Atmosphere”, which has zero humidity.
Totally untrue. He supposed constant relative humidity.
“He supposed constant relative humidity.”
So totally clueless about real atmospheric processes.
Calculating on an imaginary planet that doesn’t exist or bear any resemblance to Earth..
Nick has foot in mouth disease, as usual.
No you’re an idiot, when someone corrects another poster about the assumptions made in a previous paper it doesn’t mean that person believes those assumptions are correct, particularly in a paper published a century ago!
“A certain Swedish scientist even established that as far back as 1855.”
If you had any skills in research, you’d find it was an American woman, but then you have a history on here of ignoring fact & following fiction.
Who is the American women?
Eunice Newton Foote, 1819-1888.
https://external-content.duckduckgo.com/iu/?u=https%3A%2F%2Ftse1.mm.bing.net%2Fth%3Fid%3DOIP.VvxNqGb8yohhWZLLKJY_QgHaEK%26pid%3DApi&f=1&ipt=8a5574f483024b9746b937b88768ee5d48dd6b66eda134bd28c6cc78c3acd50b&ipo=images
A pioneer in climate science & inventor. She presented her findings on the greenhouse effect in 1856, but her work was overlooked and misattributed to John Tyndall.
Foote described her findings in a paper, “Circumstances Affecting the Heat of the Sun’s Rays”, that she submitted for the tenth annual AAAS meeting, held on August 23, 1856, in Albany, New York, but in those days the paper had to be presented by a man ( Joseph Henry of the Smithsonian Institution).
In the 1890s Arrhenius did a poor ‘desktop study’ of her work & produced his paper in 1896, it was heavily criticised by Knut Ångström in 1900;
Arrhenius produced another paper ‘Amended View of Global Warming‘ in 1906 where he acknowledged his mistakes.
https://friendsofscience.org/assets/documents/Arrhenius%201906,%20final.pdf
Eunice Newton Foote had a major discovery that rarely gets mentioned. She determined experimentally that heat (thermal energy) and light (electromagnetic energy) are not the same.
She also demonstrated that an water saturated atmosphere had the same temperature rise in a glass tube as 100% CO2.
Everyone zooms in on her last sentence that said that if the atmosphere were 100% CO2 it would be warmer.
Think that through. 100% CO2 atmosphere means no water on the planet.
I get from the/your above post, that Arrhenius was a real ‘scientist’…. he was mistaken, and admitted it!
She was only 1, unless she had a personality ‘disorder’.
Banton provides yet another empty AGW mantra regurg. WRONG on basically every point
CO2 is NOT a long lived constituent of the atmosphere.
There is NO empirical scientific evidence it causes warming
Nothing was established in 1855.. it was pure conjecture based on erroneous understanding.
Only dinosaurs here is Banton, living in a pitiful world of fake science.
What an incredibly mindless and ignorant little child-mind.
Science always advances in fits and starts and often 2 steps back for each step forward.
A curious phenomenon is observed and a hypothesis is proposed to explain it. Subsequent scientists explore and either add supporting data or disproving data. When one is mining the reports, one can find sentences and phrases that support any preferred point of view. The point is, one must read and assimilate the entirety of the research and use that as a stepping stone to move forward.
Presumably you mean Arrhenius in 1896 which was refuted by Angstrom in 1900 and numerous others since then.
No, he didn’t mean Arrhenius in 1896, because, according to him, this wonderful event he is talking about happened in 1845.
Arrhenius was born in 1859. Pretty tough to establish scientific theories before you were born. A sort of post-modern miracle.
So inquiring minds want to know, who was this mysterious Swedish scientist Banton is talking about, when did he or she publish, and what was it that they published?
Come on, tell us, I mean us, the dinosaurs and denialists on here every day. Inquiring minds want to know!
He got the dates screwed up. Arrhenius is the guy. But at best he might be thinking of Tyndal (1859) or if he has everything upside down then maybe Fourier (1824). 1855 doesn’t show up on the radar.
“He got the dates screwed up”
Banton makes a habit of getting everything screwed up !
Mr. Banton, CO2 has no emissivity at atmospheric temperature and pressure so it cannot lead to warming as you say.
HAW HAW HAW HAW HAW HAW
This a dead-on arrival comment you made since you didn’t address anything of the blog post thus it is WORTHLESS.
Why can’t you make a credible comment explaining why you think it is wrong:
Perhaps not many scientists say it’s settled but most of the MSM does. In particular, the propagandists pushing for more “green” energy.
Well, not a scientist (a politician) Al Gore claimed and still claims the science is settled.
“We have a consensus!”
Your comment is based on the faulty assumption: the more CO2 the more effect (linear !).
That assumption is totally false. Both CO2 and Water vapor are saturated and cannot absorb much
more energy. Even if their concentration gets doubled, it would only be a few percent more. Each molecule absorbing light make the light less available to the other molecules around. It’s a simple way to explain it.
It’s not even been proven that CO2 causes a global temp rise or whether a rising global temp causes increased CO2 in the atmosphere. All we really know is that there is a positive correlation but that does not equate to causality.
I did a specific heat capacity calculation on a different thread. I had to go to 6 decimal places before the effect of doubling CO2 from 400 ppm to 800 ppm showed a difference.
Was that farther than Tipperary?
And what is the relevance of the effect of CO2 on heat capacity? The effect of CO2 in the atmosphere is the absorption of blackbody emissions from the surface.
You need to go back and read (or reread) Tyndall and see what else was accepted as “established” science back then. HINT: It was debunked by another famous experiment in the late 19th century.
Wrong.
CO₂ residence time has steadily declined as real scientists analyze the data.
Wood can last centuries as houses. Probably the most efficient and cost effective carbon capture on the planet.
It lasts quite a long time under glaciers
Ernest Shackleton… carbon capture hero.
We already knew the climate models are wrong. We just did not know how wrong.
I once read: Models are always wrong. but sometimes they are useful.
— “The models are convenient fictions that provide something very useful.” – Dr David Frame, climate modeler, Oxford University.
— “The data doesn’t matter. We’re not basing our recommendations on the data. We’re basing them on the climate models.” – Professor Chris Folland, Hadley Centre for Climate Prediction and Research.
— “No matter if the science of global warming is all phony. … climate change provides the greatest opportunity to bring about justice and equality in the world.” – Christine Stewart, former Canadian Minister of the Environment
— “It doesn’t matter what is true, it only matters what people believe is true.” – Paul Watson, co-founder of Greenpeace.
The usefulness of a model only extends as far as it is reasonably accurate. Once they cease to be accurate approximations of the phenomena they are modelling, then they cease to be actually useful. This does not mean they are not politically useful, or ideologically useful though. For climate models, this latter definition of “useful” is more likely to be what is meant when they are described as being useful.
The problem is that the climate “models” are not truly models. They are data matching algorithms lacking in physical realty – thus they are riddled with “parameters” that are guessed at to make the outputs match the training data.
Hindcasting is simply curve fitting.
Guess that’s why I have a stiff buttock.
Sometimes they are most useful for controlling the serf class. Look at the results and assume the intent.
You’re referring to George Box: “All models are wrong, some are useful.”
IIRC there is that quote comparing modeling to masturbation and “no substitute for the real thing”
So CO2 isn’t going to hit 700 ppm by 2100?
Who knows, maybe it will happen by 2035. What would happen then? I imagine confused NYers taking boat tours around a torch sticking out of the harbor.
Now we learn that early humans were doing carbon capture using wood as much as 500 thousand years ago.
Even then the early IPCC was claiming everyone was going to die for their CO2 sins. Turns out they were correct. Everyone did die. It was CO2 from hunting and cooking fires that killed them. They should have switched to electric.
Don’t rub sticks together, rub magnets and wire. How could they have missed this?
And the Transient Climate Sensitivity to CO2 doubling is probably no more than 1.2 C, as per Lewis and Curry, so the models assuming much more are even worse.
Just looked it up. 1.3C. 1.2C is Lindzen’s estimate of the no feedbacks ECS.
And Dr. James Hansen also says 1.2 AR4 Chapt 8 pdf43
Based on specific heat capacity calculations, it is much, much lower than 1.2 C.
Based on EM wave calculations, it is much, much lower than 1.2 C.
It is worse than we thought! 😉
Seriously, I made some rough estimates on the natural biological carbon cycle a couple of years ago. Given that carbon absorbers (plants..) and carbon emitters appear to be on long time equilibrium, you can estimate it just as well from the other side, the O2 absorbers (animals, bacteria, fungi..). Circumstantially it is impossible to give precise estimate like this, but I came to conclude some 500 to 1000Gt of CO2, larger than common figures otherwise. 157PgC equate to 157 / 12 * 44 = 575Gt of CO2 and thus vindicate my previous estimate.
I was wondering who decided to leave the “1%” on the end of “31%”.
At least they didn’t say 31.254%
In my opinion, “absorb” is incorrect technically but gives the connotation that is desired by alarmists. Don’t you think that “consume” would be better?
How much CO2 do all the plants in the oceans use. It must be a lot as evidenced by enormous amounts of animals and plants therein. How much food does a large whale consume?
Question is rather on how much CO2 the species exhale. Whales are large, but there are few, and because they are large, their metabolism is slow. Small species however, with large bio mass and high turn-over rates..
“This isn’t a minor correction; it’s a massive revision that undermines the credibility of models driving policy.”
…..which, as usual, will probably be ignored by the alarmist mass media and all the govts worldwide that are on board with the climate alarmist narrative.
This study is yet another threat to the money, power and control being pursued in the name of the climate scare.
Might get covered as part of a “save the Amazon” bit. They’d get to reuse some vivid stock footage.
How soon before a retraction is forced?
If we aren’t great at measuring the effect of plants, how do you think we do at marine biota?
That’s where the big sinks are.
And we are blinder than an eyeless bat in a coal mine about that.
If we aren’t great at measuring the effect of plants,….
then why should we trust this study any more than the rest?
I like this team better, but lets not steal plays from the other one.
Apparently, the deep ocean is the last place you want to look for water. /s
Climate policy has progressed assuming that Louis de Bleriot’s aeroplane was the template for transatlantic mass transit.
GIGO strikes again.
Nonsense studies like this one should be reserved for a new WUWT feature called The Dumb Thread.
Nature absorbs roughly half of the annual addition of about +5ppm of manmade CO2 emissions every year. That’s why atmospheric CP2 increases about +2.5 ppm a year. This junk science study does nt change that fact.
The roughly 2.5 ppm pf CO2 absorbed by nature (oceans, plants and soil) can not be split into exact percentages for oceans, plants and land). Therefore, the claim that plants absorb 33% more CO2 than previously thought is a meaningless claim.
For billions of years nature has been a net CO2 absorber. This is not a new trend. The ONLY reason CO2 in the atmosphere has been rising in the past 150 years, from 280 ppm to over 420 ppm, is from manmade CO2 emissions.
Nature is not able to absorb all the CO2 added by humans, which is good news for the climate and for plant growth. I call this CO2 recycling.
Nonsense comments like this make RG look like a mindless AGW cultist.
Poor little fellow still hasn’t learnt that human released CO2 is a small fraction of the overall CO2 flux and is easily drowned out by increases in natural flux.
Only the most STUPID person in the world would think that natural CO2 sources don’t increase as the planet gets warmer from solar activity.
Perhaps RG ought to read and try to learn.. although we all know he is stuck with his brain-washed misinformation.
https://rclutz.com/2024/07/11/mid-2024-more-proof-temp-changes-drive-co2-changes/
I can imagine BeNasty would be the leading commenter to the new, imagined The Dumb Thread at WUWT. Every website needs an AGW denying, CO2 Does Nothing, El Nino Nutter like BeNasty for comic relief.
Poor RG,
Still just his mindless little EVIDENCE-FREE comments.
Incapable of reading and comprehending basic scientific expansions.
Hilarious.!
Have you got any empirical scientific evidence for warming by atmospheric CO2…
… or are you planning to continue being an abject failure. !
typo..
expansions-> explanationsKeep in mind that the only reason RG is here is to promote his blog.
Noted that you have ZERO counter to the facts and reality.
Avoidance of evidence.. the very opposite of science.
Our annual emissions equate to no more than a couple of extra CO2 molecules per tree leaf on the planet, let alone the thousands of other types of flora. Every living thing on the planet on the land, in the sea and in the air is composed of carbon compounds that were once in the air as CO2. The claim that it is only our “emissions” that remain in the air and accumulate year on year, nature cannot cope with our contribution or that the carbon cycle was somehow magically in perfect equilibrium before we started to burn coal and oil is a complete fairy tale designed to fool the gullible. And here you are.
Nature has been a net CO2 absorber for bullions of years. The low point for atmospheric CO2 was 180ppm only 20,000 years ago. The annual carbon cycle, on average, absorbs slightly more CO2 than is emitted. You are lost in an imaginary world of silly junk science.
Only a moron thinks that warming doesn’t increase the natural CO2 flux.
You again, have absolutely nothing to counter reality, just your brain-washed junk-science gibberish.
Nature has been a net CO2 absorber for bullions of years
Buuuuuuuuuuuuullshit. Where do you think co2 came from?
And clearly you lack imagination. Presumably you believe ice cores, sediments and tree rings are accurate records of CO2 levels and valid indicators of past climates also.
“I call this CO2 recycling.”
And the child invents its own wording for “Carbon Cycle” …. Hilarious !
You are comparing a few decades with billions of years. Therefore you are a simple minded idiot.
The decline in co2 over that time was not linear because of solar influence. Ever considered that human co2 is added onto increased natural outgassing and increased natural respiration?
In other words, do you believe we would be able to see human co2 if the Earth was cooling?
Np one can see CO2
It is invisible
I thought your girlfriend could !
But you are accidentally correct…
… nobody can see any evidence of CO2 warming in the UAH data.
You have proven that.
Yes! Richard’s Greta Thunderstorm can see CO2.
UAH data do not reveal what causes the warming, they just reveals a warming trend.
The warming rate is increasing gradually when viewed as ten year averages. The latest ten year rise was about +0.4 degrees C. from the 2014 trough to 2024
More BS from RG.
The ONLY warming in the UAH data is at El Nino events.
Noted yet again that RG is TOTALLY INCAPABLE…
….of showing any CO2 warming in the UAH data.
or warming by atmospheric CO2 anywhere.
You know exactly what I mean. Answer the question.
Gretta claims she can see CO2.
LOL, just as Banton failed so did you thus the blog post remains unchallenged.
By blog post I assume you mean this article
No one knows the exact percentage of CO2 absorbed by plants
Without that knowledge, a claim that plants absorb 33% more than an unknown amount is a meaningless claim.
This article repeatedly makes the 33% claim but NEVER explains the details about the claim.
What was the original percentage. What is the new percentage. And exactly why was there a 33% increase.
The lack of details in this article, assuming such details were in the “study”, shows the author of this article is an incompetent writer.
I realize your word salad is an attempt to confuse me, but since you made ZERO explanation why it is wrong you ended up with nothing.
The article remains unchallenged.
The article was challenged
The article is claptrap
The author is incompetent.
No one knows the exact percentage of CO2 absorbed by plants
Therefore, the claim of a 31% increase of an UNKNOWN percentage is meaningless wild speculation. Junk science.
We only know that about +5 ppm of manmade CO2 emissions results in atmospheric CO2 increasing about +2.5 ppm.
Where are the verified numbers Richard, you still haven’t made a case against the article.
You didn’t even bother to read the abstract did you?
“Here we infer GPP from carbonyl sulfide, an innovative tracer for CO2 diffusion from ambient air to leaf chloroplasts through stomata and mesophyll layers. We demonstrate that explicitly representing mesophyll diffusion is important for accurately quantifying the spatiotemporal dynamics of carbonyl sulfide uptake by plants”
They are estimating the absorption using a different method than has been used in the past. It gives a higher total.
You don’t even *know* that the +2.5ppm increase in the atmosphere is from *man-made* emissions. You don’t even know if CO2 causes global temp rise or if global temp rise causes increased CO2. These are nothing but religious dogma from your bible of AGW.
Your attempted challenge was floppier than a limp lettuce leaf.
Of ZERO substance, just your mindless and ignorant blustering.
You post nothing but claptrap…
.. and are totally lacking in any scientific competence or understanding at any more than a junior high level.
Without any evidence of CO2 warming, you can’t claim there is any.
Your comment show you are an incompetent and scientifically illiterate twit.
CO2 in the life cycles of plants and animals is good CO2. CO2 produced by the use of FF is bad CO2.
All CO2 is good news — the staff of life
Manmade CO2 produced without modern pollution controls does not benefit life as manmade CO2 WITH modern pollution controls does
Agreed. I was being sarcastic. The greenie wackos believe CO2 is bad.
Oh dearie me.. RG misses the sarcasm .. Poor RG !!
He misses more than that.
I never miss the junk science comedy in your comments, BeNasty.
You certain missed presenting anything that even remotely resemble actual scientific evidence.
You have presented exactly what everyone expects from you…
… NOTHING BUT BLATHER.
Not the only reason. Warming oceans also alter the balance between airborne CO2 and the CO2 dissolved in the ocean. We’ve put CO2 out there to be sure, and that’s sped up that process much faster than the ocean warming by itself could have.
Oceans have been a net CO2 absorber for the past 150 years.
The +1 degree C. ocean temperature increase since the 1800s ONLY means the oceans absorbed about 20 ppm less CO2 than they would have absorbed with no warming.
The point is that if we hadn’t put the CO2 out there ourselves and the oceans had warmed then the amount of CO2 in the atmosphere would have risen anyway. That’s what the science says and that’s what’s happened historically.
Warmer planet, more plant growth. More plant growth, more organic decay. More organic decay, more CO2.
Warmer planet, more people. More people, more CO2 (respiration, and a host of other contributors). More people living then dying, more organic decay, more CO2.
Up to a point. There is an optimum temperature range for most biochemical reactions. That’s why reptiles sun themselves and find shade, and why endothermy evolved.
Around 36 to 38 degrees C seems to be the sweet spot for animals, so plants are probably similar.
I’m not a horticulture expert by any means. Photosynthesis uses light to make glucose. Respiration is used to make cells with that glucose (assuming other micronutrients are available). Crops have temp ranges best for both. Seed varieties for all kinds of temperature ranges, soil type, growing season length, etc.
CO2 helps in dry land farming (no irrigation) because of less water loss when “breathing”.
Believe me, 2 – 3 °C hotter won’t be a problem in most cases.
Don’t get caught up in “global warming” being on the Tmax side. It’s mostly on the Tmin side. The mantra of “the earth will turn into a flaming, boiling ball” pushed by the AGW crowd is just so much hooey.
Ahh, the joys of discarding information…
“More people living then dying,” lol, words have meaning… ‘then’ is very different than ‘than’. Your sentence is true, in that populations are increasing, so there are more deaths.
The only reason? What happened to Henry’s Law?
Al Gore once said the “the debate is over. The science is settled”. Well when was that debate? Is there a video of it? I think there was never a debate that was settled. The debate is ongoing at websites like WUWT. in my opinion when DJT takes office one of his priorities should be to arrange that debate with scientists on both sides invited. If one side refuses to debate then they automatically lose. I think the skeptics would easily win. That will shoot down one of the biggest issues of the left and reveal them for the crooks and nuts that they are.
All sounds great until the wrong team wins.
Deport the no shows, to Venezuela.
South Georgia Island.
CO2 emissions were considered to be pollution for all four years while Trump was President. Including the first two years when Republicans controlled BOTH Houses of Congress. Trump was a failure on climate change.
The Republican Party retained their majority in both the House and the Senate, and, with inauguration of Donald Trump on January 20, 2017, attained an overall federal government trifecta for the first time since the 109th Congress in 2005.
That Republican majority was made up of people like John McCain, who hated Trump and did everything in their power to thrwart what Trump was trying to do.
Then throw in the Democrats trying to impeach Trump and throwing lawsuits in the way of everything he tried to do.
Even so, Trump had the nation headed in the right direction, and maybe he will get a “do over” in 2025.
Our CO2 fixation may not have been felt as much in Trump’s Whitehouse because Trump had a million things on his plate.
Now that the Democrats are trying to spend TRILLIONS of dollars on the Green New Scam, Trump is going to be paying more attention to the issue. Trump says he is going to repurpose the funds for the Green New Scam into something useful like improving U.S. highways and roads.
I think Trump should make Dr. Happer the EPA administrator and then go after the EPA’s finding that CO2 is a pollutant and needs to be regulated. CO2 is not a pollutant at all. CO2 is a benign gas, essential for life on Earth, and there has never been any evicence that CO2 has any discernable effect on the Earth’s atmosphere and weather. The only discernable effect from more CO2 is a greening of Earth’s plant life.
A lot of the fairweather Republicans are gone from Congress now. There are very few anti-Trumpers left in the Republican Party and their influence is gone. Good riddance.
That’s good news for the rest of us as it means Trump will be able to get even more done this time than he did the last time.
Seems Trump pulled the USA out of the Paris Accord.
DJT should debate Commie Harris on national TV with this being the sole topic.
Separate more general observation. If climate science were really ‘settled’, we would not need all those academics still ‘studying it. We would not need all those expensive climate models. The fact that the recipients accept their climate funding shows how two faced the ‘settled science’ argument really is.
The ex-CEO of Australia’s CSIRO (Marshall?) actually did that a few years ago Rud –
he chopped the number of staff working on climate stuff because everyone said it was all settled.
He wanted more research done on new technologies etc.
Of course there were howls of anger & anguish from the climate catastrophists.
“two faced the ‘settled science’ argument really is”
It just means the ‘settled science’ argument is a silly trope which is wheeled out here from time to time, but doesn’t seriously exist elsewhere. There is a lot of stuff we know with varying degrees of confidence. We try to keep improving.
“We try to keep improving.”
Except you are not..
You are still stuck pushing all the erroneous crap of the AGW agenda.
And being a mindless shill for the wind industry and EVs
If anything, you are getting far worse.
‘There is a lot of stuff we know with varying degrees of confidence.’
Then it really isn’t known, is it?
Many on here e.g. Nick, and Greene and nail head and others prefer to skip over that part. Just pretend it is known and move on….
“It just means the ‘settled science’ argument is a silly trope which is wheeled out here from time to time, but doesn’t seriously exist elsewhere.”
You actually think the term “settled science” was invented here on WUWT!?!?
Nick knows better.
When was it that President Obama made the claim that Human-caused Climate Change was “settled science”? I think it was 2008, but it could have been 2012.
At any rate, when it comes to climate science, the Climate Alarmists have been claiming the “science is settled” for years and it’s just not possible that Nick has missed this.
Blaming it on WUWT is a distortion of, and a distraction from, the truth.
It was climate scammer Al $$$ Gore who said this back in 2007,
LINK
Ooops.
Yet 17 years later IPPC and many climate scammers seems to think it isn’t settled…. because they are in it for the money.
BWAHAHAHAHAHAHAHAHA!!!
Well, Gore isn’t a scientist. But he was referring to one particular scientific fact. He wasn’t saying that all science is settled.
Poor Nick…Back-peddling like crazy. Hilarious. !
Many of his fellow far-left climate shills have used the statement “the science is settled” wrt to the action of CO2 in the atmosphere.
Which it most certainly ISN’T
Nick is mistaking “DOGMA” for science… and is stuck with the DOGMA.
+100
Here’s the spectrum of the Earth’s emissions to space. See that big notch at about 15 microns, that’s the result of the absorption of light by CO2, that is settled.
0
For some reason WUWT didn’t like the image, here’s another try.
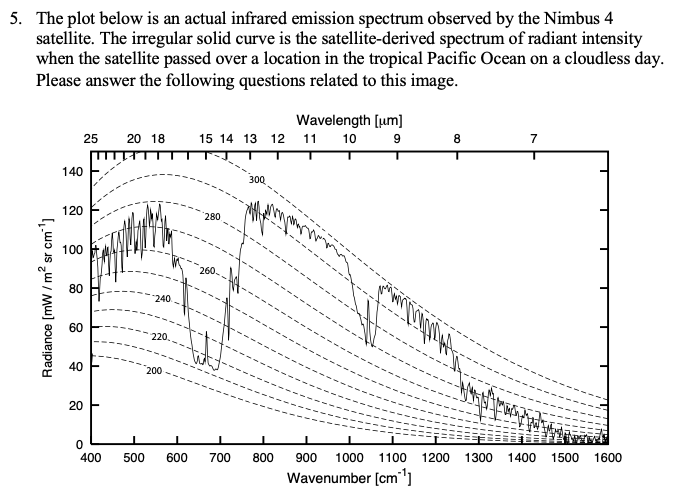
In this case the notch is around 700
HA HA HA, your deflection is clearly desperate because we both know that he was a main driver of the climate scam back in the 1980’s-2000’s before be fleeced enough $$$ from his dumb followers who was also then funding the bullshit and quoting many warmist/alarmist scientists modeling goober.
In reality science is NEVER settled but that is a reality you can’t understand because you are a fringe believer.
Nick isn’t a “fringe” believer..
He is a dyed-in-the-wool AGW climate tragic !
You can see what I mean about Nick et al skipping over important aspects of the scientific method.
Scientific fact…
”a truth known by actual experience or observation; something known to be true:”
Dear Nick et al, please stop referring to warming from anthropogenic co2 as a fact. For the love of GOD!
“He wasn’t saying that all science is settled.”
That’s so disingenuos. You know which science is being referred to.
Nobody is saying ALL science is settled. Some Climate Alarmists are saying climate science is settled, and you want to change the subject.
But it is so very Stokesian.
Nick sometimes posts an accurate statement.
It is unfortunate for him that he has earned such a negative reputation.
In this post, Nick is correct.
Nick seems to go after single details about how something is written but with completely disconnected comments.
Those who play the climate con game like to stick to a well rehearsed script to avoid any “tells”. When your career depends on defrauding the taxpayers you have to play your cards close to the vest.
A lot of stuff? But not enough to demand a reconstruction of the entire energy systems of the entire planet – costing hundreds of trillions- with massive disruption of civilization- probably causing riots and wars.
And the death of billions of humans and un-estimatable flora and fauna.
Your first improvement would be to stop averaging intensive properties. Apparently, you can’t do that.
Doing this with temperature is like going around the globe measuring the color of the ground at different points and saying “the average color of ground is x”. It’s meaningless. You can’t “add” color so how do you get a sum from which an average can be calculated? How do you “add” temperature? You can’t add the temperature on Pikes Peak with the temperature in Death Valley in order to get an “average” temperature either! If Point A and Point B have the same temperature does that mean that every point in between A and B have the same temperature? If not then what does the average of the temps at A and B mean?
Now I’m curious what the “average color” result would be.
Color = wavelength. Now I doubt how I understand green being peak visible solar wavelength and why leaves would be green to match if the color of objects is reflected not absorbed. Wikipedia I guess…
Color isn’t wavelength, wavelength is wavelength. My wife looks at a car and sees bright red while I see candy apple red. She sees purple and I see violet. Color is a response from the brain to the signal the rods and cones in the eye cause.
Wavelength is intensive because it doesn’t depend on the mass of the object emitting that wavelength. If you have object1 that is red clay and object2 that is brown clay you have different wavelengths being given off and their “color” depends on the person intercepting those wavelengths. You can’t somehow average the two wavelengths and come up with something in the middle because there is nothing in the middle. One is wavelength1 and the other wavelength2. There is no wavelength3 that is an average. And since everyone “sees” color differently you have no absolute values to average!
Temperature is very much the same. What is cold to me is warm to my wife. How do you average those? If I have a metal rod of temperature1 in my left hand and a second metal rod of temperature2 in my right hand there is no tempeature3 somewhere in the middle. There is just t1 and t2. The *temperature* is not mass dependent. I can’t add temp1 to temp2, divide by 2, and come up with a temp3 that exists.
Actually, you do. There are a number of colour charts (e.g. Pantone), colour wheels and digital colour sensors which allow very accurate colour matching. People might perceive and describe them differently, but they do have objectively measurable values.
You could also average RGB, CMYK or saturation values to give an “average colour”. That’s how gradient fills work.
Come to think of it, some of the graphics processing techniques might actually work for UHI compensation and site thermal drift detection.
Doubtful. You have to have a baseline to provide the compensation value. What baseline do you use?
There are 2 aspects to UHI, neither of which has been well quantified.
The first is point-in-time differences, the second is change over time.
For UHI compensation, the change over time is of more interest.
The homogenisation algorithms attempt to do this to some extent, but the somehow manage to oversimplify and overcomplicate at the same time. It would require a lot more information than just average temperature anomalies. At a minimum, min, max, building count and elevation for a grid of sites within a reasonably close range could give a proof of concept.
Enthalpy is obviously better than temperature, and the pressure and humidity information is available for a large number of sites. More granular time resolution would be needed as well – hourly is probably sufficient. Higher resolution temperature readings would be preferable, but that involves porcine aviation.
Basically, for any selected 100km x 100km grid
The temperatures could be re-based to the lowest temperature in the grid.
This gives a point-in-time view, which can be shown graphically. Isotherms are probably sufficient, possibly with colour shading.
Overlaying the point-in-time charts for a selected time period, or animating, gives a quick representation of changes. Time-based colour gradients would be useful as well.
Then we can get into 3D wireframes, probably for rate of change.
The homogenisation algorithms attempt to do something similar on a point-in-time and trend basis, but have very poor granularity.
Data visualisation wasn’t my field, so there are sure to be better ways to do this.
For my birds eye view, there must be absolute temperatures at lots of stations in large regions that can justify that growth. I’ve seen too many stations all over the globe that show no warming. The question is why!
That’s where data visualisation can help. It may not do a lot for the “why”, but could somewhat nail down the “where” and “how much”.
The point is not that you can’t average them, but what does the average mean. Does the average tell you anything about the colors you have averaged? Can different values end up with the same average?
What occurs is that you lose information when you average and only use the mean as a value. Without knowing the variance of the values being averaged from the mean, you simply don’t know anything! You can’t even know if spurious trends are being introduced.
Yep. Throwing away the measurement resolution can be even worse.
How does color matching help? What’s the average of color52 and color65 off of a chart? All you are saying is that you can measure wavelength very accurately using color matching tools. What is the average of wavelength35 and wavelength89? Does it even exist? How do you measure it?
Color and temperature are the same – intensive properties. Just because Tulsa, OK dirt is red55 and Topeka, KS dirt is brown31 that doesn’t mean that you can find a color in-between the two in El Dorado, KS. Even adding a pint of red65 dirt and pint of brown31 in a quart jar means you will come up with a color that is the average of the two. Just like with temperature. You can’t add 55F in Topeka and 64F in Tulsa and say the average temp of the two is 59.5F. There may be no place in between the two that is at 59.5F.
Averages throw away far too much information. Gradient fills can be quite useful, especially in conjunction with edge detection.
Pixelation can be a problem if the spatial resolution is poor 🙂
“It just means the ‘settled science’ argument is a silly trope which is wheeled out here from time to time, but doesn’t seriously exist elsewhere.”
That is simply not true. Climate Alarmists roll out the “settled science” all the time. They have for years. That’s why it is wheeled out here for comment.
“The Science is Settled” means “shutup skeptics!” The “Science is Settled” is a form of science censorship. It is meant to cut off dissent. And you pretend it doesnt seriously exist. You know it does. You’ve seen it for years, just like we have. President Obama even makes the claim.
You know better.
If you had a significant confidence you wouldn’t need to average different models to get an answer. One of them would be correct. If you can’t name the correct one, your confidence is only worth what a bluff in poker is.
This point occurs to me often. It’s another way that statists create dependents, and, hence, their support in return.
It is a SCAM!
Apparently, Rud, we need all those new studies and armies of “climate scientists” because “it’s worse than we thought!!!”
At least that’s what they keep telling us.
”More cowbell!!”
OMG. It is worse than we thought. If plants are that much more effective and we are still warming then we need to impose even more draconian measures on anthropometric contributions.
See? There is only downside to the climate emergency.
Yes we need more planetary greening to overcome that … oh wait! We already have more planetary greening, so it’s even worser than we thought!! It’s the worstest!!!
More good news. A few observations, first the science is settled nonsense. The only people who would proclaim the science is settled are the ones who have no more science to back up their claims. That is why they are singing the same song they were singing in the late 1990s. Second I really feel uncomfortable hearing that climate policy has been made primarily on climate models. Surely policy makers must have been using something more substantial than climate models to justify their policy decisions. Third I thought climate sensitivity to a doubling of CO2 was an input to the models not a result.
re: “climate sensitivity to a doubling of CO2 was an input to the models”: I think you will find that climate sensitivity itself is not fed into the models, but that the things that are fed into the models result in a climate sensitivity. Not that it makes much difference, because of the limited things that are fed into the models.
The amount of influence of any given parameter or partial differential is programmed into the cake.
Science is never settled or we wouldn’t need scientists anymore.
As a very good physics teacher once told me: “We have a distinct shortage of functions to explain observations.”
Climate policy has been made primarily on climate models.
And don’t call me Shirley.
I don’t see this as moving the needle much on CO2 sequestration. It looks like it was a closing of a discrepancy between two different measurement methods for plant CO2 respiration.
“The revelation that plants absorb 31% more CO₂ than previously estimated is a major blow to the models driving global climate policy.”
I normally wouldn’t bother responding to such a silly rant, but since a specific paper is being misused, well…
Firstly global primary production is a matter of plant physiology, which is not predicted by climate models, nor do they make use of it. The reason is that there are two fluxes locked in balance – photosynthesis and respiration. Only carbon that has been reduced by photosynthesis can be oxidised, and carbon that has been reduced must quite soon be oxidised in an oxygen atmosphere. They have been in stable balance for millennia (and no doubt much longer).
Misunderstanding of this is the basis for ignorant claims that human emissions are only 4% of total and can be neglected. The point is that human emissions do not have a corresponding reductive process (although a fraction go into the sea) and so they accumulate, which is where we are now.
GPP is hard to measure – oxygen isotope measures give about 120 GtC/year, satellite estimates 120-140. These people use a different tracer, carbonyl sulphide, and get 157 GtC/year. Maybe their method is better – time will tell. Nothing much hangs on it.
“The point is that human emissions do not have a corresponding reductive process (although a fraction go into the sea) and so they accumulate”
What complete and utter BS.
Plants have no way of tell what is human CO2 and what is natural.
As human CO2 is only 4% of the natural flux s it nearly all taken up into the natural carbon cycle.
It does not accumulate.. that is scientific garbage. !
The atmospheric CO2 concentration has been increasing, so that should account for accumulation. There probably isn’t sufficient isotopic discrimination in photosynthesis or methanogenesis to discriminate between combustion and respiration products, though.
Are you a chemist, chemical engineer? I agree with you in any case.
Nothing so grand, unfortunately.
First level chemistry and Agriculture for the Higher School Certificate, followed by some undergrad chemistry, decades ago. That was enough to be able to get the general gist of published papers.
Well, you seem to have a broad knowledge of chemistry, science, math, and logic and you explain your thinking clearly.
Thank you. My head will be too swelled to get through the door for the next couple of days 🙂
I should have a decent grasp of logic. That’s one of the foundations of computer science, which served me well for 30+ years. The rest is a combination of a decent STEM education and a life-long interest in those fields. There are certainly many people here with far deeper knowledge of many fields.
I think I often struggle with that aspect, so it’s nice to have another perspective.
You grasp the nature of equilibrium with time lapse involved.
Overall, it’s redox, but the increased concentration of the oxidised form of carbon, along with the a sufficient quantity of the reduced form of hydrogen (or oxidised form of hydrogen, if you prefer) has allowed the overall photosynthesis rate to increase to take advantage of this.
It appears to be a dynamic equilibrium situation, where the reduction is playing catchup with the increase in availability of the oxidised form.
Just as a pedant point, photosynthesis isn’t the only way to reduce oxidised carbon. Methanogenic archaea fully reduce the oxidised carbon, rather than the partial reduction of photosynthesis.
The increase in biomass partially offsets the combustion of carbon, hydrocarbons and carbohydrates by humans. As you have noted earlier, the rate of increase of atmospheric concentrations of completely oxidised carbon is considerably lower than was hypothesised.
You get it.
“dynamic equilibrium situation”
More CO2 means more “green”. An already proven fact based on satellite photo analysis. More “green” means more CO2 uptake. A dynamic equilibrium.
Stokes: “Firstly global primary production is a matter of plant physiology, which is not predicted by climate models, nor do they make use of it.”
That’s the whole point of the paper! The climate models SHOULD be making use of it.
This was Freeman Dyson’s main criticism of the climate models – they are no holistic at all! They do not look at the entire biosphere and the impacts that are all part of the whole.
Nick, I fully agree with you that the subject paper is not a ‘blow’ to the models, because they’re already dead. To summarize, they give disparate results, predict a non-existent mid-tropospheric ‘hot spot’ and, as Pat Frank has repeatedly demonstrated, can not provide physically meaningful results because the cumulative errors in the specification of cloud impacts far exceed the ‘forcing’ attributed to the incremental addition of anthropogenic CO2 at any stage of calculation.
My, you are so sensitive. It doesn’t sound like a rant to me.
Still not a counterpoint to offer, the article remains UNCHALLENGED.
I have put two very basic counterpoints
That depends on what time frame is under consideration. It’s net biomass, not just primary production (plant growth) which counts, and that seems to have increased over the last 20 years or more. There is also carbonate sequestration in shells.
The system is in dynamic equilibrium – sometimes production outstrips utilisation, and sometimes utilisation outstrips production. Deciduous trees and annual grasses are good examples on an annual scale.
Yes. And here you see that dynamic equilibrium in action. Before we started emitting, still the big fluxes of photosynthesis and oxidation. But here you see the story from 1000-1850 AD, where the fluxes were in almost balance, as they are constrained to be. And then how our emissions added and changed in proportion (with about 1/2 going into the sea):
Sorry, Nick. Why are there 2 cumulative emissions lines?
While I’m waiting for Nick to get back with the answer to this, it’s fairly apparent in the chart that the Law Dome figures are quite heavily smoothed (that’s the nature of ice cores), which rather limits the extent of hunting which occurs in dynamic equilibria.
Law Dome has high resolution, as you see when it follows closely Mauna Loa where they overlap.
There really isn’t much scope for hunting, since the regions are so diverse.
It doesn’t look to have especially high temporal resolution prior to about 1750.
Tambora, and to a lesser extent Krakatoa should have triggered hunting, which doesn’t really show.Perhaps the plant growth troughs were too small to really show up at the chart’s resolution.
There aren’t, in this plot. I do have other plots that include land clearing effects.
The curve immediately below the Law Dome/Mauna Loa curve certainly looks red on my monitor.
There’s only one, the red line.
Are we looking at the same chart?
There is
If the second line isn’t red, it’s unlabelled. I just want to know what it represents.
The red line at the bottom represents the cumulative emission of CO2, the upper lines represent the mass of CO2 in the atmosphere.
The green (Law Dome) and blue (Mauna Lau) are labelled, and spliced together around 1950.
The red line at the bottom is also labelled.
The other upper line appears red(dish) on my monitor. It’s either a second cumulative emissions line as I initially assumed, or it’s some unlabelled mystery. In either case, I would like to know what it represents.
It’s probably not a big deal, but it’s either there for a reason and should be labelled, or it’s something spurious and shouldn’t be there at all.
I know you’re trying to help, but that third line has me completely flummoxed 🙁
“Before we started emitting, still the big fluxes of photosynthesis and oxidation. “
The problem with trying to deduce something from a time series. If causes/effects are not in phase then it becomes difficult to deduce anything.
The growth in “green” simply can’t happen instantaneously with CO2 increases – but the growth *will* happen over time – thus bringing OC’s “dynamic equilibrium” into play.
If your models don’t even recognize that “green growth”, let alone utilize it, then their results will get progressively more detached from reality – which is exactly what is beginning to be recognized more and more.
How about a cumulative rainfall? All oceans will overflow 🙂
Missing are several CO2 peaks. WWII is one. 1820 is another. Further back are more.
This is just another hockey stick and is not accurate or representative.
The Carbon cycle models most likely use it. And their output is used in the GCMs as the input for future CO2 scenarios. RCP8.5 comes to mind.
Wiki’s article on RCP starts out:
“Representative Concentration Pathways (RCP) are climate change scenarios to project future greenhouse gas concentrations. These pathways (or trajectories) describe future greenhouse gas concentrations (not emissions) and have been formally adopted by the IPCC.”
The 8.5 is the gas concentration that will produce a forcing of 8.5 W/m2.
Wiki article.. ROFLMAO !!!!
Nick stoops to lowest level of science. !
RCPs are a mindless AGW fantasy, pertaining to absolutely nothing real.
There is no physical evidence of any “forcing” by any level of CO2.
Wiki. The world’s most trusted source for unbiased, accurate information.
As Roger Pielke and others have said in many published papers RCP8.5 and SSP5-8.5 are “implausible scenarios”
Will? Are you sure? Might, maybe ..
And the carbon cycle models try to calculate those concentrations using projected emissions as well as projected sinks.
Those are NOT counterpoints to the article.
They are deceitful and disingenuous attempts at avoidance.
The article remains unchallenged… Particularly by anything Nick Or his chum RG have posted.
Still no viable counterpoint against the published paper, how come you with that bulging PHD in your back pocket can’t do it?
That is what I am looking for from YOU and a couple others who think it is bad but doesn’t explain WHY thus the paper remains UNCHALLENGED.
Why can’t you just do it
They must use some form of information about CO2. Either they calculate it internally or are provided it as an input.
Why must it be balanced? The amount of green matter has been growing. Are you trying to say greenery contains no carbon? My cows that eat hay would disagree with you. Increased greenery means carbon is being sequestered.
“They must use some form of information about CO2. Either they calculate it internally or are provided it as an input.”
Or the models are useless because they are lacking primary input values.
Its a measure of how beneficial that CO2 is.
Whether the increase in atmospheric CO2 concentration be because of human activity or because of various inherent system dynamics, as some researchers have concluded, the CO2 sink activity is calculated as
emissions – atmospheric increase = sinks.
Atmospheric CO2, we are told, is constantly increasing. If we accept the measurement of atmospheric increase, it follows that if sinks are much larger than believed. emissions must also be much greater than believed. This being so, the conclusion that the results of emissions are markedly different than believed is certainly drawn into question.
Is there really anything in this new claim that should lead anyone to believe that the results of the known increase in atmospheric CO2 concentration is different than what has been believed?
There is a time lapse rate between emissions, increases, and sinks.
Just as there is a time lapse between temperature and CO2 and so many other things.
This is a multiple chaotic coupled dynamic energy system modelled on a 25km grid. Just how good can that be in projecting decades into the future?
They use multiple scenarios. What does that say about their understanding of today?
Yet we put the whole of human civilization in the balance?
Let’s stick to a few facts. The sawtooth shape of the Keeling curve is due to the disparity in hemisphere foliage. It caused a consistent annual fall of c 2ppm, a year’s growth, before climbing up again. So what chances do we have of achieving the same by ruining our economies? None whatever. There is no chance of checking the KC. So relax
The rate of CO2 increase follows the atmospheric ocean temperature .. (see chart)
We even see the surges at El Nino events, and the step change after those El Nino events..
More proof that CO2 increase is driven by temperature rises, NOT the other way round.
https://rclutz.com/2024/07/11/mid-2024-more-proof-temp-changes-drive-co2-changes/
“Plants Absorb 31% More CO₂ Than We Thought”
Because plants do a 30% better job, or because there are 30% more plants, or combo?
It seems to be a bit of both.
Plants grow better with higher CO2 concentrations, depending on other limiting factors.
They also require less water, which seems to be a factor in the increased vegetation cover in arid areas.
Good question.
My understanding is the analysis is on a per plant basis. If (repeat IF) I am correct, there is a multiplier effect due to the increased greening of the planet. If (repeat IF) the studies indicating plant respiration is more efficient with higher CO2 levels, then there is a divider offset involved.
Ooops,
And , more nonsense
story tip
https://www.wibw.com/2024/10/29/visit-baltimore-biden-will-announce-3-billion-reduce-carbon-emissions-us-ports/
It has been assumed that the Biden-Harris administration would commit as much money as they can before November 5th (Guy Fawkes Day).
A sure sign that they are totally intent on destroying the economy.
More WASTE of money that the USA could spend on its people, particularly the homeless.
Hopefully Trump will get in… and cut this BS spending immediately.
So much total CRAP to undo !!