by Dr. Joachim Dengler
This post is the second of two extracts from the paper Improvements and Extension of the Linear Carbon Sink Model.
Introduction – The linear carbon sink model has a limitation
The relation between CO2 Emission and resulting concentration of the last 65 years can be best understood with a simple top-down model, where the net sink effect, which is the difference between anthropogenic emissions and atmospheric CO2 concentration growth, is modelled with a linear function of atmospheric CO2 concentration as shown in Figure 1. It is important to note, that the net sink effect represents in fact the sum of all absorptions – oceanic, land plants, and phytoplankton — reduced by the natural emissions.
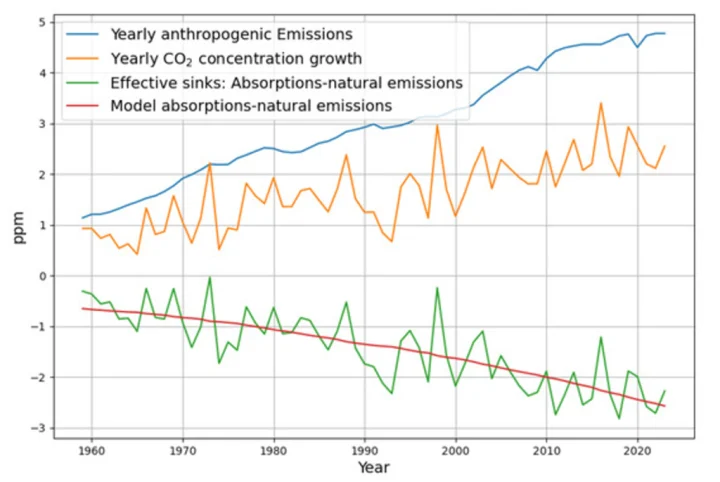
Figure 1. The measured yearly sampled time series of anthropogenic emissions and yearly CO2 concentration growth. Both effects are measured in or have been converted to ppm in order to guarantee comparability. Their difference is the growing carbon sink effect, modelled linearly by 0.018*C – 5.2 ppm, where C represents the CO2 concentration time series.
The interpretation of the model is that the proportionality factor of the linear relation is a sum of the unknown proportionality factors of all contributing absorption processes, such as photosynthesis of land plants, photosynthesis of phytoplankton, and the physical ocean absorption. It has been shown, that all these processes are approximately linear functions of atmospheric CO2 concentration, justifying that their proportionality factors can be added up. The constant of the linear model is interpreted as the natural emissions. Implicitly this assumes that natural emissions are considered to being approximately constant.
Extension of the Linear Sink Model
While the proportionality between absorption and concentration is physically very well founded, the assumption of constant natural emissions appears arbitrary. Effectively, this assumed constant contains the sum of all emissions except the explicit anthropogenic ones, but also all sinks that are balanced during the year. Therefore, it is enlightening to calculate the estimated natural emissions from the measured data and the linear carbon sink model as the residual after modelling the absorption as proportional to concentration. This is shown in Figure 2. The mean value of the estimated natural emissions results in the constant model term. Slight smoothing results in a periodic curve. Roy Spencer has attributed these fluctuations to El Niño.
Questions arise: why and how are sources or sinks dependent on El Niño? Why are these short-term temperature dependencies apparent, but long-term global temperature trends do not appear to have any correspondence in the model? Furthermore, it is not obvious whether the fluctuations are attributable to the absorptions or to the natural emissions. In order to find out more, we need to introduce temperature dependence into the model.

Figure 2. Residual natural emissions of linear sink model, their mean value, and the temporarily smoothed residual natural emissions. All are measured in ppm.
CO2 Concentration is a Proxy for Temperature
Why can the undeniable long term temperature trend not be seen in the simple linear model, which clearly shows short term temperature dependencies? Why is there no trend in the estimated natural emissions, which is implied by Henry’s law for the ocean sinks and emissions as well as by the temperature dependence of photosynthesis?
The answer has to do with the fact that CO2 concentration and global average temperature anomaly are highly correlated. We make no claim of causality nor any other dependence between CO2 concentration and temperature, in either direction, but just recognize their strong correlation for the last 65 years.
We can interpret the global temperature anomaly as the sum of a linear function of CO2 concentration and a zero mean residual temperature without trend. This is displayed in Figure 3.
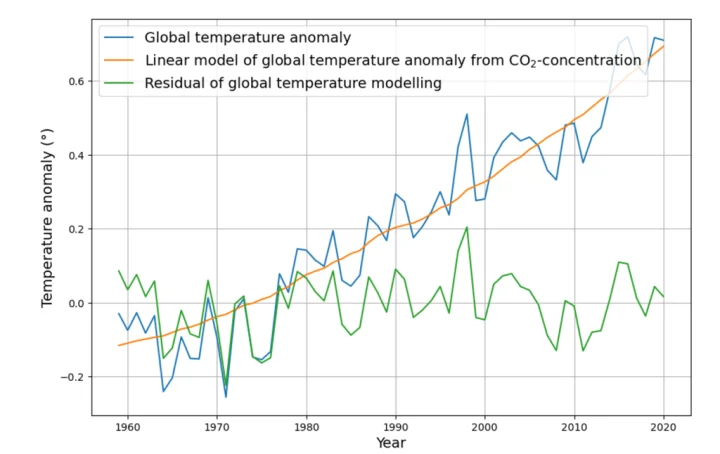
Figure 3. Temperature anomaly time series, measured in °, its linear model 0.0083 °/ppm*C – 2.72° from the CO2 concentration time series C, and the zero mean, no trend residual temperature (in order not to confuse anomalies with actual standardized temperature, the anomaly measurement unit is written here as ° instead of °C).
Consequences of the CO2 Temperature Proxy
The actual temperature is the sum of the modelled Temperature and the residual Temperature. Due to the fact, therefore, that the linear carbon sink model depends on CO2 concentration, the dependence on that part of the temperature, which is a linear function of CO2 concentration, is attributed to CO2 concentration.
In the case of temperature dependence, therefore we can only expect to see the dependence on the residual temperature, which is zero mean and has no trend. This corresponds to Roy Spencer’s observation that much of the short-term carbon sink variability is explained by El Niño, which is closely related to the residual global temperature. Nevertheless, this is an actual temperature dependency, hidden by the collinearity of CO2 concentration and temperature, but reconstructable by means of the measurable effect of the residual temperature.
Figure 4 shows that the residual global (sea surface) temperature does indeed explain much of the short term variability of the measurable sink effect. The smoothed sink residual is now mostly close to 0, with exception of the time around the Pinatubo eruption (after 1990), which is the most dominant not-accounted-for signal after application of the model extended by temperature.
The coefficient for the effect on the yearly sink from temperature is -2.9 ppm/°. This is quite large, considering, that the total yearly sink effect, which includes both concentration and temperature is currently 0.018*(420-280) ppm = 2.5 ppm. It also implies, that increasing temperature reduces the sink effect, which means, that increasing temperatures either reduce natural absorptions or increase natural emissions (or both).
Before drawing false conclusions, it must be stated, that the temperature effect on the carbon sink is cancelled by the increasing sink effect from concentration, for the time while temperature and concentration are correlated as they have been during the last 65 years.
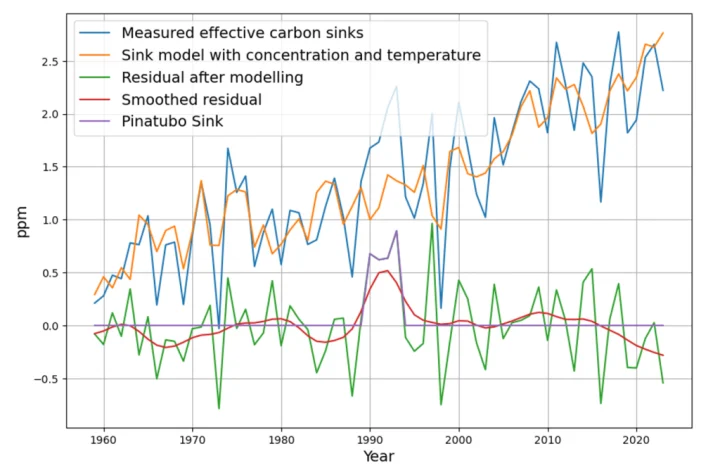
Figure 4. Improved modelling of measured sink effects by including residual sea surface temperature time series in the sink model in addition to CO2 concentration time series. The smoothed residual is further evaluated for identifying contingent events such as the consequences of the Pinatubo outbreak after 1990, which caused a temporary boost in photosynthesis. its actual sink effect is taken from the residual value, masked over the time where the smoothed residual exceeds the noise threshold.
When the temperature effect on sinks is so large and negative, we are forced to assume, that the concentration-related assumed “true” annual absorption rate is 4.36%, thus considerably more than the 1.83% of the simple linear model. (The exact calculations are in the original paper). The higher absorption is compensated by temperature-dependent emissions, the annual base level of which (13.6 ppm) is also much larger than the 5.2 ppm of the simple linear model. This extended model therefore reflects both the downwelling absorption in cold oceans as well as the upwelling emission in the warm oceans.
An important question is whether we have any indication that this rather high absorption rate can be justified by measurements. Due to the nuclear bomb tests in the 1950s, which stopped in 1963, we have a close-to-ideal identifiable carbon emission pulse that has been thoroughly investigated for more than 40 years. The resulting decreasing atmospheric 14𝐶-concentration shows, over a 30-year time period, that the contributing absorption sink processes exhibit an undistorted exponential decay of a first order linear differential equation. The decay time of the resulting concentration curve has been determined to be 15 years, implying a yearly downwelling rate of 1/15≈6.7%. Although a small part (<0.5%/year) of the 14𝐶 concentration reduction in the atmosphere is due to the dilution effect of concentration increase through anthropogenic emissions, this indeed confirms that a yearly absorption rate of 4.36% is plausible.
Reconstruction of CO2 concentration from the sink model
The model reconstruction of the concentration time series is now using a sink term containing temperature as well as concentration ((equation (18) in the paper).
The reconstruction is done by computing the modelled concentration growth from the difference of anthropogenic emissions and the modelled sink effect. From an initially known concentration value at the beginning of the time series all following concentration values are recursively computed using the modelled concentration growth. This evaluation is shown for the reconstruction in Figure 5.
The reconstruction only deviates around 1990 due to the missing sink contribution from the Pinatubo eruption, but follows the shape of the measured concentration curve precisely. This is an indication that the model using concentration and temperature is better suited to reconstruct the CO2 concentration than the simple sink model using only concentration. For compensating the deviations after 1990, the sink effect due to Pinatubo must be considered. It is introduced as a negative emission signal, i.e., an additional sink pulse into the recursive modelling (violet graph in Figure 4).
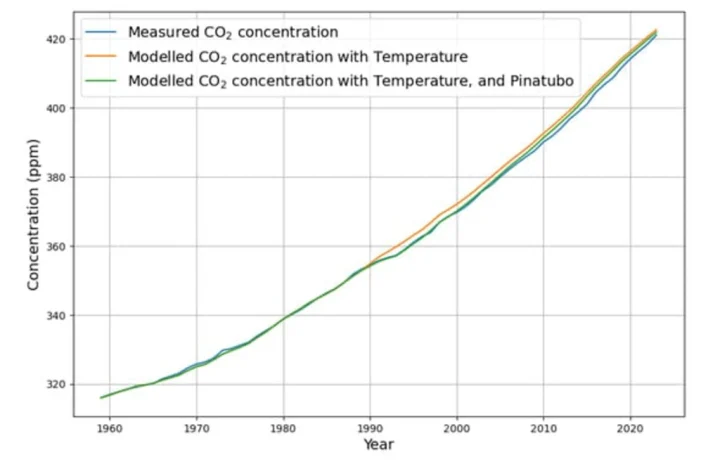
Figure 5. Reconstruction of measured CO2 concentration, measured with ppm, by extended sink model including dependency on CO2 concentration time series and sea surface temperature time series. Note that after 1990 the measured concentration decreases by a fixed amount caused by the Pinatubo eruption.
This reduces the deviations of the model from the measured concentration significantly according to the green graph in Figure 5. And the understanding of the processes shaping concentration is enhanced. Nevertheless, the model overestimates the CO2 concentration slightly after 2005. It looks that if natural sinks have a trend at all, it must be a trend to increase the sink effect in recent years rather than saturation.
Consequences of the Temperature Dependent Model
The concentration-dependent absorption parameter is now in fact more than twice as large as the original absorption parameter of the temperature independent model, and increasing temperature increases natural emissions. When temperature correlates with CO2 concentration, the two trends cancel each other out, and the total sink effect appears to be invariant with respect to temperature.
The extended model becomes relevant when temperature and CO2 concentration diverge.
If temperature rises faster than according to the described CO2 proxy relation, then we can expect a reduced sink effect, while with temperatures below the expected value of the CO2 proxy the sink effect will increase. We are therefore interested in situations, where there were no anthropogenic emissions as a contributing factor to CO2 concentration.
A Computational Model for the Vostok Ice Core Data
The Vostok ice core data provide a more than 400,000-year view into climate history, with several cycles between ice ages and warm periods.
Most researchers agree that CO2 data are lagging temperature data by several centuries. One difficulty arises from the necessity that CO2 is measured in gas bubbles, whereas temperature is determined from a deuterium proxy in the ice. Therefore, there is a different way of determining the age for the two parameters — for CO2, there is a “gas age”, whereas the temperature series is assigned an “ice age”. There are estimates of how much older the “ice age” is in comparison to the gas age. But there is uncertainty, so we expect the need to tune the time shift between the two time series.
In 2005, several teams made attempts to provide models of the Vostok data. There was no clear final result. There was not even full agreement about the causality question between temperature and CO2 concentration, although seven of the eight teams preferred temperature to be the cause of CO2 concentration changes, rather than the other way round.
It is difficult to assess the quality of their CO2 reconstruction from the provided figures, and no statistical quality assessment is given. From the description, it can be assumed that only the team proposing CO2 to be the cause of temperature changes used a similar model to the one used for investigating the current climate.
Preprocessing the Vostok Data Sets
In order to perform model-based computations with the two data sets, the original data must be converted into equally sampled data sets. This is done by means of linear interpolation. The sampling interval is chosen as 100 years, which is approximately the sampling interval of the temperature data set. Apart from this, the data sets must be reversed, and the sign of the time axis must be set to negative values. The two re-sampled data sets are shown superimposed in Figure 6.
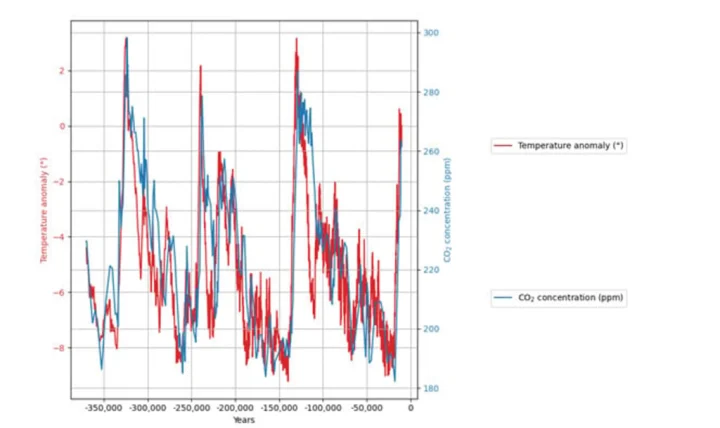
Figure 6. Resampled Vostok temperature anomalies time series, measured in °, and CO2 concentration time series data, measured in ppm.
Data Model
Due to the good modelling quality of the temperature-dependent sink model for current emissions, concentration, and temperature data, we will use the same model based on CO2 mass balance, and the possible linear dependence of CO2 growth on CO2 concentration and temperature, but obviously without any anthropogenic emissions. Also, the time unit is no longer a single year, but a century.
After estimating the three parameters, which are predicting the sink effect, concentration dependence, temperature dependence and a constant by means of ordinary least squares, the modelled CO2 data are recursively reconstructed by means of this model.
Reconstructed CO2 Data from Temperature
The standard deviation of the difference between the measured and the reconstructed CO2 concentration data measures the quality of the reconstruction. This standard deviation is minimized, when the temperature data is shifted 1450–1500 years to the past as displayed in Figure 7.
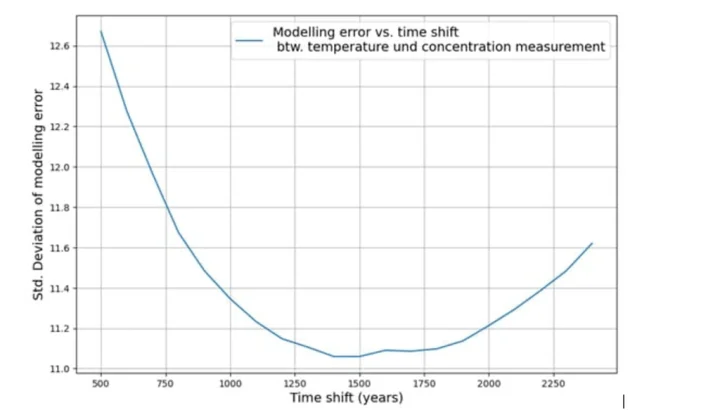
Figure 7. Measured model error as a function of time shift between earlier Vostok temperature time series and the later Vostok CO2 time series.
The corresponding estimated model results in a carbon sink effect of 1.3% of the concentration per century and a natural emission increase of 0.18 ppm per century from a 1 degree temperature increase. These are very small effects. Nevertheless, the reconstruction of CO2 data from the temperature-extended sink model looks quite remarkable, as displayed in Figure 8.
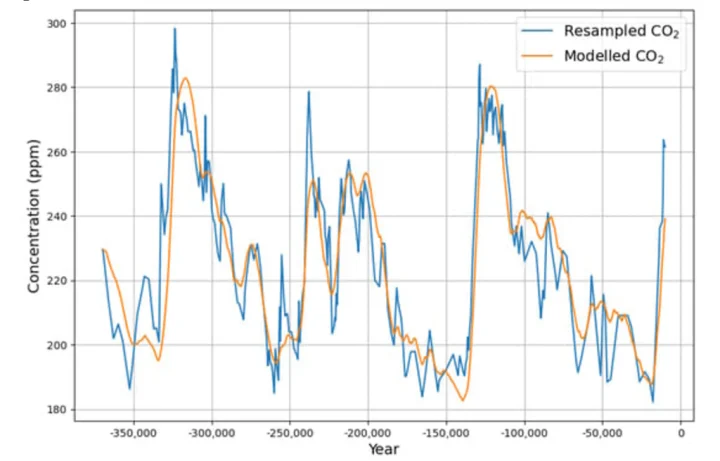
Figure 8. Reconstruction of Vostok CO2 concentration time series from temperature time series by means extended linear model.
The quality of reconstruction and the clear time-shift based error minimum are quite strong arguments for temperature changes being the cause of CO2 concentration changes rather than the other way round. But even today ice core data are used to motivate high CO2 sensitivity of 5 degrees or more.
Even if we tentatively accept CO2 being causal for temperature changes, the ice core argument has a big problem. Fact is, that the CO2 concentration range of the ice core data is between 200 ppm and 280 ppm, i.e. the factor between the maximum and the minimum is approximately 1.4. It is also a fact that since before the industrialization when concentration was 280 and today with a concentration of 420 ppm the factor is 1.5, and the temperature change is approximately 1.2 degrees. It is inconceivable therefore that such extreme temperature changes as between the ice ages were caused by such small CO2 concentration changes. The high sensitivity argument based on ice cores is therefore disqualified.
Conclusions
The apparent inconsistency between the sensitivity of the sink effects to short term temperature variations but invariance with respect to temperature trends has been resolved by identifying the collinearity between temperature trends and CO2 concentration. During the last 65 years the correlation between temperature and CO2 concentration has been very high. Consequently, all temperature trend dependence has been attributed to CO2 concentration in the original linear model. By evaluating the measured data with a model, where the residual temperature is added, the actual temperature dependence can be measured. By this procedure, the model is extended to become truly temperature-dependent. Further research is needed to validate the results of the extended model with other measurements.
The temperature-enhanced model also reproduces nicely the CO2 concentrations of the Vostok ice core data series. As a side effect, this confirms that in paleo-climate data series, temperature leads CO2 concentration.
With recent data, where there is a strong correlation between CO2 concentration and temperature, the temperature trend dependence is balanced; therefore, we have to accept that currently the anthropogenic emissions are the main visible driver of atmospheric CO2 concentration, while temperature effectively only adds some zero-mean variability.
Figure 6 shows something very important regarding the relationship between Temperature and CO2 but shows very little about the relationship between CO2 and Temperature.
The Left axis shows the temp anomaly in °C with a value range of 14°C between bottom and top of graph. (-10°C to + 4°C)
The right axis shows associated CO2 concentration ranging from appx 177ppm to 303ppm or a total change of 126ppm.
Today were at just over 421ppm CO2 or an increase of 120+/-ppm above the top of the Figure 6 chart.
If CO2 drove temperature to the same extent that temperature drove CO2 levels, according th the figure 6 graphic, the temperature anomaly should be +16°C
I prefer this chart… 🙂
Complete nonsense
A 1 degree C. change in ocean temperatures caused a 15 to 20 ppm change in atmospheric CO2 due to gradual outgassing or gradual absorption.
In that era, there were no manmade CO2 emissions. CO2 was only a slow, minor feedback to ocean temperature changes in 100000 year cycles related to planetary geometry.
What hat did you pull 16C out of?
Extrapolation of an extended chart projecting the ends to current levels at the same scale. Temperature does drive CO2 but CO2 doesn’t drive temperatures to the same extent
Or if I need to hold your hand…
Extend the height of the graph so CO2 levels can be depicted at current 421ppm levels at the same scale.
Extend the CO2 grid lines to the new 420 level
Extend the corresponding temperature anomaly grid lines to the new graph top.
Top anomaly grid line will be Between +14°C and +16°C when leveled with CO2
The only argument I might have is with your figure 7. Several other papers place the lag between 800-1200 years. Interestingly, those ranges correspond with the estimated deep thermohaline circulation time, which also provides an easily understood physical mechanism. There can be no doubt (based on limestone) that the oceans are the big carbon sink, and that in their Photic zone temperature plays a calcareous phytoplankton sink role.
Are you aware that the two time scales of CO2 and temperature measurements are different, and that it is not definitively known how they exactly relate to each other? Please check the references of the data source. So the result of figure 7 cannot be understood as a fixed number of years, but only as a proposed value for optimal alignment.
Joachim,
You are doing interesting and necessary studies that I do not want to criticise overall.
However, I suggest that the papers of Ernst-Georg Beck be included in your style of analysis.
https://www.researchgate.net/scientific-contributions/Ernst-Georg-Beck-2015573085
Beck wrote “More than 90,000 accurate chemical analyses of CO2 in air since 1812 are summarised. The historic chemical data reveal that changes in CO2 track changes in temperature, and therefore climate in contrast to the simple, monotonically increasing CO2 trend depicted in the post-1990 literature on climate-change.”
It is scientifically unforgivable to ignore these many analyses, which are likely to be quite accurate and able to be modelled with or without adjustment for confounding variables. They question the 280 ppm CO2 assumed for pre-industrial times.
The Mauna Loa “gold standard” CO2 concentrations are also filtered quite heavily. While the instruments used for recent analysis are excellent, each day there are observations culled from what is finally presented as representative. This creates a bias that researchers can ignore or to include, with consequences.
https://wattsupwiththat.com/2022/04/20/sorry-but-hard-science-is-not-done-this-way/
It is difficult to work with the mathematics of small numbers that vary over a small range when there is high uncertainty. That uncertainty increases when culling is used.
There is also uncertainty from the widely-used relation between radio isotopes like Oxygen-18 and Deuterium and past water temperatures. It is assumed that the water that is sampled for analysis, such as in melted ice core, is representative of some catchment volume that existed in the past. If that volume is not constant or representative, such uncertainty should be expressed and discussed. It is not enough to assume that since everyone uses this method, it must be accurate.
The late Dr. Beck did did a great deal of admirable “data archeology.” But most of the CO2 measurement data he found was unrepresentative of global average CO2 levels, because the measurements were taken in close proximity to large CO2 sources and/or sinks. Unfortunately, he could not or would not understand the limitations of the data, which led him to clearly wrong conclusions.
Here’s the best place to learn about it:
https://www.ferdinand-engelbeen.be/klimaat/beck_data.html
The “filtering” of Mauna Loa CO2 measurement data does not create bias, it removes bias. The measurement site is more than two miles above sealevel, on the typically windward side of Mauna Loa volcano. When there’s no offshore wind (“sea breeze”), there’s potential for the atmospheric samples to be contaminated with local anthropogenic sources, or even from volcanic gases. So those samples cannot be used.
Dave Burton,
Your comment reveals a large gap between our understandings of how science should work.
In essence, you are approving cherry picking, while I am against it.
The difference might arise from our past experiences. An example might come from my field of geochemistry for mineral exploration, where all geochemical analysis results (say in a stream sediment survey) had to be given similar importance because we did not know all of the mechanisms that caused variations.Then, at the later stage of calculation of the ore resources and reserves of an emerging new mine, there are mandatory requirements for reporting that arte a bit harsh on cherry picking, like time in jail.
Surely it is the same for (say) CO2 at Mauna Loa. We might think that we know confounding variables well enough to reject some. One of the harder problems in climate research is identification of confounding variables for statistical analysis, to the stage where several scientists, working independently, will deliver exactly the same classifications for accept or reject.
Besides, in the ideal world there is information in every piece of data from those samples that are often expensive to collect and so expensive to throw away, perhaps before all of their information has been recognised.
Geoff S
Discarding or declining to take data samples with known or reasonably suspected bias or contamination is not cherry-picking, it’s just trying to get the best quality data.
When we take surface air temperature measurements only in the shade within a louvered white Stevenson Screen, rather than with thermometers in the sunlight, it’s not cherry-picking, it’s just trying to get the best quality data.
When your doctor tells you to fast for at least 10 hours before your blood draw, he’s not cherry-picking, he trying to get the best quality data. That’s a good thing.
That is an important last sentence. You can stack a whole lot of perfectly accurate causal relations on top of shaky assumptions. And it also multiplies errors as one presumes the more people base their calculations on ‘certain’ assumptions it must be both more accurate AND certain.
I actually think that should be a priority lesson when discussing science/ bias.
Regarding the evaluations of Ernst Beck, I am often asked about this. I agree with Dave Burton that there is no one more competent about Beck’s evaluations than Ferdinand Engelbeen. If I understood it correctly, he even met Ernst Beck. So I can only refer to the link Dave Burton gave you.
Regarding culling, this is of minor importance when you do all your calculations with accompanying error estimates. For me as a physicist this has to be done with every estimation/calculation. If too many data points are missing, special estimation techniques have to be applied. At the end of the day you have to somehow live with the data you have.
How can something called “Effective Sinks” be declining while plant life is rising?
Yep, it is a major drawback of this explanation.
The whole carbon cycle has expanded… a lot… as shown by global greening.
So sinks must also be increasing.. a lot.
I have always interpreted this as a classical overdamped system. As CO2 concentration increases (from whatever source), CO2 sinks increase, but do not do so at a rate required to maintain equilibrium. Thus, CO2 concentrations increase. I.e., the carbon cycle expands.
But trees do not grow to the sky. At some point, concentration increases must taper off at which point the sinks will not only catch up, but concentrations will decrease faster than the underlying sinks decrease. I.e., the carbon cycle contracts.
What do you mean? In my article above effective sinks are not declining, but rising (being sinks, I have drawn them with negative sign). If you read the article, you will find that it is appr. 2% of CO2 concentration.
It would seem to this Mr. Layman, that through the last few decades have promoted any type of “change” as bad.
I remember when we were warned of a new ice age. (I don’t remember what was said to be the cause.)
Al Gore and “The Ozone Hole”. Man caused that with Freon used in AC. Lots of false claims. (Rabbits in New Zealand going blind?)
None of that “stuck to the wall” as an excuse to control Man.
Enter Man-caused “Global Warming” and CO2.
(Al Gore got rich off of that.)
We’re still suffering from the effects politically and economically of that BS.
What if the ice core record fails to capture large short term variations in atmospheric CO2?
As far as i know they do fail or i should say can’t a priori. And i remember reading they take an average of over a few 1000 years. It has something to do with the pressure element and that’s why they have to dig quite deep and cant differentiate enough between ice layers to get a short time frame estimate. I hope some more knowledgable people will chip in..
The temporal resolution of ice core data depends on the local snow accumulation rate. At sites with very high rates of snow accumulation, like Law Dome, the resolution can be as short as 10-15 years, because it doesn’t take long for enough snow to accumulate that its weight compacts it into firn, and then into solid ice.
However, the temporal resolution can be several centuries for sites which get much less snow, like Dome C and Vostok.
Does the fact that the temporal resolution of the ice core record is 100 years, answer your question?
And yet the rate of CO2 growth follows temperature very closely.
And
Mid 2024 More Proof Temp Changes Drive CO2 Changes | Science Matters (rclutz.com)
All that chart implies is that short term fluctuations in the rate of CO2 concentration change are related to and roughly follow short term temperature fluctuations — no doubt the same relationship would have applied long before the CO2 concentration started increasing significantly around late 1800s — but it says nothing about the causes of the overall longterm trends in both CO2 concentration and temperature since.
It shows that ocean atmospheric temperature controls the rate of CO2 rise.
We even get a small step increase in the general rate after El Nino surges, just like we get a step increase in temperatures.
There is no “human CO2” signature in the data.
That the rate of short-term CO2 fluctuations follow short-term temperature fluctuations does not prove that CO2 is not a greenhouse gas or that increases in greenhouse gases cannot affect the GAT or that the greenhouse effect does not exist or whatever is the supposed significance of those observations.
The atmospheric CO2 level in 1880 was around 280 ppm and today it is around 420ppm, there appears to be a ‘human CO2 signal’ there.
CO2 is a greenhouse gas and in theory doubling the atmospheric concentration would cause ~1.0C increase in the GAT, all else being equal.
Empirical observations cannot, for the time being at least, measure the effect of that increase because the climate is too complex, poorly observed and poorly understood.
A lot of assumptions there.mmm
Clutz is clueless
You two are dumb and dumber
Both claiming CO2 emissions do nothing
Trying to make conservatives appear to be fools.
Richard Greene wrote, “Both claiming CO2 emissions do nothing”
It is even worse than that, Richard. They do not merely claim that CO2 emissions do nothing, they claim that human CO2 emissions somehow just vanish. They pretend that adding CO2 to the atmosphere does not increase the amount of CO2 in the atmosphere.
They think that after we add 36.0 Gt (4.62 ppmv) of CO2 to the air there’s no more CO2 in the air than before we did so — or, rather, there would be no more CO2 in the air, were it not for natural sources just coincidentally adding CO2 at the same time.
It’s every bit as ridiculous and irrational as the IPCC’s homeopathic climatology:
I’m talking about the IPCC’s assumption that, only does CO2 in the air cause warming, but also that the mere memory by Gaia, of CO2 which was once in the air, also does,
That’s homeopathy.
“CO2 memory” is the basis of homeopathic climatology. Its promoters claim that it’s not the amount of CO2 which remains in the air that determines its warming effect, but, rather, the total amount which was ever emitted. They assert that the mere memory of CO2 once in the atmosphere still has just as much warming effect as the CO2 which remains.
Similarly, “water memory” is the basis of homeopathic medicine. Its promoters claim that “when you dissolve a substance in water, it still has the memory of the substance, no matter how many times you dilute the water afterward.” In fact, they believe that even mixtures diluted until not a single molecule of the supposed agent remains still have therapeutic effect.
In a rational world, such silliness could not persuade anyone, but that’s not the world we live in. Both branches of homeopathy have all the trappings of real science, including peer-reviewed “scientific” papers, published in journals run by top scientific publishers, like Elsevier.
They’re both very influential, too. Homeopathic climatology is the justification for “Net Zero,” and King Charles appointed a homeopath as Head of the Royal Medical Household.
Of course, the IPCC does not call it homeopathic climatology. They call it “RCB” (Remaining Carbon Budget) & “TCRE” (Transient Climate Response to Cumulative Emissions). They’re based on the assumption that natural CO2 removals from the air don’t matter, and temperatures are determined only by emissions. They assert (with “high confidence”) that the mere memory of CO2 once in the air has as much warming effect as CO2 which remains.
It is absolute crackpottery, just like denial of the fact that adding CO2 to the air increases the amount of CO2 in the air. They justify it in the same way, too: by noting an irrelevant correlation.
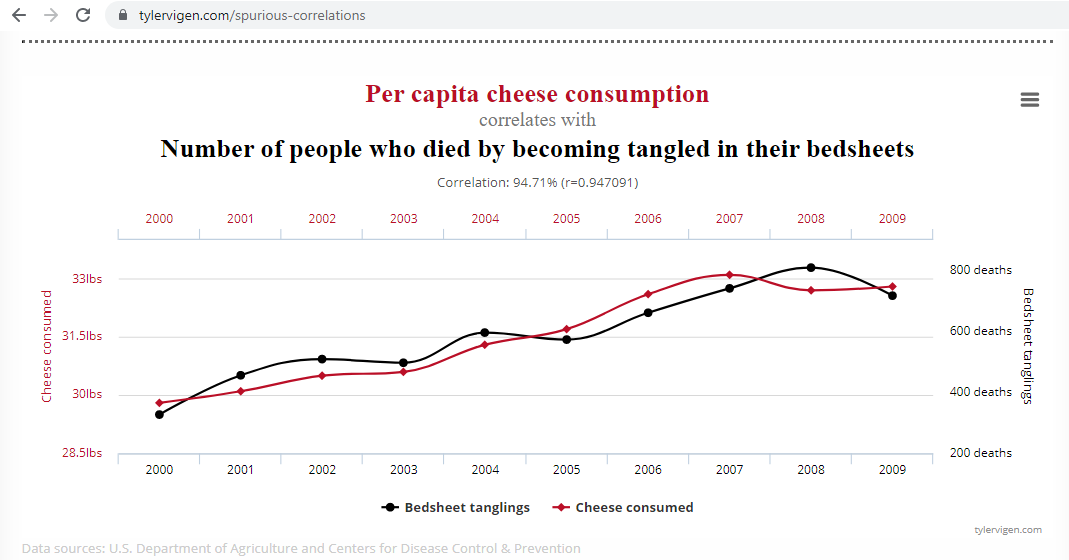
Of course, any two things which have both been increasing for the last 170 years are therefore correlated. That does not mean that one causes the other — especially since there’s no physical mechanism by which it could cause the other. It’s every bit as ridiculous as blaming bedsheet strangulation on cheese consumption.
https://www.google.com/search?q=bedsheet+strangulation+and+cheese+consumption
“therefore, we have to accept that currently the anthropogenic emissions are the main visible driver of atmospheric CO2 concentration, while temperature effectively only adds some zero-mean variability”
I don’t agree with this, after once thinking your model had promise, maybe some of it does.
In the following image the Mauna Loa monthly CO2 data is decomposed into yearly rising and sinking phases for each ‘carbon dioxide year’ since 1959, Oct-Sept, into a timeseries for each phase, as shown, including an annual net. My carbon dioxide year annual net CO2 plot looks a little different than the ones published by Scripps & NOAA due to this ‘year’ difference, but all data is accounted for.
In this analysis, it is assumed the annual man-made CO2 emissions (MME) sink at the same sinking rate of 80.8% for the average annual carbon dioxide year, as shown, ~=(1-.0066/.0346). Based on this assumption, the net ML rate is growing at a 2.5X faster rate than the net MME rate, ~=.028/.0111, indicating natural sources of CO2 are outstripping the MME growth handily.
“why and how are sources or sinks dependent on El Niño?”
El Niño arises from higher tropical Pacific ocean heat content, which has a significant lagged effect on ML CO2 anomalies due to both marine biology and surface solubility temperature dependence:
The main driver of ML CO2 growth has been ocean outgassing due to higher ocean temperatures and the growth of the ocean warm area ≥25.6°C, the nominal CO2 SST outgassing threshold:
“The main driver of ML CO2 growth has been ocean outgassing due to higher ocean temperatures and the growth of the ocean warm area ≥25.6°C, the nominal CO2 SST outgassing threshold:”
Several people coming to that same conclusion via slightly different methods.
The spike in CO2 rate or growth at El Nino events was the first clue, then the close coincidence, with a slight lag, of ocean atmospheric temperature from UAH and the rate of CO2 growth.
Human emissions, which are about 4% of the natural flux are swallowed in the general, and highly beneficial, enhancement of the global carbon cycle.
Maybe humans do contribute a small amount, if so.. well done humans. ! 🙂
“Human emissions, which are about 4% of the natural flux” BENASTY
Perpetually confused and fluxed up!
You always ignore natural CO2 absorption which is slightly larger than natural emissions in the annual, seasonal carbon cycle
Just like you pontificate on El Ninos, as an El Nino Nutter, and ignore La Ninas
Must make life easy to ignore all contradictory data, so you can spout wacky conclusions!
The increase of atmospheric CO2 is entirely from manmade CO2 emissions. Only stupid people deny that fact.
There are times, too many times, Richard, when points you make are totally ignored due to your propensity to insults. This is one of them.
And no. The increase of atmospheric CO2 is not ENTIRELY anthropogenic. Elevated temperatures, even fractions of degrees, affect emission rates of many things, principally the ocean.
What about reading my article again carefully? The increase of natural emissions as a function of temperature increase (2.9 ppm/°C) is the key point I am making in this contribution. But this is offset by an identical increase of the sink effect due to the increase of CO2 concentration, as long as temperature is correlated with CO2 concentration.
That’s wrong. You can’t just ignore the nearly 5 ppmv of fossil CO2 that mankind adds to the atmosphere each year. What do you think happens to it? Where do you think it goes?
The oceans both absorb and outgas CO2, continually, but they absorb more CO2 than they emit, so the atmospheric CO2 increase is not from ocean outgassing.
Mankind’s emissions have raised the atmospheric CO2 level by about 50%, i.e., from about 280 ppmv during the “preindustrial” late Little Ice Age to just over 420 ppmv now. That 50% increase means that CO2 molecules in the air are colliding with the ocean surface, raindrops, rivers, etc., 50% more often. That accelerates air-to-ocean CO2 movement by 50%.
In that same time period, average sea surface temperatures have increased by only about 1°C. That temperature increase has slowed air-to-ocean CO2 movement, according to the temperature dependence of Henry’s Law — but only by about 3%.
50% > 3%, which is why the oceans are net CO2 sinks, not sources.
The fact that the oceans are absorbing CO2 is confirmed by ocean chemistry. pCO2 and dissolved inorganic carbon in the upper layer of the ocean are increasing, and that has caused a slight but detectable decrease in pH.
Contrary to alarmist talking points, that slight pH decrease is not harmful, and does not make the oceans acidic. It’s only about 0.1 pH point, corresponding to a 26% increase in hydronium ion concentration. It’s dwarfed by natural seasonal & diurnal pH variation, pH variation with depth, and even pH differences between ocean basins, and it’s confined to the most caustic (alkaline) part of the ocean (the surface layer).
But it does prove that the oceans are taking up CO2.
Nature adds FAR more CO2 each year than humans do.
Bob’s work proves oceans are controlling the rate of increase of atmospheric CO2, not humans.
So much more CO2 in the oceans than in the air.
“Nature adds FAR more CO2 each year than humans do.” BENASTY
Humans add about 5 ppm CO2 a year
Nature absorbs about 2.5 ppm CO2 a year
BENASTY IS PRESIDENT OF the Dumb WUWT Posters Union
You will never try to answer the question, will you, benice? That’s because you cannot, and you don’t care enough about what’s true to be willing to admit that you were wrong.
I asked you:
“But Nature” is not an answer.
What happens to the nearly 5 ppmv of fossil CO2 that mankind adds to the atmosphere each year? Where do you think it goes?
The fact that Nature both adds & removes lots of CO2 each year is irrelevant. The fact which proves that Nature is a net remover of CO2 is that the amount of CO2 in the atmosphere is rising less each year than the amount of CO2 that we add to the atmosphere each year.
Think about this again. Yes, nature adds far more CO2 than humans.
But nature also absorbs absorbs more than it emits.
As long as there are no global catastrophies, Life is a net carbon sink:
https://klima-fakten.net/?p=8176&lang=en
This is a very important argument, it helps e.g. to debunk the stupid “cow farting” argument of the alarmists, which leads to terrible consequences, as the killing of cows in Ireland.
And oceans are also net sinks when the time interval 1 year is chosen, see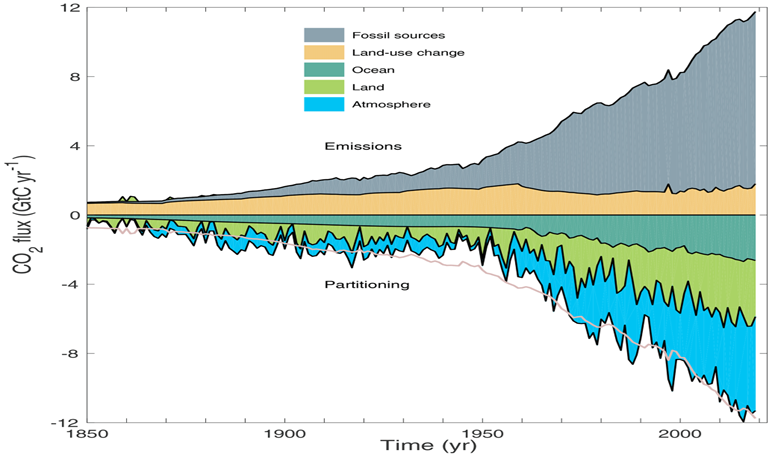
And oceans are also net sinks when the time interval 1 year is chosen, see
“a slight but detectable decrease in pH.”
Just, NO. !
The Aloha data is just part of a cycle.
and… Aloha data in green.
and a compendium of near surface pH measurements from 1900 onwards, shows no trend in ocean pH. (maybe even a slight rise)
The claimed 0.1 pH change is too small to measure
But BeNasty can, and will, ignore all data he does not like.
It is certainly challenging to measure long term ocean pH trends, because the slight long term trend is dwarfed by natural seasonal & diurnal pH variation, pH variation with depth, and even pH differences between ocean basins. But it is not impossible. That’s one of the reasons that some of the Argo floats now have pH sensors:
Claustre, H., et al (2020). Observing the global ocean with Biogeochemical-Argo. Annual Review of Marine Science, 12(1), 23-48. https://doi.org/10.1146/annurev-marine-010419-010956
Here’s a paper reporting measured pH trends:
Lauvset, S. K., et al (2015). Trends and drivers in global surface ocean pH over the past 30 years. Biogeosciences, 12(5), 1285-1298. https://doi.org/10.5194/bg-12-1285-2015
Here’s another, but the numbers they report seem implausible:
Landschützer, P., et al. (2021). OceanSODA-ETHZ: A global gridded data set of the surface ocean carbonate system. Earth System Science Data, 13(2), 777-794. https://doi.org/10.5194/essd-13-777-2021
You two should get a room..
You assume, without stating so, that the ocean is at equilibrium. It is not. Nothing in the atmosphere, oceans, land, sun, etc. are at equilbrium.
Proof: The planet rotates.
Proof: At equilibrium, there would be no weather.
Yes.
What else would we expect in our much-studied
“coupled, non-linear, chaotic system” ?
You left out dynamic.
I do not assume or believe that the ocean and air are in equilibrium w/r/t CO2.
If they were in equilibrium then the oceans would not be net carbon sinks, year after year.
The oceans are thought to contain about 50 times as much CO2 as the atmosphere. We’ve increased the amount of CO2 in the air by about 1100 Gt (140 ppmv), and we’ve increased the amount of CO2 in the oceans by only about 600 Gt. If they were in equilibrium, we would have increased the amount of CO2 in the oceans by about 50 times as much as we’ve increased it in the air.
How could you present so many charts and come up with such a wrong conclusion?
“The main driver of ML CO2 growth has been ocean outgassing”
BOB WEBER
Nature is a net CO2 absorber and has been a net CO2 absorber for billions of years. Oceans are part of nature.
Well, billions of years ago there was much more CO2 in the atmosphere. But only if you smooth over very, very long time periods was Nature consistently a net CO2 absorber. For instance, from LGM (20K years ago) to well into the Holocene Nature was not a net CO2 absorber, because CO2 levels were rising without human help.
However, we have reliable data which proves that, with the arguable exception of the strong El Nino year of 1973, every year since 1958 (when very precise CO2 measurements began) Nature has been a net CO2 absorber. The atmospheric CO2 increase is not from ocean outgassing.
I have always contended that, as good as it is, the ML measurements are lacking in vital data. No where is the ocean temperature included, either immediately off shore or at a distance, say 1km.
In addition, there is no metric for cloud cover included in the charts or temperature at the 11,000 feet elevation where the samples are collected.
In addition ML is a volcano. There is no data on any of the vents close or more remote.
The sampling, analysis, calibration, and all of the processing to get the dry mole concentration are exceptional. The criticism is not on that. It is the more they could do that should be done.
Your more or less identical comment is on Judith Curry’s blog: https://judithcurry.com/2024/08/25/extension-of-the-linear-carbon-sink-model-temperature-matters/
I answered it there.
Dr. Denger is absolutely correct that, “currently the anthropogenic emissions are the main visible driver of atmospheric CO2 concentration, while temperature effectively only adds some zero-mean variability.”
Anyone who wants to be taken seriously in the climate biz needs to accept that adding CO2 to the atmosphere increases the amount of CO2 in the atmosphere.
To be precise, 1 ppmv CO2 = 7.8024 Gt CO2 = 2.1294 PgC. So adding 7.8024 Gt of CO2 to the atmosphere increases the average atmospheric CO2 concentration by exactly 1 ppmv.
Based on GCB 2023 v1.1, over the 10 year period 2013-2022, inclusive, mankind added an average of 4.62 ppmv/year of fossil CO2 to the atmosphere (36.0 Gt/yr). That estimate is from economic data, and it’s pretty solid; I’d guesstimate probably within ±10%.
GCP also estimates that “land use changes” (clearing forests, draining swamps, etc.) added an average of 0.60 ppmv/year of non-fossil CO2 to the atmosphere, but that estimate is pretty rough.
But the amount of CO2 in the atmosphere increased by an average of only 2.42 ppmv/year (18.9 Gt/year).
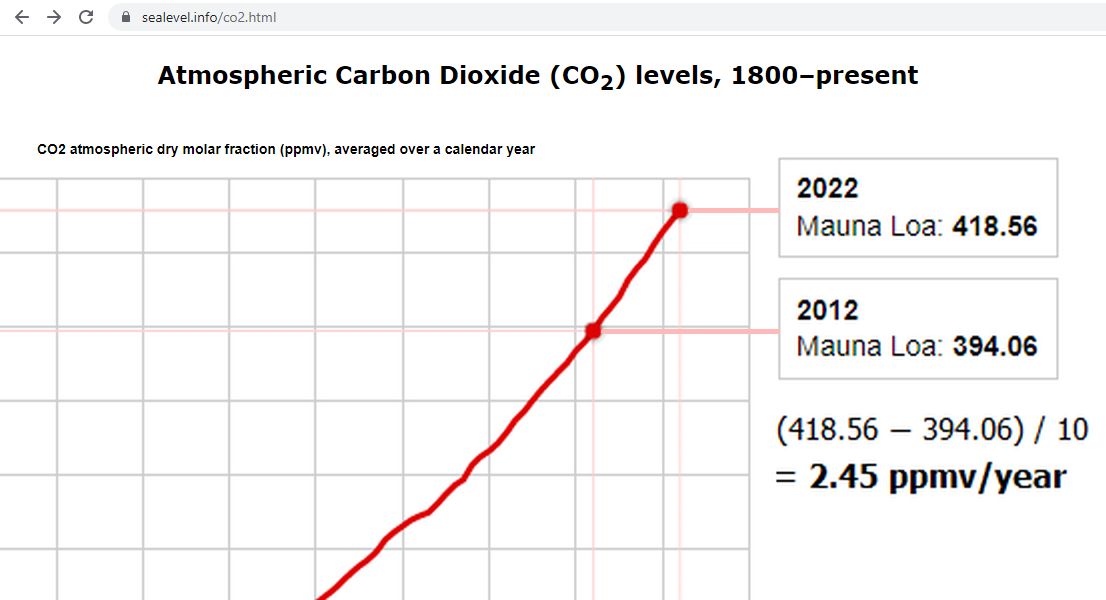
Or, if you compare average Mauna Loa CO2 level in 2012 to 2022, which is similar to using six month earlier data, you’ll find an almost identical average increase of 2.45 ppmv/year:
If you count “land use change” effects as part of natural CO2 fluxes, that means Nature (the net sum of all natural sinks and sources) removed an average of (4.62-2.42) = 2.20 ppmv per year. If you count “land use change” effects as human emissions, and if you accept that 0.60 ppmv/year estimate, then that means Nature removed an average of 2.80 ppmv per year.
That’s called a “mass balance” calculation, and it proves that Nature is removing CO2 from the atmosphere, not adding it.
I agree with your conclusion, Joachim! But please forgive me for “picking a couple of nits.”
Re: “…on that part of the temperature, which is a linear function of CO2 concentration…”
No part of temperature is a linear function of CO2 concentration. Additional CO2 has a logarithmically diminishing radiative forcing.
(The effect on temperature of radiative forcing also diminishes as temperature rises, because radiative cooling accelerates with the 4th power of absolute temperature, but that diminishment is minimal because the temperature changes are so slight.)
(Aside: we should not be surprised that as global/average temperatures rise, the Earth’s climates become more stable, rather than less — to the consternation of “tipping point” theorists.)
Re: “The coefficient for the effect on the yearly sink from temperature is -2.9 ppm/°. This is quite large…”
The temperature dependence of Henry’s Law tells us that for each 1°C water temperature increase we get about a 3% reduction in air-to-ocean CO2 flux.
However, the atmospheric CO2 concentration has increased by 50%, which causes a 50% acceleration in air-to-ocean CO2 flux. So, although short duration ENSO-driven variations in sea-surface temperatures do, indeed, cause noticeable variations in atmospheric CO2 level, over the long term the effect of temperature on CO2 level is very slight. That supports your conclusion that, “currently the anthropogenic emissions are the main visible driver of atmospheric CO2 concentration, while temperature effectively only adds some zero-mean variability.”
Re: “The decay time of the resulting [14C bomb spike] concentration curve has been determined to be 15 years…”
When the Limited Test Ban Treaty went into effect, exchanges with the oceans and other carbon reservoirs replaced atmospheric CO2 containing elevated radiocarbon with “normal” concentration 14C.
Additionally, the atmospheric CO2 level was by then rising by nearly 1 ppmv/year (due to additions of about 1.3 ppmv/yr from fossil fuel emissions, plus between 0.5 and 1.0 ppmv/yr from land use change effects, less about 1 ppmv due to removals by natural carbon sinks). The “fossil carbon” is depleted of 14C, so “Suess Effect” dilution also lowered Δ14C.
As a result of the combined effects of those two processes, the Δ14C bomb spike declined with a half-life of about 11 years. At first blush, that would appear to make the atmospheric lifetime 11/ln(2) = about 16 years.
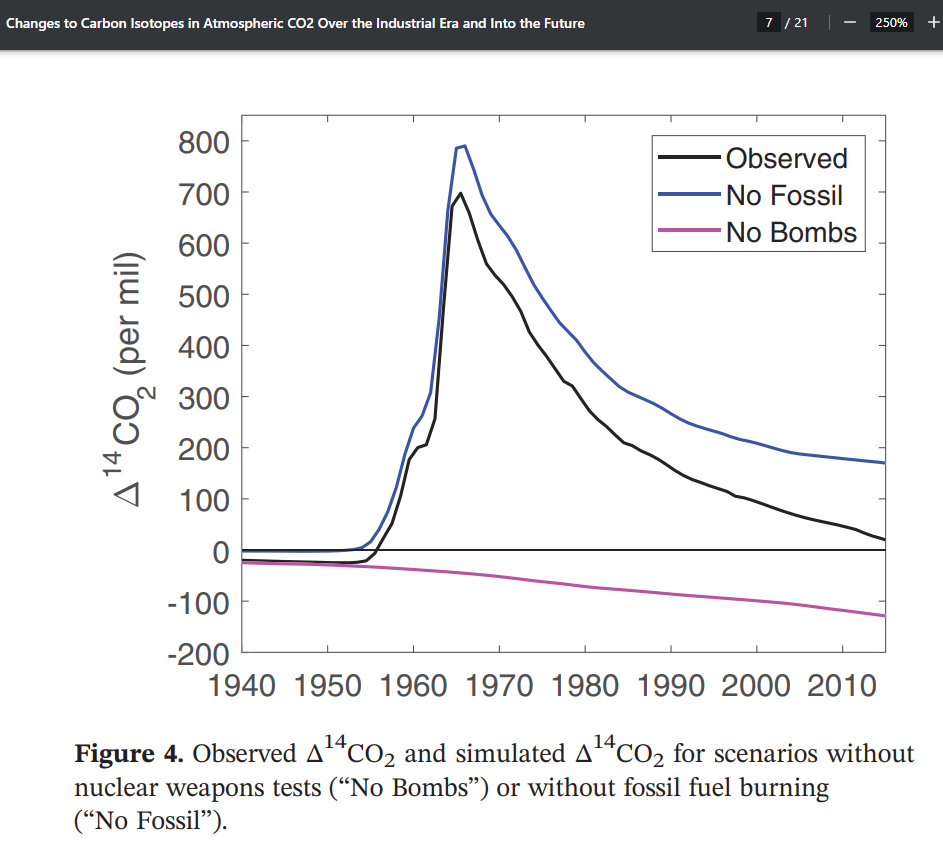
However, increasing the amount of CO2 in the atmosphere (by burning fossil fuels) reduces Δ14C without actually removing it from the air, it only reduces the fraction of carbon which is in the form of 14C. To calculate the actual average atmospheric lifetime of 14C added to the atmosphere by the bomb spike, we need to consider, instead, what the Δ14C decay rate would have been, were it not for Suess Effect dilution from fossil fuel use. Graven (2020) conducted simulations with a simple carbon cycle model, and reported a striking difference between the calculated 14CO2 decay with and without fossil fuel CO2 supply, as shown in their Figure 4:
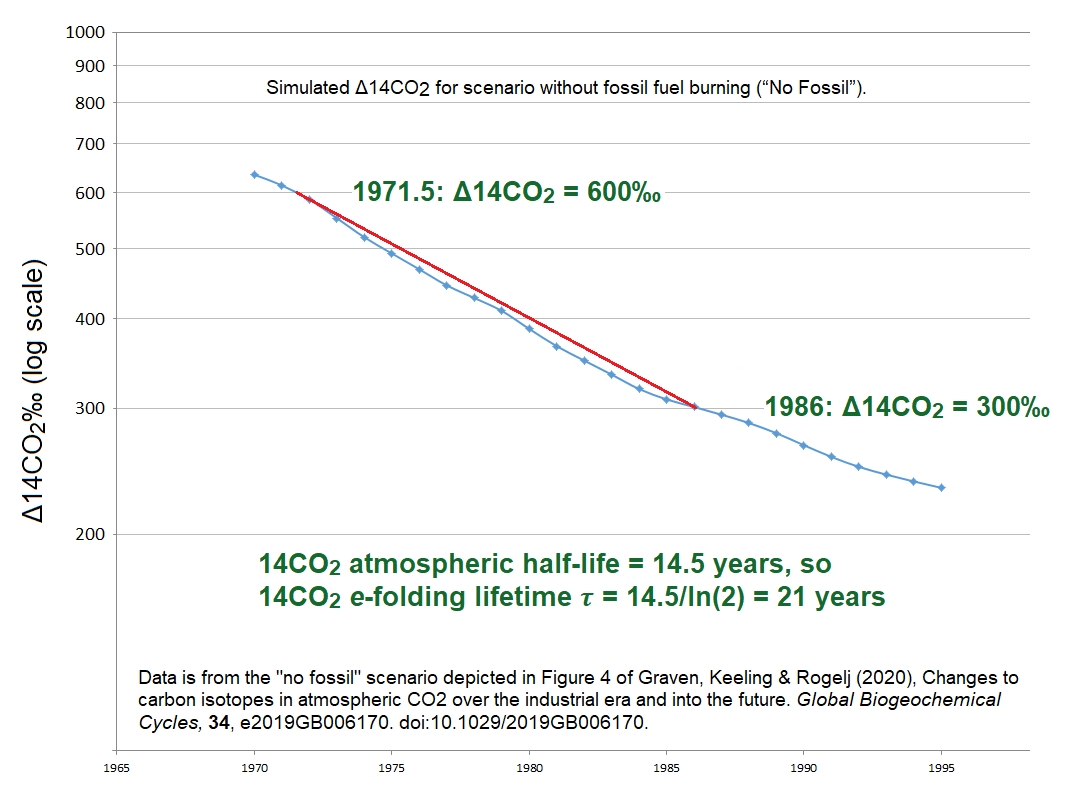
Dr. Graven graciously sent me their data, from which I constructed a log-linear plot:
As you can see, the average atmospheric lifetime of “bomb spike” radiocarbon was nearly 21 years. (Call it “about 20.”)
As this is identical to your comment in Judith Curry’s blog (https://judithcurry.com/2024/08/25/extension-of-the-linear-carbon-sink-model-temperature-matters/), I refer those interested in my answers to look there.
Anyone who wants to be taken seriously in the climate biz needs to accept that warming of the environment increases the amount of natural CO2 released (already 96%of total flux) considerably.
Even a small natural increase easily overpowers man’s puny efforts.
Don’t worry, you will NEVER be taken seriously, BENASTY. You are the thread’s court jester.
you need to go take a nap.
With all due respect, Mr Greene, you appear to be the threads Don Rickles
With how fast you hurl insults at other posters
Some people seem to get a kick out being an arsehole. Better ignore them altogether..
Well, nature is of course removing Co2 from the atmosphere. We have the 5% in greening as evidence. But i wouldnt actually reliably say that it is a net contributor or absorber. Or that we can reliably calculate the difference between natural and human. I dont find it very interesting anyway and i certainly would not get my hair in a twist about it..
tl;dr:
What we calculate is the difference between human emissions and the measured year-on-year change in the amount of CO2 in the air. That difference is positive, meaning that human emissions are greater than the change in the amount of CO2 in the air. That means Nature is a net remover of CO2.
Details:
We know, quite precisely, how much air is in the atmosphere, because we know what it weighs. (It is deduced from atmospheric pressure at sea-level, and the circumference of the Earth, adjusted to account for the volume of atmosphere displaced by land, water & ice above sea-level.) The Earth’s atmosphere is generally estimated to have a mass of about 5.1480e× 10^18 kg including water vapor, or a dry mass of 5.1352 ±0.0003 × 10^18 kg (because about 0.25% of the atmosphere’s mass is water vapor, which is 0.41% by molar fraction).
We know how the density of CO2 compares to the density of dry air (CO2 is 44.0095 g/mol, and dry air is 28.9647 g/mol.) So we can therefore precisely say what one ppmv of CO2 masses: 5.1352 Gt.
We also know how much CO2 is produced when a given amount of any of the common fossil fuels is burned:
CO2 is (12.0107 / 44.0095) = 27.29115% carbon by weight, so, for example, if you fully burn 1 tonne of 94% carbon anthracite coal, 0.94×44.0095/12.0107 = 3.444 tonnes of CO2 are emitted. (The best anthracite coal can be as high as 98% carbon; bituminous coal is about 70% carbon; lignite [“brown coal”] is only about 1/3 carbon, sometimes even less.)
Similarly, methane (CH4) is (12.0107 / (12.0107+(4×1.00797))) = 74.868±0.002% carbon, so if you burn 1 tonne of methane 0.74868×44.0095/12.0107 = 2.7433 tonnes of CO2 are emitted.
We also know (from economic data) approximately how much of each common type of fossil fuel is burned each year, so we know how much CO2 is produced from those fossil fuels. Here are the data:
https://globalcarbonbudgetdata.org/latest-data.html
So from that data we can calculate about how much CO2 is emitted by humans, each year, to an accuracy that I would guess to be about ±10%.
Since 1858 we also have very, very good measurements of actual CO2 levels in the air, and by comparing levels one year apart we can calculate, quite precisely, how much the CO2 level changed in one year.
What we find when we do all that arithmetic is that that human emissions are much greater than the change in the amount of CO2 in the air. That means Nature is a net remover of CO2.
Regarding CO2 isotopes and human vs natural sources see Net Isotopic Signature of Atmospheric CO2 Sources and Sinks: No Change since the Little Ice Age by Demetris Koutsoyiannis (2024)
My synopsis
https://rclutz.com/2024/03/20/humans-add-little-to-rising-co2-march-2024/
Koutsoyiannis and Clutz
Dumb and dumber CO2 Does Nothing Nutters who deny humans have increased atmospheric CO2 about 50% since 1850
Doing their best to make conservatives appear to be fools.
Possible studied the claptrap of Berry, Salby and Harde, the Three Stooges “97% Boys” of climate science!
“Doing their best to make conservatives appear to be fools.”
You seem to be achieving that on your own !!
Where does Richard Greene belong on this chart?
At the bottom.
In the comment section at Huffington Post.
Manmade CO2 emissions
about 5 ppm a year
Nature CO2 absorption
about (-2.5) ppm a year
Atmospheric CO2 increase
about +2.5 ppm a year
The author wastes 1000+ words but fails to refute th basic equation I just posted. He must get paid by the word.
Correlation is not causation.
And equations are of course always perfectly certain, especially in multi variable circumstances. By studying the climate we can deduce everything by simple arithmetic, right?😁.
Not really my cup of science..
I like the early satellite representations of CO2 distribution. It was clear that CO2 was more abundant downwind of sun warmed ocean surfaces beneath the subtropical high pressure cells in both hemispheres.The plumes of CO2 even shifted latitudinally with the seasons.
There are no plumes of CO2 downwind of major population centres.
That led me to the conclusion that our emissions are quickly absorbed by nearby vegetation. With CO2 being heavier than air it will remain near the surface long enough for plants to take advantage.
That is also consistent with the current observed greening.
I also think that Henry’s law is often incorrectly applied as if the ocean surface water is static. In reality there is much surface churning as CO2 poor surface water descends and deeper CO2 rich water rises to the surface. There is plenty of scope for changes in the rates of net emission or absorption in such a scenario which is why the lag between temperature and atmospheric CO2 seems to match the length of the thermohaline circulation.
My conclusion is that the whole carbon cycle is ocean driven with vegetation as the primary sink rather than the ocean.
The ocean shifts between net emission and net absorption depending on global cloudiness and the CO2 rate of absorption or emission from the thermohaline circulation.
We have seen significant variations in global cloudiness over the years which are most likely solar induced.
The ice core records appear not to be capturing large short term natural ocean driven changes in atmospheric CO2.
Reliance on those ice cores has been misleading us as to the extent of such large short term natural variability.
An interesting contribution, the CO2 plumes downwind of the sun warmed ocean.
TL;DR
From the simple linear model, if the sink in ppm is 0.018*C – 5.2, in the absence of anthropogenic emissions, the equilibrium concentration would be 5.2 / 0.018 = 289 ppm, which is relatively close to the assumed pre-industrial concentration of 280 ppm.
in Figure 3, the article claims that there is strong correlation between CO2 concentrations and temperature over the past 65 years (starting in 1959?), although analysis of the GISS temperature anomaly shows a declining anomaly from 1944 through 1976, and a strong increase thereafter. Temperature and CO2 concentrations are only strongly correlated after 1976, but not before.
Prior to that, there was a strong declining trend from 1898 through 1909, and an increasing trend from 1909 to 1944, although there were no CO2 measurements at Mauna Loa before 1958. Svante Arrhenius estimated the CO2 concentration as 300 ppm in 1896, and the early measurements at Mauna Loa were about 315 ppm in 1959, so the CO2 concentrations during this period could be estimated by interpolation.
If the net sink effect needs to be adjusted for the dependence of temperature on CO2 concentration, what would be the effect of incorporating the earlier temperature declines (1898 – 1909 and 1944 – 1959) into the overall sink equation?
Another question that might arise is what happens if the natural forces that caused the 1944 – 1976 temperature decline despite increasing CO2 concentrations cause another temperature decline in the future? Would this strengthen the net sink?
You wonder why I started 1959? That’s the year when the rather high quality CO2 concentration measurements began at Maona Loa. Unfortunately I see little point in asking what happened before that, because the calculations I made require
The measurement on temperature dependence of CO2 concentration growth requires a data qualitty in CO2 concentration growth which is simply not given in the data series before 1959.
And my investigations suggest, that while land use change hast been rather constant (and therefore mathematically irrelevant, it’s just a constant contribution of natural emissions) since 1950, it must have played a significant role in the first half of the 20th century. But the “measurements” of this period are extremly poor.
Also temperature data of 1900..1950 are of doubtful quality, there may also be manipulations.
To make a long story short – the data from the first half of the 20th century are so poor,
While your questions are absolutely valid and interesting, at this point of time I feel unable to extend the modelling to the first half of the 20th century.
The model imposes some constraint, and one day I hope to make a consistent extrapolation the modelling to the first part of the 20th century. In that case the temperature component independent of CO2 will have a big positive and a big negative bump, reflecting the temperature “anomaly” in the first half of the 20th century.
Article says:”… for the last 65 years…”
And there is the bugaboo. There is thousands of years where temp/CO2 go in opposite directions or have delays in following.
It is a matter of scientific honesty to account for the the data range, from which the conclusions are drawn. The conclusions from the VOSTOK ice core data are based on more than 400000 years.
I would just make a point with respect to the CO2 concentrations measured in the ice cores :
There is too much bias (by CO2 diffusion, etc.) and uncertaincy to conclude anything about the “unprecedented” current CO2 levels with respect to CO2 ice scores measurements.
Here is an example of a paper in which the authors discard 750ppm measured from 2.74 kyr bp old ice core sample and retain 280ppm for dubious reasons :
“The CO2 concentrations in the Siple Dome samples are therefore greater by up to 470 ppm (excess CO2), and clearly do not represent atmospheric values.”
(I bolded the text).
And what if it was actually the case as some proxi data from stomata have shown in other regions ?
https://digitalcommons.library.umaine.edu/cgi/viewcontent.cgi?article=1023&context=ers_facpub
“With recent data, where there is a strong correlation between CO2 concentration and temperature, the temperature trend dependence is balanced; therefore, we have to accept that currently the anthropogenic emissions are the main visible driver of atmospheric CO2 concentration, while temperature effectively only adds some zero-mean variability.”
Since when does correlation imply causation? Never in my book and relying on imprecise “global average temperature” over a relatively short period further raises doubts.
There a number of empirical and statistical studies based on instrumental records which found that CO2 lags temperature. Can the model explain these results?
What gives you reason to wrongly assume that I imply causation??? There are no claims about any causation – have you found a single word about e.g. greenhouse effect in the paper?
I only make use of the correlation mathematically, all it does is to help me to split temperature in 2 components, one which is linear dependent on CO2 concentration and the other which is not. The point of the paper is that the emission effect of the temperature component linear dependent on CO2 concentration cannot be distinguished from the sink effect from concentration: From the available data you cannot tell whether we have temperature dependent emissions and a larger absorption or a temperature independent sink effect. It is the behaviour of the second temperature component, which motivates the conclusion that the first interpretation is more likely.
You don’t imply, you said “we have to accept that currently the anthropogenic emissions are the main visible driver of atmospheric CO2 concentration“. This says that anthropogenic emission is the cause (i.e., driver) of atmospheric CO2 which ignores natural CO2 that is 95% of CO2 emissions and 95% of atmospheric CO2. Perhaps the wording is not what you meant.