From Dr Roy Spencer’s Global Warming
Roy W. Spencer, Ph. D.
The recent record-setting UAH satellite-based temperatures of the lower troposphere can be compared to a different combination of satellite MSU/AMSU channels which help to corroborate the temperature trends from our “lower tropospheric” (LT) combination of channels.
The three channels we use for LT are MSU channels 2 (“MT”), 3 (“TP”), and 4 (“LS”), (AMSU channels 5, 7, and 9). The primary channel used comes from “MT” (MSU channel 2 or AMSU channel 5), which has the largest weight:
LT = 1.538*MT – 0.548*TP + 0.01*LS
Here is a figure from our 2017 paper on Version 6 of our dataset, showing the three main temperature sounding channels and how they are combined for the LT product:

But we have also experimented with a weighted average of MSU channels 3 (“TP”) and 4 (“LS”), (AMSU channels 7 and 9), which produces an averaging kernel in the upper troposphere (nearly insensitive to stratospheric cooling in the tropics, but somewhat sensitive to stratospheric cooling in the extra-tropics where the tropopause [the boundary between troposphere and stratosphere] is lower). This provides an independent check on our LT synthesized channel, keeping in mind one is centered in the lower troposphere and the other is centered in the upper troposphere.
We noticed that last month (May, 2024) produced a record warm global average temperature in the tropopause channel (AMSU channel 7), so I decided to investigate. Combining channel 7 and 9 for an Upper Troposphere (UT) synthesized channel,
UT = 1.35*TP – 0.35*LS
The resulting vertical profile of weight in the atmosphere is the purple curve, below:

That UT synthesized channel produces the following temperature anomalies:

Note that for the global average, the synthesized UT channel reached record warm values in February, then March, then April, and then May, 2024.
In the tropics, March and then May produced records, but not by much… the 1997/98 El Nino produced upper tropospheric warmth nearly as strong as our recent El Nino.
If we look at just the extra-tropics (next chart) we see the northern latitudes had record warmth in March. But the southern latitudes May came in only 3rd warmest, behind September 2019, and November, 1988.

Note also that the global UT trend is the same as the lower tropospheric (LT) trend, +0.13 C/decade. Since the global UT has some small contamination from lower stratospheric cooling, the “true” UT value (if the stratospheric influence could be removed) would be somewhat warmer. By how much? I’m not sure… maybe +0.15 rather than +0.13 C/decade as an educated guess.
Taken together, I believe this shows that our traditional LT (lower tropospheric) temperature trends are basically corroborated by the other channels of MSU/AMSU.
Keep in mind that when John Christy and I compare these various trends to climate models, it is always apples-to-apples: the climate models’ atmospheric pressure level data are combined and weighted to approximate the same weighting functions as the satellite senses.
Thanks for going back and checking to see if other measurements either confirm or disprove what you are publishing. It’s refreshing to see.
I look at the numbers from temperature.global and Ryan Maue’s site climatlas.com to see if they have the same general trends as the UAH and they do. The temperature.global site seems to be ahead on the trend but when you put all three together, overall they show pretty much the same thing.
Good to see that Combined NH and SH combined as well as the Global Average is still running at 0.13°C per.decade or 1.3°C per century despite the added CO2 load in the last 20-30 years
It has increased to +0.15 C/decade.
Not “increased to” rather “reassessed as” using a different method. Words matter.
Nice to see this detail of the methods used. We’ve not had much from Dr Spencer for a while apart from the regular boilerplate monthly releases.
Many thanks.
It would be nice to see what TLS looks like too. How much has it cooled since the Mt Pinatubo downstep?
I’d really like to see how models compare to TLS in a similar way that was done for LT.
Since TLS is much less noisy than tropo, it is an interesting check on how well models are doing at matching real climate drift.
Disappointingly, there is still no overt acknowledgement of the uncertainty in the calculated anomalies. One can’t do a statistical test for significance without knowing the standard deviation of the population. That is, is the USA May anomaly (0.37) a meaningful difference from the Arctic May anomaly (0.38)? The numbers imply that the uncertainty is +/-0.005 deg C; however, I doubt that the calculations provide an estimate with that precision.
No, the uncertainty is substantially larger than that. So differences of a few hundredths of a degree are not statistically significant.
Thank you for the confirmation, Roy.
[Christy et al. 2003]
The uncertainty on monthly anomalies is ±0.20 C.
What fascinates me, is an annual temperature range (ATR) of only 2.24K (LT) and 1.7K (MT). That is opposed to almost 4K ATR for actual surface temperatures. Why is that important?
It affects the most fundamental concept of “climate science”, the idea of powerful feedbacks. As surface temperature (Ts) changes, there is also a change in outgoing longwave radiation (ORL). If the whole system (surface, troposphere) was seeing the same variation in temperature, you would expect a delta of 3.6W/m2 with clear skies for one Kelvin in delta temperature. At least climate science does, one could discuss this figure. Anyway..
The actual observed relation of dOLR/dTs is much smaller, like ~2W/m2. This would prove a powerful water vapor feedback, as many papers point.
On top of that, the troposphere is expected to show a negative lapse rate feedback. The assumption is that the variation in temperature within the troposphere was even stronger than at the surface. Under this consideration said ~2W/m2 would indicate an even stronger positive WV feedback.
The problem is, all this is based on assumptions and as pointed out above, the opposite is true. The variation in tropospheric temperature (dTa) is rather smaller than dTs. That already explains largely why dOLR/dTs is falling short of said 3.6W/m2.
The strong WV feedback “climate science” believes in is based on a misinterpretation.
https://greenhousedefect.com/the-holy-grail-of-ecs/the-incredibly-stupid-case-of-water-vapor-feedback
Somehow I doubt it’s “misinterpretation”.
For a reason, or just so..?
it’s not exactly comparable like dOLR/dTs, as this mixes the thermodynamic surface temperature with with radiated power OLR. Besides, the change in radiative equivalent power for 1K at warmer surfaces is greater than 1K aloft at cooler temperatures owing to the 4th power radiation relation to temperature.
It’s important to consider the actual dynamics of atmosphere decreases the observable radiative greenhouse effect. Without thermodynamics the surface radiative equivalent temperature would be about 80 W/m2 hotter, or a greenhouse effect of 240 W/m2 instead of the 160 W/m2 observed. Dynamics depletes the temperature difference between surface and the outgoing radiation.
Similarly, a hydrological sensitivity is limited by the change in temperature at the lifted condensation level, not the surface. This matters because of the approximately exponential change in vapor saturation with temperature increase.
Assuming the temperature at the cloud condensation level somehow increases, which is debatable, the change in saturated vapor pressure at cold cloud condensation levels is much less than that at the surface. Projected to the surface, the limiting change is 2% or 3% increase in precipitation per K (vs 7% increase in saturation per K surface).
I guess what you mean is the reduction of the lapse rate due to latent heat. Yes, if the lapse rate was larger, in the sense of a dry lapse rate, or even dry unstable lapse rate, the GHE was larger.
JCM.
Above the tropopause, there is very dil;ute CO2 in the air. Are there eneough CO2 molecules, energetically, to do anything much with it?
Also, with so few molecules, it takes little push to change the mathematical temperature. Not a major player except on paper?
Weighted…
A fiddle favtor
Ffs
factor
the weighting is chosen to obtain an averaging kernel (synthesized weighting function) that has sensitivity to the desired altitudes. It’s similar to beam forming on communications satellites to maximize power over certain geographic areas.
SOI is falling. La Niña will be delayed.

But the subsurface water is there just waiting… http://www.bom.gov.au/climate/enso/#tabs=Pacific-Ocean&pacific=Sea-sub%E2%80%93surface
Not quite, currently the subsurface wave is weakening.

The real La Niña will develop only at the beginning of the next solar cycle.
I don’t ever remember seeing a correlation between solar cycles and El Nino/La Nina. Do you have a source for that? Not arguing, but curious.
“In the tropics, March and then May produced records, but not by much… the 1997/98 El Nino produced upper tropospheric warmth nearly as strong as our recent El Nino.”
This fact should give pause to all the special pleading regarding the cause of the ’23/’24 El Niño, ideas like the HT-HH upper atmosphere water vapor injection or the reduction in SO2 since 2020, things like that, ie, special circumstances, that weren’t ever used to explain the ’97/’98 El Niño.
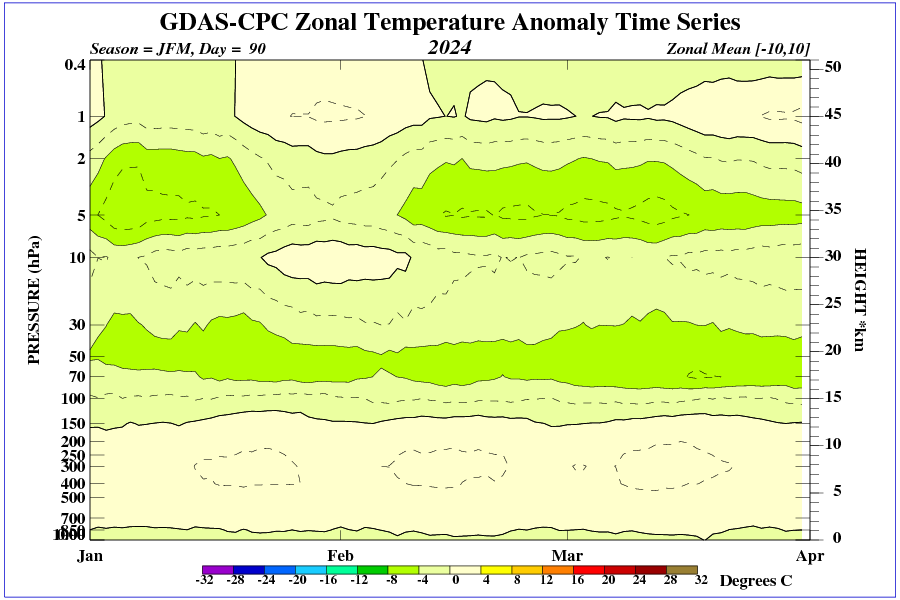
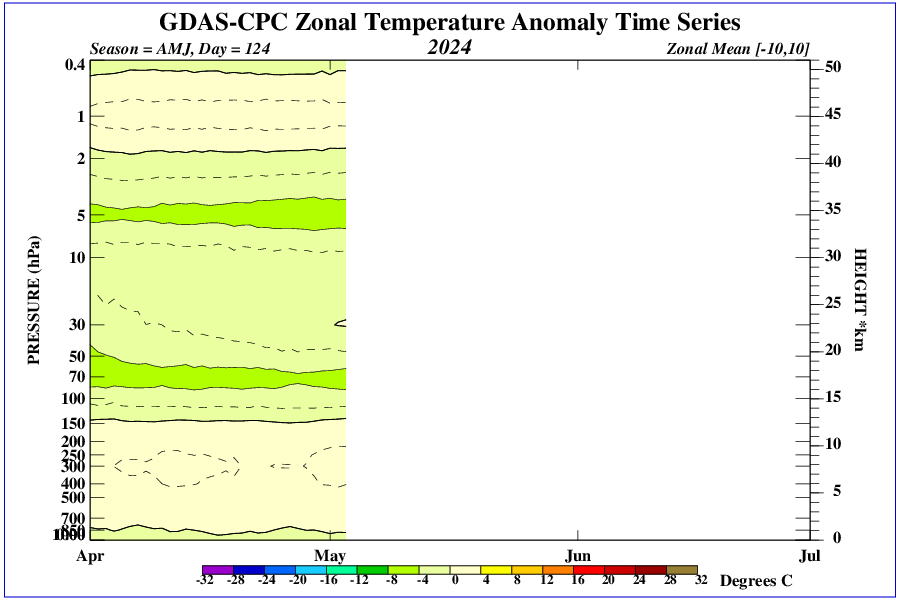
Everything agrees, only why the temperature a kilometer above the surface from -10 to 10 degrees latitude has not increased?
Graphic indicates weakening of zonal winds over the equator. What is the cause?
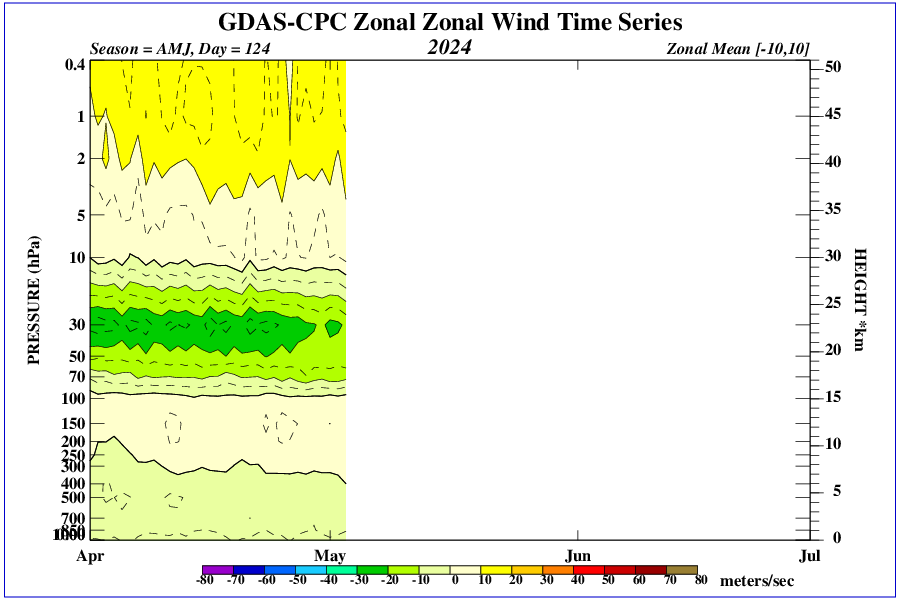
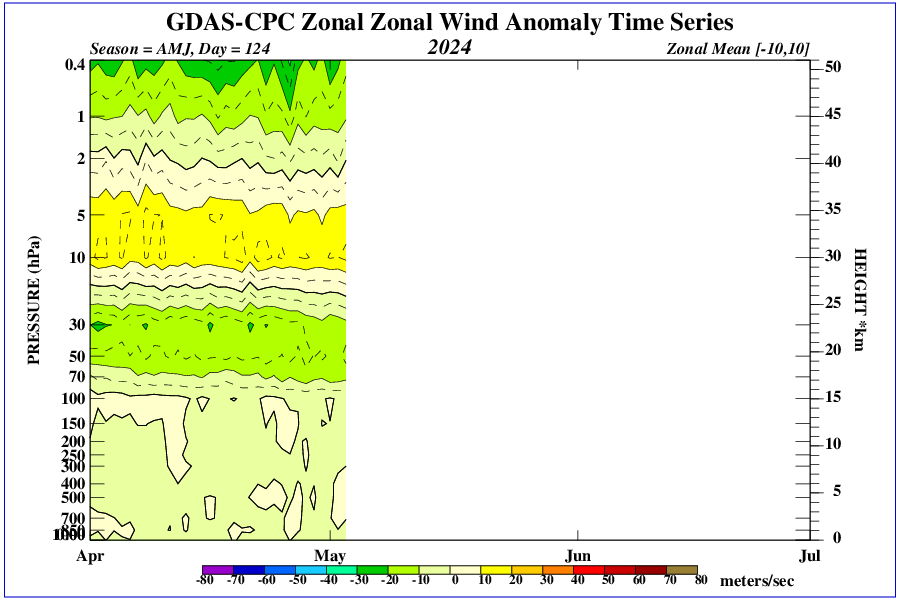
Is the cause a stronger anomaly in the lower stratosphere?
https://www.globeair.com/g/zonal-wind
So, did anyone else notice the dramatic temperature increase after the Hunga Tonga eruption?
I would say the recent temperature increases are uniquely and heavily influenced by 4.5+ billion gallons of sea water injected high into the stratosphere, resulting in its cooling, thus shrinking of the stratosphere and the resulting increased tropopause height, providing more heat as a result.
Good to see the recent drop off temperatures, which is also an expected result of the Hunga Tonga eruption as all that moisture eventually finds its way out of the stratosphere…no one knows for certain how long that excess moisture will remain, but it seems to be tailing off already.
Anyway, I am surprised there has been no mention of this tremendous and obvious input to worldwide temperatures…
Quoting Benjamin Zycher* Senior Fellow, American Enterprise Institute May 28, 2024:
Water vapor by far is the most important GHG in terms of the radiative (warming) properties of the troposphere; but no one refers to water vapor as a “pollutant.” But why not? Is it because ocean evaporation is a natural process? So are volcanic eruptions, from which are emitted vast quantities of aerosols, mercury, particulates, and other real pollutants. Significant amounts of water vapor also are emitted by some volcanic eruptions; the most important recent example is the eruption of Hunga Tonga in January 2022, one result of which was an increase of 10 percent in stratospheric water vapor in a single day. That impact is likely to yield some cooling in the stratosphere due to stronger infrared emissions outward and increased surface warming due to stronger water vapor emissions into the tropopause and troposphere.
Many thanks, Roy. Are you able to work out what effect if any Hunga Tonga has had and/or is having?
I, at first glance, would direct you to that big drop in 2022 in the SH chart… However that drop started Prior to the Dec 2021 eruption and only bottomed out just after the eruption
But the increase in temps following the eruption could be attributable to added H2O vapor added to the upper atmosphere
Help me understand the concern with the temperature at the top of the troposphere. My understanding is that the temperature at the top of the troposphere is between -50 and -60 degrees Celsius. I don’t understand why we should be concerned if the top of the troposphere warms a couple degrees.
The signature of this El-Nino period is different than any other, other factors are at play in this warming episode. Civil aviation pumps 50 – 80 billion gallons of water in the stratosphere every year, HT bumped that up significantly. It takes about 3 years for the water vapor to ride the heat flux to the top. HT could prove that global aviation is the cause of global warming via a continuous and northerly increasing density in the feed of anthropogenic water vapor in the stratosphere.
Stop flying jets for 3 years, and basic atmospheric physics implies that the world will cool.
Well I am confused. If you are plotting actual real measurements via radiosonde, and it is substantially cooler than all your satellite trends, they how in the name of so called science can you place any “weight” whatsoever on the satellite data?
The Lower Troposphere trend is stated to be 0.13C/decade and the graph of the radiosonde data shows a similar value from the surface to 10km so where do you get “substantially cooler” from?