By Andy May
Wow! Our new paper “Carbon Dioxide and a Warming Climate are not problems,” in the American Journal of Economics and Sociology has struck a nerve, judging by the traffic about it on twitter. An anonymous twitter troll who calls himself “Bonus @TheDisproof” has published what he (or she) calls a list of errors in our paper that is getting a lot of views and likes from the usual alarmist suspects, some of whom are probably actually people as opposed to “bots.” One person who has reposted the “Bonus” critique is Michael Mann. Michael Mann says, “This article is a Crok.” I don’t think he was complementing my co-author Marcel Crok, but then Mann is well known for crude and juvenile remarks. Mann might still remember Marcel for his 2005 award-winning article about Mann’s notorious hockey stick graph. Marcel was the first who wrote extensively about the critique of McIntyre and McKitrick on this graph.
I’ve tried answering most of Bonus’s criticisms on twitter, but the responses keep disappearing. Not sure what is going on there. Normally answering an anonymous troll isn’t worth the bother but judging from my email and phone calls about this one, I should. So, this post addresses his list of complaints to date. I’ll indent the complaints and number them.
Bonus:
“A new climate denial paper in an obscure low impact, non-climate related journal has popped up. It is written by Marcel Crok @marcelcrok & Andy May @Andy_May_Writer, both of which spread disinfo on a regular basis. I’ll go through just some of their multiple errors here.”
First of all, I don’t know of any disinformation that either Marcel or I have posted anywhere. All our posts and the paper are solidly supported by references and/or data. Bonus’s list of “errors” follows.
Bonus #1
“Their paper falsely claims “. Sea level rise is currently a very modest two millimeters per year”. They cite their own non peer reviewed source (A Clintel climate denial “report”) but omit that both tide gauges AND satellite data shows a faster rate and an accelerating rate.”
First of all, the Clintel Report we cite, “The Frozen Climate Views of the IPCC: An Analysis of AR6” was extensively peer-reviewed by a team of four independent reviewers as well as the eight named authors of the chapters. There were also two other members of the Clintel team that helped review selected chapters. The Clintel team reside in 8 countries and work in academia, government, and industry. Their professions cover numerous disciplines including economics, geology, meteorology, chemistry, physics, molecular biology, atmospheric physics, and climatology. See the book for more details.
There are two chapters in the book that deal with sea level, one by Kip Hansen and the other by Ole Humlum. Both agree, along with those who peer-reviewed the work, that the rate of sea-level rise over the past 150 years or so is about 1-2 mm/year according to tide gauges. It varies up and down cyclically over the 150-year period, so one can (and some do) cherry-pick intervals in an attempt to show acceleration, but no definitive acceleration is apparent in the record, at least on climate scale periods of time. One reason is that the data, whether satellite or tide gauge, is not accurate enough at the present very slow rate of sea level rise to be definitive, as discussed in the book.
Sea level fell during the Little Ice Age as more and more water was taken up to enlarge glaciers and the ice caps during that very cold period. When the Little Ice Age ended around 1850, the expanded glaciers began to melt, and sea level began to rise. This is all normal. The overall rate of increase was between 0.8 and 1.95 (very likely range) mm/year according to AR6 Chapter 9 (IPCC, 2021, p. 1287) and other sources.
More recently we gained the ability to estimate sea level using satellites. Problems reconciling the satellite measurements and the tide gauge records have made sea level rise estimates difficult since the first satellite data became available in 1992. A much more detailed discussion is available in Chapters 5 and 10 in the “The Frozen Climate Views…” (Crok & May, 2023).
Bonus #2
“They cited just two climate proxy papers Vinther et al 2009 and Rosenthal et al 2003 [sic] and attempted a cherry pick. But they ignored that Vinther et al uses data that ends decades ago so omits the rapid and significant warming in Greenland since then.”
The two temperature proxy papers we cite are (Vinther, et al., 2009) and (Rosenthal, Linsley, & Oppo, 2013). We plotted the entire proxy record from both sources back to the beginning of the Holocene approximately 9,000BC, nothing was cherry-picked. Vinther and Rosenthal’s data ends in the early to mid-20th century because the proxies for later than that haven’t formed yet. The Greenland ice is still snow or firn and the animal shells in the Makassar Strait that Rosenthal used are not stabilized in the ocean floor sediments yet. This is how all proxies work. The only way to incorporate modern temperatures into the graph is to mix instrumental data with the proxies which must be done very carefully for number of reasons, the modern data must be made to conform to the proxy dataset. We did this in our figure 4 from (May & Crok, 2024), shown below.

To validly compare proxies to modern temperatures you must average the modern temperatures over the temporal resolution of the proxies and compare them at the proxy location. There are very few proxies in 9000BC, so a valid global average temperature (proxy or otherwise) isn’t possible. Proxies are very low resolution compared to the daily temperatures we gather today with thermometers. Further, besides resolution problems, proxy temperatures just are not very accurate, those in figure 1 are among the better proxies and their accuracy is ±0.3 to 0.4 deg C.
Figure 4 in our paper (figure 1 above) does do a valid comparison for the Makassar Strait record by averaging the 500-meter depth temperatures from the University of Hamburg’s ocean database from 2006-2016 (Gouretski, 2019). This temperature is shown as a red box on the figure, presumably Bonus missed this or didn’t understand it. The temporal resolution of the Vinther and Rosenthal records in the twentieth century is about 20 years between temperature estimates, so 2006-2016 is close to that, it is also the time period with the best data in the Makassar Strait. Earlier than 2006 the data gets poor very quickly.
Thus, what Bonus wants us to do is invalid and erroneous. We did the most valid comparison to modern instrumental temperatures possible. To see the Greenland data treated in the same way, see this post, figure 1. In it, the modern data in the Greenland area is compared to the Alley Greenland ice core record for the past 4,000 years.
Bonus #3
In addition: Rosenthal et al 2009 AND Rosental et al 2013 shows current GLOBAL SST is currently above the level seen in the very regional Rosenthal 2003 paper.
Again, Bonus gets his Rosenthal papers mixed up. The data we present is the Rosenthal (2013) data and it is not the SST (sea surface temperature) data he is referring to. We use the intermediate water temperature (500-meter depth) because it represents SST temperatures in the northern Pacific Ocean. Bonus is just confused here and didn’t read the paper carefully enough.
Bonus #4
Not to mention that collectively climate proxies show that current global temperatures are well above anything in the human civilization history. See also Marcott et al 2021.
Again Bonus is confused, no one knows what the global average surface temperature was in 9000BC, or even in 1000AD. Proxies are not that accurate. Plus according to AR6, (Kaufman, McKay, & Routson, 2020) and (Kaufman & McKay, 2020b) the median/average temporal resolution of the proxies used in the graph he shows from Marcott and Shakun (2021) is 164 years between temperatures or the entire industrial period record since 1880. You can’t compare current rates of warming from daily measurements to rates from that proxy data. All you can do is average all the temperatures since 1880 and compare it to selected proxies at the specific proxy locations. Nothing else is a valid comparison. See this post by Renee Hannon for a further discussion of this issue.
Bonus #5
They repeat Bjorn Lomborg’s false claim that climate related deaths have declined 99% since the early 20thC. Lomborg’s claim [is] debunked.
Bonus shows a video clip of someone (unidentified, like Bonus himself) claiming that Lomborg misrepresented the EM-DAT data he used to create his now famous graph, which comes from a peer-reviewed paper he wrote in 2020 (Lomborg, 2020). The graph is shown below.

The anonymous video is a rather tiresome complaint that Lomborg prepared the data incorrectly and presented it incorrectly, the narrator’s arguments don’t hold water. It is very clear that no matter how the data are presented, deaths from extreme weather have decreased radically since the early twentieth century. One could quibble about the classifications of the deaths by EM-DAT or the data prep forever, but the underlying idea is sound. Besides, Lomborg’s paper is peer-reviewed and we don’t even know who Bonus or the narrator in the video are. I’ll take peer-reviewed over anonymous drivel any day.
Bonus #6
They mention a paper on CO2 Greening (Zhu et al 2016) but fail to mention a more detailed analysis found that the greening dominated in China and India and was due to “programs to conserve and expand forests” and “intensive cultivation of food crops”.
This demonstrates that Bonus has not read the papers he cites very well. Zhu (the paper we cite, (Zhu, Piao, & Myneni, 2016)) calculates that 70% of Earth’s global greening in the modern period is due to CO2 and about 13% is due to fertilizer and land use changes by humans. The non-peer-reviewed NASA blog post that Bonus cites, states that China and India account for 30% of the global greening, there is no inconsistency in the numbers from the two sources, they are about different things. Both articles agree that the Earth is greener in recent years, but the NASA blog post is silent on the impact of CO2. Bonus was confused and in over his head.
Bonus #7
“They claim more CO2 benefits plants but ignore the greater harmful side effects of climate”
CO2 is pumped into greenhouses to achieve more rapid growth and Craig Idso (Idso, 2013) has estimated the monetary benefit to farming output of increased CO2 is $3 trillion since 1961. What are the harmful side effects of additional CO2 that our anonymous Bonus has to offer? Again, he refers to an anonymous non-peer-reviewed video. His source tweet is here, I did not try and figure out which source was which, and Bonus provided no help. The reader is welcome to try and figure it out, I will not bother with it.
The first argument from the video is that CO2 is not the only limiting factor to plant growth, plants also need water, pests are a problem, etc. These have absolutely nothing to do with CO2 and are red herrings. Then they say the rate of additional growth due to more CO2 lessens as CO2 increases. So what? You still get more growth. Then they say additional CO2 benefits weeds as well as crops, well duh, of course that is the case. Weed control is a separate issue.
Then they claim that recently crop production has declined. Not according to the data in Ourworldindata.org and FAO, see below.

Then they claim that additional CO2 increases global temperature and drought. As our peer-reviewed paper (May & Crok, 2024) makes clear the connection between CO2 and temperature is possible, but not proven and meteorological drought is decreasing or staying the same [(Klotzbach, Bowen, Pielke, & Bell, 2018), (Crok & May, 2023, pp. 142-157), and (Pielke, 2019)], and not increasing globally according to AR6 (IPCC, 2021, pp. 1579-1580). Finally, they say, global warming increases the growing season, true, but then they complain that this increases the use of water and gives pests more time to get to the crop. A rather silly argument, longer growing time is a good thing, whether caused by CO2 or not. The video is anonymous and unsourced, like Bonus, whereas our sources are all peer reviewed.
Bonus #8
Near the end of their paper they cite an Exxon corporate document for their claim that we will need more fossil fuels.
The data we cite is from ExxonMobil’s yearly Outlook. It is widely used as a very credible source of energy production and consumption data. It is used, and cited, globally, like similar reports generated by BP and Shell are used. This is pure prejudice and not a valid criticism, Exxon’s Outlook is a very credible source.
Bonus #9
Marcel Crok is responsible for a climate denial “clintel declaration” signed mostly by fossil fuel employees, oil and gas geologists, fossil fuel lobby group members non-experts, conspiracy theorists and not a single actively publishing climate scientist.
This is completely untrue, like nearly everything Bonus writes. The 1900+ Clintel signatories include fossil fuel employees and retirees (including me) of course, but also hundreds of scientists and engineers who are or were employed by academia and in other industries. There are many, many Clintel signatories who are actively publishing climate scientists, including both Marcel and myself, as well as many others. I should mention that “climate scientist” is not a real field, most “climate scientists” have degrees in physics (like William Happer), geology (like Michael Mann or Andy May), atmospheric physics (Richard Lindzen and Judith Curry), or meteorology.
Bonus #10
Oh and Marcel Crok’s clintel released a climate denial film with @Martin_Durkin that was debunked.
Michael Durkin’s film (supported by Tom Nelson and Marcel Crok) has never been debunked and is well grounded in the peer-reviewed literature (see here for a full annotated bibliography) unlike the non-peer-reviewed and unsourced films by the anonymous filmmakers cited by Bonus.
I’ve followed the very popular and excellent Climate The Movie: The Cold Truth since it first came out and it has not been debunked by anyone credible that I’m aware of.
Bonus #11
The paper also claims no change in extremes linked to climate change which is false. I noted that Crok and May have admitted in their Clintel report on IPCC AR6 they didn’t read the full AR6 IPCC report so that might be why they didn’t find anything. i.e. they didn’t look.
We did not claim that extreme weather didn’t change, we claimed and documented that most extreme weather trends either have not changed in modern times or have decreased and that overall the impact of extreme weather declined as a percent of GDP. These are well documented facts reported in “The Frozen Climate Views of the IPCC: An Analysis of AR6” (Chapters 11-13) and in AR6. There is no evidence that extreme weather or the impact of extreme weather has increased.
As for Marcel Crok and Andy May not having read all 10,000 pages of AR6, this is true. I seriously doubt many people have. However between the entire 13-member team we assembled to write “The Frozen Climate Views of the IPCC: An Analysis of AR6” we very likely did. AR6 is ridiculously long.
Bonus #12
the plot thickens…It turns out that the Journal’s calls for papers on climate seems to be courting fossil fuel funded climate change denier groups. Their call for papers links to the CO2 coalition (a fossil fuel funded lobby group that spreads disinfo) which May is a member of.
The CO2 Coalition is a very good organization that I am a proud member of. It spreads no disinformation that I’m aware of and Bonus provides no examples. This propensity of the alarmists to lie about and disparage good organizations and people only because they disagree with them is reprehensible.
Bonus #13
……and if this is the Marty Rowland who is special editions editor at the American Journal of Economics and sociology Journal look at what he says about climate change. Wow, looks like a journal that likes climate change denial and disinformation?!
And the character assassination attempts continue. Marty Rowland has the opinion that “climate change” is a religion. It is. The “true believers,” such as Bonus or Michael Mann, will not discuss or debate the issue as true scientists would do, they just try and beat down their opponents with ad hominem attacks on twitter. One is reminded of the Spanish Inquisition.

Bonus #14
AJES ranking, not good.
This is a silly argument. The American Journal of Economics and Sociology has been around since 1941 and is well respected. This sort of argument is very juvenile, like the attacks on Marty Rowland, Marcel Crok, and myself.
Conclusions
The anonymous “Bonus” somehow created quite a stir on twitter, yet we don’t know who he or she is, could be a twelve-year-old with his mother’s phone for all we know. Bonus cites very few peer-reviewed articles and when he does, he often gets them wrong as in the Rosenthal article mix up discussed above. Yet, Michael Mann cites him in twitter, which gives you an idea about Mann’s academic integrity.
None of Bonus’s claims are true or supportable. Beware of what you read from anonymous sources. Bonus’s critique is a biased and emotional screed with no merit.
Download the references here.
I’m going skiing tomorrow. It’s always a bonus when the boiling oceans give Colorado much snow that lasts into summer.
Odd, I seem to remember that a UK climatologist said around March, 2000 that the children of today would not know what snow looks like. Could he have been wrong?? After all he is a climate scientist and I thought climate scientists are always right. /s
“According to Dr David Viner, a senior research scientist at the climatic research unit (CRU) of the University of East Anglia ,within a few years winter snowfall will become “a very rare and exciting event”. “Children just aren’t going to know what snow is,” he said.”
I can’t find a link to it, but the claim was that ski resorts would have to shut down here in the US, East and West coast, due to lack of snow.
(The claims were 10 or 20 years ago.)
Yes and he was right, I suggest you take your own advice and reread the source.
Please explain.
Well Andy May failed to mention the context of the article which was about the decline of snowfall in the South of England, as was mentioned there, from 1970-1995 snow and sleet fell for an average of 3.7 days while from 1988-1995 the average was 0.7 days. At the time of the interview London’s last substantial snowfall was in 1991, 9 years previous. It was in that context that Dr. Viner said snowfall (in S England) would become a “rare and exciting event”. Like all the other critics May did not state the context but also omitted to quote the rest of Viner’s statement: “Heavy snow will return occasionally, but when it does we will be unprepared. We’re really going to get caught out. Snow will probably cause chaos in 20 years time”. That’s exactly what happened! Things like it became expensive for the local government to keep snowploughs which they weren’t using, so when the snow came back they had no way to clear it!
The original article gave the South of England as an example, however, Viner didn’t caveat his blanket statement.
Either, his words were intended to mislead readers into thinking he meant the UK or he was wrong. Which is it?
Also, scientists were telling us the opposite in the same rag a year later.
Actually that was 10 years later. Viner’s remarks were quoted by the author and his interview was not quoted in its entirety. The point is that he was correct, snowfall in the UK was decreasing (particularly in the south) but the occasional snowy year would cause chaos. Which is exactly what happened about ten years after his interview, then the media produced their articles saying ‘Viner was wrong’, like May of course they omitted his remark about the occasional chaos.

Link to Viner’s complete interview for verification, please.
Station days? How many stations were there in say 1980 compared to today? For example, if they have been closed down, then the 2010 anomaly may have equaled the 1963 anomaly, and you wouldn’t record it. What is the amount of snow in the standard SWE during this time period?
Inadvertently, you made Viner’s quote sound even worse by citing it in its entirety. Viner is clearly trying to hedge his bets about the future of snowfall in the UK.
No, he knew what the English weather was like and pointed out that while snow would become less frequent, occasional storms (decadal) would cause problems. He was exactly right!
Come off it Phil.
Children love to play in the snow.. Plenty of it in Winter in the UK.
If the education system doesn’t tell them what it is, that’s down to the education system.
Parent will help.
As pointed out in the article the major toy stores stopped selling sledges because of the lack of snow and the winter skating festivals moved to indoor skating rinks because of the lack of skateable outdoor ice.
Sledges?
As in sledges used for splitting firewood or hammering metal or rock?
Big box toy outlets:
A) Don’t sell sleds because of accident risk. Instead they sell other types of snow sliders.
B) Don’t like to waste the space sleds require when that square footage could host items with greater square meter profit.
A sledge is the English word for the little wooden platforms on runners that we used to slide down the snowy hillsides when I was a kid.
http://t0.gstatic.com/licensed-image?q=tbn:ANd9GcQCXBUGNKRTrbPg_gLMsrgi8Ic9YH3eQJW0p6LSDoyRGWDxFeOWCEbI4jKpHU4URGPorV-oE4A-5x70VUrstuA
The store in question had sold them until that year.
Don’t be a Richard, Phil.
Seems it is finally warm enough for the furnace to light up in the morning here.
I had to let in warm up a few hours this morning before it was warm enough to go out for a bike ride.
In thought, I decided Colorado needs to be warmer as there are never days too hot to ride but there are plenty that are too cold, especially when taking snow into account.
Very true this…
Excellent!
Very nice Andy, you are doing exactly the right thing. Nothing could be better than to bring the CAGW crowd out in the open. I love it when our side uses the IPCC’s own words to bolster our view. Keep up the good work.
“I love it when our side uses the IPCC’s own words to bolster our view.”
Yeah, these climate alarmists are not even quoting the source of their CO2-phobia. They don’t quote the IPCC because they can’t scare anybody using the IPCC’s own science. So they create a scary CO2 scenario that doesn’t exist and is refuted by the actual science.
When the climate alarmists start attacking people like Andy May, then we know Andy, et al, are over the target.
_______________________________________________________________
NOAA says:
“Areas experiencing little-to-no change in relative sea level
are illustrated in green, including stations consistent with
average global sea level rise rate of 1.7-1.8 mm/yr.“
That’s sort of buried in their Tides & Currents page maybe they
are more forthright elsewhere.
Acceleration is pretty close to 0.01 mm/yr² see my chart of 67 tide
gauges showing the distribution of acceleration of sea level rise:
You nicely prove Bonus wrong. Let me pile on.
The satellite stuff he cites isn’t credible. See two old posts on newest bird ‘Sentinal 6’ for details, or even older ‘Jason 3–fit for purpose?’ for the intractable physical reasons.
The dGPS (corrected for measured vertical land motion) long record tide gauge stuff is. It shows 2.2mm/yr and NO acceleration—plus it closes. See my old post here ‘Sea level rise, acceleration, and closure’ for details.
Sentinel 6 has an accuracy of “a few centimeters”.
https://www.eoportal.org/satellite-missions/copernicus-sentinel-6-michael-freilich#spacecraft
Only in Climate “Science” can an instrument with a resolution of a few centimeters be employed to demonstrate a sea-level rise of a few millimeters or so per year.
At perfect conditions and satellite equipment best operating conditions will the satellite accurately measure to within ‘± 3-4 centimeters.
i.e., in multiples of of a claimed 2.2 millimeters sea level increase.
However during many physical conditions or impacts from old Sol, accuracy is often often worse.
Someone, I’m thinking Willis but maybe someone else is better than me at keeping track, published an article here some years back when a journal article appeared claiming tidal gauge trends showed acceleration, based on a sample of, I think, 50 tidal gauge records.
He then selected a half dozen or so batches of record for the same number of tidal gauges (50?), based on different selection criteria for each batch. The criteria did not include any consideration of rate of change. There were also a few criteria consistent for all batches, such that the record was at least some minimum length (in years), that there were few missing entries, … designed to assure decent data.
Applying the same analysis as the paper he was reviewing, he found some batches showed acceleration, some showed deceleration, some showed no rate change. All in all they pretty much canceled each other out. A final analysis over all good tidal gauge records found no acceleration.
His conclusion was that one could show whatever was wanted, provided the data was chosen carefully enough.
“His conclusion was that one could show whatever was wanted, provided the data was chosen carefully enough.”
I think that sums up alarmist climate science quite nicely and accurately.
Thanks Steve,
I just saved this comment and graph in my sea level dir.
Don’t forget a comment that it is very likely meaningless.
If you’ve upset the Mannish Inquisition then you’re on the right track 👍
Bonus sounds like just another climate cult w@nker.
As the pilots in WW2 would say: “if you get FLAK you are over target”
Invite Bonus on X to respond on WUWT.
I wouldn’t be surprised if “Bonus” is another pseudonym of the usual CAGW
trolls like AlanJ or Phil.
The confusion over sources that Bonus makes is typical of AI searches.
I suspect that Bonus is a bot.
On the subject of sea level rise, there are a few tide gauges mounted on crystalized rock going back 100 years and one going back to before Lincoln was president. They all show a very slow steady rise of around 2 mm/yr when corrected for land elevation changes. Then throw into the hopper “A Search for Scale in Sea-Level Studies” by Larsen and Clark of the USGS, Journal of Coastal Research, July 2006. They conclude based on samplings and analysis of east coast peat bog deposits and river sediments that sea level has been increasing at a average rate of 1-2 mm/year for the past 6,000 years with ups and downs along the way. This suggests to me that sea level increases we are seeing are likely primarily a consequence of geological processes such as subsea volcanoes or plate tectonics, or both, causing a slight and fairly steady decrease in ocean basin volumes.
I was in Western Australia recently and I could see with my own eyes, looking at bluffs along the beach, that sea level was maybe 4 or 5 meters or so higher sometime in the past than it is today.
More interestingly, I came back with a piece of fossilized coral that appears to have the same underlying structure as those corals that made up Petoskey stones found in Michigan. The only difference being that the one I found in Australia was almost white and much harder. I seem to recall those corals were living around 350 million years ago.
Here is a picture from an island in the Mozambican area showing the Indian Ocean was higher over 130000 yrs ago.
Congratulations. Taking Bonus flack just means you and Marcel are over the target. Great job shooting Bonus down over and over and over.
Gave your previous post on your new paper strong additional factual support in my lengthly comment. Natural variability did not magically stop in 1975, as IPCC would have us believe.
One of the most fatal AGW ‘climate science’ flaws is denial of easily proven natural variability on time scales from decades to centuries. The various hockey sticks try to erase it with their straight shafts, and then ‘prove’ AGW by using Mike’s Nature trick on the blade. Two wrongs do not make a right.
Fundamental problem is, ‘they’ cannot erase actual history. Vikings burials in Greenland church yards during MWP are now still encased in permafrost. Last LIA Thames ice fair in London was winter 1818. Larsen made his NWP 1944 transit in just 89 days via a route impossible 30 years later, dicely possible again 2012-2013 (illustrated in essay NWP in ebook Blowing Smoke), and now impossible again.
FLAK = Fliegerabwehrkanone
Thanks Rud.
“Fundamental problem is, ‘they’ cannot erase actual history. “
Quite so. But frauds can try to fabricate fake history. Charles Dawson tried this in 1912 with Piltdown Man. And speaking of “Mann” isn’t this what Mannian statistics is all about? Creating a false historical narrative by manipulating statisitics in illegitimate ways?
Being a very simple fellow, I call it “lying”.
But attaching supposed instrumental data to proxy estimates both with radically different temporal resolutions has been one of their favourite and successful tricks, who can forget the fun they had with Marcott 2013 also not forgetting that website of impeccable scientific probity skeptical science 🤣.
I often bring up this fundamental point in various discussions. There is never any reply.
That they continue to do it is breathtakingly bad science.
It’s not science at all. It is just fraud.
Marcott 2013 was proven academic misconduct fraud at the time.I even provided a written ‘smoking gun’ between his thesis and his Science paper to then senior editor Marsha McNutt. Her office acknowledged my written receipt, then nothing. The climate ‘science’ game was rigged long ago.
I had to laugh. I didn’t think being a “climate scientist” was a real field. I’d listen to a geologist but “climate science” itself is only 30-year weather renamed, something that never stays the same, even for a day.
I didn’t really become too interested in climate until sometime after 2000. I guess I could be a climate scientist within a decade.
Any profession claimed to be a science that requires two words is some sort, for lack of a better word offhand, a ‘subscience.’ Even oceanography and meteorology are a consolidation, especially the first, and all the four long known are required to understand the earth/atmosphere/ocean. I think I insulted someone telling them that was no such thing as ‘communication science.’ There is communication of science and sciences used for communication.
I just drove on a road that was predicted to be covered twenty, even ten years ago. Not even close despite a strong onshore wind.
´Wow.. you are way more patient than I would be!
You make a few and interesting points in this post here.
It is nice to see your opinion on talking points I and likely others have encountered in discussions..
Little Bonus writes is authentic (false or not)
As for reconstructions of the past by you or so alarmists, temperature reconstruction or sea level, it is imperative that any potential selection bias is part of the uncertainty analysis as Wyner remarked in his witness statement in the Mann vs Steyn case!
Absent of that even if you know a times series (sea level or temperature) and calculated the uncertainty of your data correctly, it is still meaningless!
The fact that both sides of this debate seem to omit this critically needed analysis, does not really help your arguments!
How representative are
I am horrified how any of that stuff (Mann work included of course) ever got through peer review!
We know Mann is full of shit and it appears that applies to ‘Bonus’ as well.
Twatter, or X, is worse than fakebook for allowing the likes of mann and his disciples to conduct witch hunts.
I cannot read the original bonus article on twatter, as I have a permanent ban, thanks to mann’s followers.
I thought Elon Musk was running Twitter/X. How did Michael Mann’s followers manage to give you a permanent ban? Just curious, as I’m not a member of Twitter/X so don’t know how they operate. I thought Musk had instituted more free speech on Twitter/X?
Well done Andy. Their ”evidence” stays the same while contrary evidence grows continuously.
Keep up the good fight. Slowly slowly catchy monkey.
“Their ”evidence” stays the same while contrary evidence grows continuously.”
That’s a good way to describe the current situation.
12 year old? I doubt that. Sounds definitely like a 13 year old! /sarc
Awesome as ever Andy!
This bit really caught my attention:
I am also a proud member of this group. Gregory Wrightstone is very proactive in refuting actual disinformation (technicaly geologically illinformed opinion) that is occasionally repeated by folks on our side of the debate. Furthermore, the organization is not funded by the “fossil fuel industry”… but should be.
I agree!
“the connection between CO2 and temperature is possible”
Only stupid people say that
Climate the Movie tries to convince viewers that CO2 is not a climate forcing
Only stupid people believe that.
Stupid people can never win a debate with leftists even though leftist lie about the climate.
You can’t refute their BS with your BS.
It’s the Leftist CO2 Does Everything Nutters versus the Conservative CO2 Does Nothing Nutters. Mixed Nutters.
The author’s “possible” connection between temperature and CO2 is not completely denying the connection, but is close to a Conservative CO2 Does Nothing Nutter position.
RE: Plants
CO2 enrichment increases water use efficiency
Plants transpire less so need less fresh water
Resistance to bugs tends to increase too.
If you can’t measure it (human co2 warming) after 40 years then you may as well call it nothing for practical purposes.
You are a tiresome ”Human CO2 Does Something But I Don’t Know What” nutter.
You can never win a debate with leftists by conceding that CO2 does something even though no one knows what it is. It will just continue to encourage them to use the same kind of tired arguments that ”Bonus” and Mann uses. Only a ”co2 does something nutter” like you would not see that.
So the only way to win an argument with a leftist, is to lie as much as they do.
The correct way to phrase the correct argument is that we know that CO2 does something, we don’t know with precision how much. We do know that the amount is small, much smaller than natural variation.
Nonsense. It is not lying to say we do NOT KNOW if the ESC is 0, 0.1, 0.5, 1, 1.5, 2….
Prove it does something and – then you can tell me exactly what it does – or go away. I’m not interested in extracting academic ”possible scenarios” from AGW junk science when I have to deal with alarmists.
The burden of proof is on them. It’s not up to me to do anything, agree with anything not proven or to prove anything.
You are making the common mistake of being drawn into the ring using their rules.
Laboratory experiments prove that CO2 does something.
However because the real climate is very complicated with thousands of interactions between elements, most of which are not well understood, it is impossible to figure out what the actual impact will be in the real world.
So we know it does something, but we can’t say with any precision how large the impact will be. We only know that any potential impact is small.
Well said. Too small to measure.
Or… The background noise is so much larger than the signal, that measurements are pointless.
“The burden of proof is on them. It’s not up to me to do anything, agree with anything not proven or to prove anything.”
That’s the way it should be, but that’s not the way it is. They’ve captured all the institutions and most of the governments. It’s a forgone conclusion. We are not winning, and likely will not.
And we also know that no-one has ever observed or measured any warming from atmospheric CO2 anywhere on the planet.
It is like one of those myths they have in science fantasy movies.
Any potential impact is much smaller than natural variation.
Just because something can’t be detected due to noise, does not prove that it isn’t there.
Saying that something is too small to matter, is not the same as saying it doesn’t exist.
We also know that the effect of human CO2 emissions on climate (or temperature, more precisely) has never been detected, despite years of trying. Too small to measure is a good phrase.
Where is your scientific evidence that human CO2 causes warming???
Still waiting… and waiting… and waiting !…
Ah, coupla daze. Dozen madda.
Harold the Chemist says:
CO2 was never a problem. In 1920 the concentration of CO2 was 300 ppm by volume. This is 0.589 grams of CO2 per cubic meter of air. Presently, the concentration of CO2 Is 427 ppm by volume at the MLO in Hawaii. This is 0.839 grams of C02 per cubic meter of air. At 15 deg. C, a cubic meter of air has a mass of 1.22 kilograms. After a century the amount of CO2 in air has increased by only 0.250 grams per cubic meter of air.
I have concluded that this small of CO2 can cause only small amount of heating of such a large mass of air.
I have further concluded that the UN, the IPCC, the UNFCC, and a coterie of unscrupulous scientists have been perpetrating since 1988 the greatest scientific fraud in recent human history. The UN’s objective is the transfer of large amounts of funds from fines of the rich countries (i.e., the big polluters) to all the poor countries to help them cope with future “climate change”. At the recent COP28 conference the rich countries promised many millions funds to help the poor countries.
A few years ago some friends of mine who had swallowed the great CAGW lie wholesale were arguing with me about the subject. I made a physical model by unrolling 10m of string to represent the composition of the atmosphere. I then asked them to show the 0.04% of the total length which was CO2. They were dumbstruck when I showed them it was a mere 4 mm, up from 3 mm in pre-industrial times.
Nicely done. Did it change their OPINION? I doubt it. They may have been struck dumb, but that would not change the stupid.
I am thinking of keeping a 10 meter length of string for your representation. I still think the religious beliefs are just too strong for reality to overcome.
BTW, Mexico just elected a far leftist as their president for 6 years. How do I know she is a FAR leftist. She is a “Climate Scientist”.
Can’t wait for TRUMP! to close the border and then go 10 miles into Mexico with the US Army to clear out the guerrillas (cartel gangs/coyotes) that cross into the US. Good war practice by dropping airborne 10 miles from the border and driving the crooks toward the US to capture them. I am sure that by now the “electronic surveillance” that W and the Dems spoke during that amnesty attempt, that would “secure” the border, has collected massive amounts of videos of them crossing the border to guide all those poor helpless “refugees”. You know, the ones that had enough money to buy their way all the way into the US.
What an interesting read. Well done.
Thanks
Greenland’s temperature graph shows a clear jump 11,000 years ago, when the angle of the Earth’s axis to its orbit was at its maximum. Since half of the cycle is about 20,000 years, we still have about 9,000 years until the next glaciation. This will also be facilitated by the shift of perihelion to the spring months in the northern hemisphere.
https://i0.wp.com/wattsupwiththat.com/wp-content/uploads/2024/06/Figure-1-1.webp?w=624&ssl=1
Think about how high the albedo must have been in the Northern Hemisphere 12,000 years ago, and how strong the influence of Milankovich cycles must have been that all that ice was melted.
Interesting timing – that is rather coincident with the penultimate advance and retreat during the last rise in sea level leading up to the Climate Optimum.
The question is, does this shift cause rapid responses in the climate?
There was a major climate shift needed at 20,000 years BP to allow for the starting of the climb in the rise in sea level to its present location.
– Ian MacCulloch
And it is for many people. In this short video (7 min) I show 14 points of coincidence between the “climate religion” and traditional abrahamic religions.
https://youtu.be/02x30Axf0xA
This “Bogus” guy is nothing more than a believer defending his religion against the infidels.
What is amazing is to see christians (even the Pope) embracing this secular religion that it is so clearly competition of the worst kind.
Religion gives a false sense of security through the illusion of man’s influence on nature’s processes. God did not give man the Earth, it is man who thinks he is the ruler. Meanwhile, he has no influence even over his genetic predisposition.
How do you publicly slander a scientific argument, and persuade John Q. Public to ignore it ?
You make the appearance that the argument comes from a small minority. You have to generate a high volume of criticisms in the public forum, that is, social media.
The trick is that you don’t have to bother researching the subject. The criticisms can easily appear knowledgeable at first glance when, in fact, they amount to specious posturing propped up with well-used keywords like “the peer-reviewed journals”, “cherry-picking”, “not a climate scientist”, and so on. The information content of the criticism is almost nothing, but John Q. Public doesn’t know the difference.
The concept is similar to a “denial-of-service” attack on a web server, where the machine is overwhelmed by the volume of requests. In this instance, they preoccupy your time making a professional, well-researched defense of your work, while they sit back making ad hominem attacks and empty heckling. There’s no limit to the volume you can generate when the content is nothing.
Maybe it’s just me, but I see a strategy at work. Not just on Twitter, but across the internet: Amazon book reviews, YouTube comments. There is an army of activists whose job it is to sabotage climate information with misdirection, any way they can.
It does seem there are a lot of these internet trolls out there. They must be organized in some fashion, they use the same phrases and logic, as if they were all working from the same playbook. I wish I knew more about this.
“One is reminded of the Spanish Inquisition.”
Jim Steele does a magnificent job debunking the criticisms made of the May and Crok paper but spoils his article by making this crass comment: “One is reminded of the Spanish Inquisition.” One is not reminded of the Spanish Inquisition unless one is fooled by the black propaganda put out by Protestants and so-called Enlightenment philosophers. Instead of falling for the gross exaggerations of these totally-biased sources, try reading some modern research on the Inquisition. One small detail: people accused of civil crimes sought investigation by the Inquisition because they reckoned they got a much fairer trial. Try doing some reading on the purpose of the Spanish Inquisition, its actual methods and the outcomes of its investigations.It’s amazing how someone can provide such detailed and informed rebuttal of one person’s crass mistakes but then be guilty of the same kind of error himself.
Was it not the inquisition that burned people alive upside down? In that way they would not pass out from smoke inhalation but could experience the full enlightenment of burning from the feet to the heart.
I’m guilty of making this same comparison and I see your point. To date I’ve not been physically tortured as heretics and Jews were in the Spanish Inquisition. Let’s hope we can stop this climate change madness before such things happen.
Bonus starts with the usual misdirection that the focus of their ire is spreading disinformation. To me that would mean not to bother. These clowns act in bad faith and have absolutely no intention of truth finding. They should be treated as the pariahs that they are.
An excellent paper.
I think using averages and describing differences above and below as anomalies is a little off-putting. They are not anomalous in the strict sense of the word. These values are better off being described as above or below average.
Concerning sea level changes and the Little Ice Age, while there was some glaciation development, this pales into insignificance in the lead up to the Climate Optimum where sea level changes were much more rapid.
The intriguing aspect of the paper is that it has the last major advance and retreat as correlated with the Scandanavian Moraines (Fairbridge, 1960 & Nature 1958, vol.181, p1518) when the sea was 40 metres lower than it is today (9,000 yrs BP). The same aged moraines are also present in the mid west of the USA where there was an alluvial gold mine in one of them
The other intriguing aspect of this rapid and significant advance and retreat is that it takes place at or near the average temperature as described by the authors of this paper. The previous rapid advance and retreat took place while the temperatures were right on average.
In case, there is any doubt about fossil strandlines there is none – I have drilled two out of the four described by Fairbridge.
Once again I will put up his graph from his rather definitive work.
So sea level follows the angle of inclination of the Earth’s axis to the plane of the ecliptic and reaches a minimum when the angle is smallest.
Earth’s axis is currently tilted 23.4 degrees, or about half way between its extremes, and this angle is very slowly decreasing in a cycle that spans about 41,000 years. It was last at its maximum tilt about 10,000 years ago and will reach its minimum tilt about 10,000 years from now. As obliquity decreases, it gradually helps make our seasons milder, resulting in increasingly warmer winters, and cooler summers that gradually, over time, allow snow and ice at high latitudes to build up into large ice sheets. As ice cover increases, it reflects more of the Sun’s energy back into space, promoting even further cooling.
https://science.nasa.gov/science-research/earth-science/milankovitch-orbital-cycles-and-their-role-in-earths-climate/
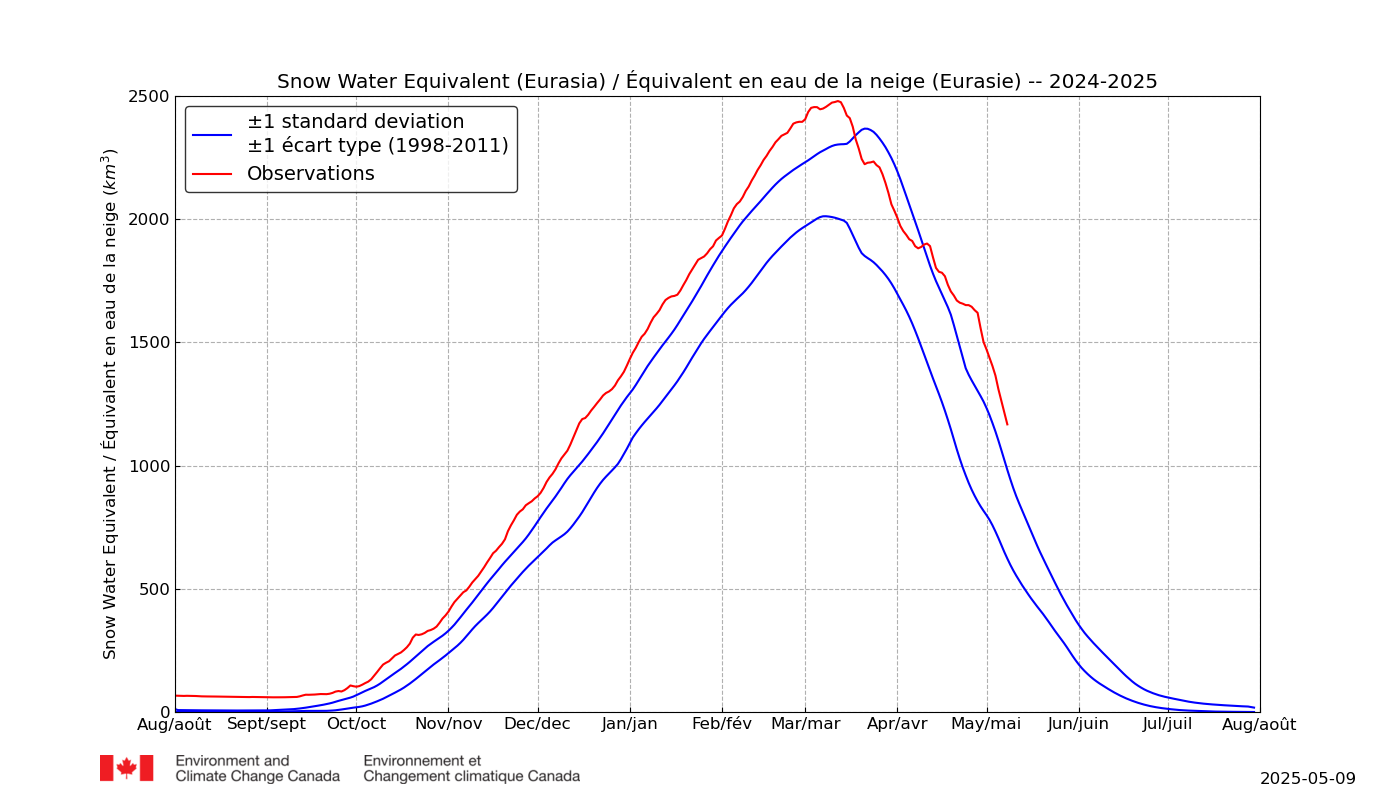
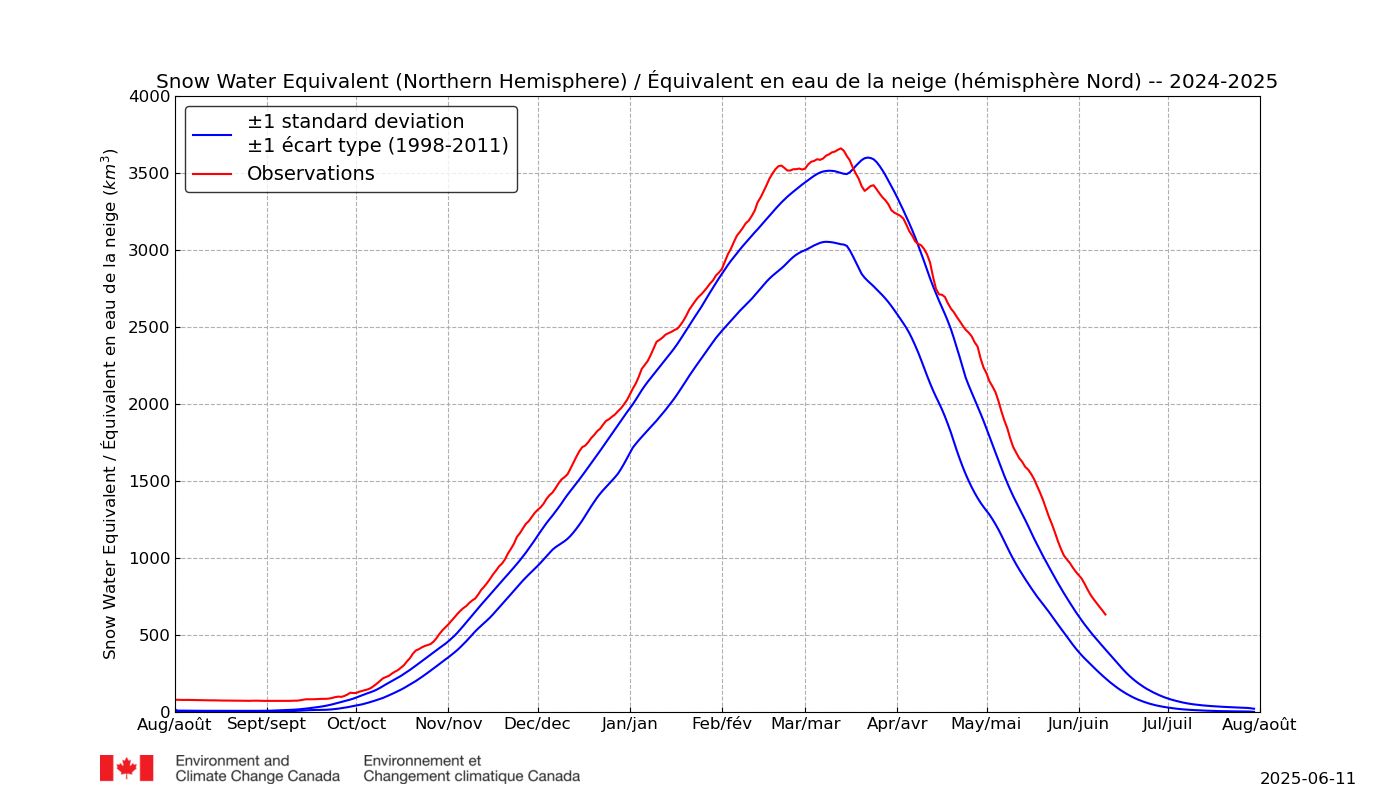
You can see what happens when winters are milder in the northern hemisphere, as perihelion occurs in early January. Snowfall increases. In 2023, you can see higher snowfall in the summer, and that could be the case this year.
It’s still disappointing that we’re laboring under the misapprehension that a “global average temperature” is meaningful in any way. You can’t boil it all down to a single line on a graph.