The ONS this week published the latest figures for environmental taxes and they make for sobering reading.
In 2023, the UK squeezed £52.5bn out of the economy in green taxes, a 4.9pc increase year-on-year, and it is now close to its pre-pandemic high.
The revenue raised by green taxes has almost doubled since 2000. Within that, fuel duty is by far the biggest contributor, accounting for nearly £25bn.
The UK’s Emissions Trading Scheme – which seeks to reduce greenhouse gas (GHG) emissions in energy intensive sectors – now raises close to £6bn. Air passenger duty brings in £3.7bn, and the climate change levy – an environmental tax charged on the energy businesses use – close to £2bn.
Add it all up, and it is turning into a major burden. The average household paid £623 in green levies in 2021, up from £575 in 2020. They accounted for 5.5pc of government revenue, and took 2pc out of total GDP, in 2022. And that’s before the shadow climate change secretary Ed Miliband gets to work, as he almost certainly will later this year.
Wow, thanks for posting these links. Vermont has chosen very poorly. What next? Blame the sun for evaporating all that water that came down as rain and caused the floods? Completely nuts.
The NASA web article, to which I made reference in the essay, was posted Jan 14, 2009. Over 15 years ago. They knew very well back then that the static sense of the radiative effect of incremental GHGs was incomplete and misleading. Put the atmosphere (and oceans) into circulation, and one need not expect the heat energy involved in the static radiative effect to accumulate on land and in the oceans, certainly not to harmful effect.
The entire “climate” movement is based on the “forcing” + “feedback” framing of the study of the climate system response to incremental GHGs.
Better to re-discover that the atmosphere is the working fluid of its own heat-engine operation, at local to global scale, in response to absorbed energy. This includes the IR emitted from the surface and absorbed by clouds and GHGs. The end result? Dynamic self-regulation. The GHGs never added any energy of their own, and the atmosphere itself (including clouds) is the emitter to space that matters most.
‘The NASA web article, to which I made reference in the essay, was posted Jan 14, 2009. Over 15 years ago. They knew very well back then that the static sense of the radiative effect of incremental GHGs was incomplete and misleading.’
That’s about the same vintage as Trenbert & Fasullo [2009]:
‘There is an increase in net radiation absorbed, but not in ways commonly assumed. While there is a large increase in the greenhouse effect from increasing greenhouse gases and water vapor (as a feedback), this is offset to a large degree by a decreasing greenhouse effect from reducing cloud cover and increasing radiative emissions from higher temperatures. Instead the main warming from an energy budget standpoint comes from increases in absorbed solar radiation that stem directly from the decreasing cloud amounts.’
In a nutshell, the ‘canonical’ narrative wherein increasing CO2 emissions block OLR until the surface warms up sufficiently to re-establish radiative balance at TOA isn’t ‘collaborated’ by the models. The convenient upshot to this is that all observations, including increasing OLR concurrent with decreasing cloud cover, are considered verification of CAGW.
“That’s about the same vintage…” Yes. I credit the contributors/editors/approvers of the NASA article with a more balanced description than one would understand, say, from IPCC AR4, which had been issued a couple of years earlier.
“The convenient upshot to this is that all observations, including increasing OLR concurrent with decreasing cloud cover, are considered verification of CAGW.” Yes, that is how it will likely be played, disregarding the obvious circular reasoning this requires.
Thanks. To me, the evolution of the CO2-forced greenhouse mechanism to conform with the GCMs effectively leaves all of alarmist science non-falsifiable by observation, outside of a mile of ice over NYC. It really is a case of ‘special pleading’.
Considering the estimated wide range of average temperatures in the past 20,000 years. that
is not very good self regulating/
Also, changes in cloudiness do not explain warmer nights since 1975, especially if cloud cover percentage is declining. The claimed 7% decline in the past few decades may be statistically insignificant for the imprecise estimate of the percentage of cloud cover.
Hello Richard, nice to hear from you.
There is a wide range of average temperatures on a planet-wide basis EVERY year. The dynamic self-regulation (i.e. the heat engine circulation ending up dissipating energy to space) is in response to absorbed energy, which of course varies in both hemispheres with the seasons.
‘Considering the estimated wide range of average temperatures in the past 20,000 years. that is not very good self regulating.’
Actually, considering the magnitude and variability of the ‘forcings’ it deals with over geological time, the system does an amazing job of maintaining stasis around numerous set points. Re. the current ‘warming’ of 0.8C, I doubt your home thermostat is that effective.
Every single bullet point is lie based, e.g., Energy Independence = use of Chinese coal produced solar panels, mined rare earth minerals, Chinese resins, etc. Preserve Rainforests = cut them down for solar or wind farms or palm oil plantations.
As usual, no data in the link. What is needed for it to be informative is not GW, but GWh. As usual, GWh is a term that isn’t even mentioned. Can’t make any informed judgment from the piece.
Is it a mistake, or are they simply trying to obfuscate the fact that 6.6 GWh, is sufficient to meet California’s electricity demand for maybe 20 minutes or so?
No, no, no, people. Here’s the deal.
All Californians need to go to sleep 20 minutes after sunset, The power will come back on a little after sunrise.
But for the wealthy there are also extended evening hours utilizing solid fuel wicked combustion illumination devices, sometimes referred to as ‘candles’.
Or you can attend the nearest mostly-peaceful protest and see by the light of the burning police station.
Knowing who is in charge in the California State government, I would not be surprised if the intent was to obfuscate. I’d probably be even less surprised is they didn’t even know the difference. A recent plot put up by Jacobsen touting that renewables could supply California actually showed California would 3X the current solar capacity and at least 200 GWh of battery capacity to supply California on renewables alone.
Of course the batteries don’t really “power” anything. The generation source that charged the batteries provides the power. The batteries just store and release LESS power, at a later time and at a MASSIVE cost to society, especially the poor, than the true generation source provided to charge the batteries.
Why do you hate the poor so as to want the massive wasteful expense on unreliable generation capacity that MUST be supplemented by massively expensive battery STORAGE? All that money COULD be used to help people.
California allegedly has enough batteries to power 3.6 to 3.8 million homes assuming the batteries are fully changed
If charged to 80% that would be 2.9 to 3.0 million homes
Less efficiency losses from conversion from DC to AC and losses through transmission lines
CA has 12.2 million housing units
CA also has over 700,000 nonresidential building based on its percentage of the total US population (with a total of 6 million US non-residential buildings)
4 hours is far from a whole day.
And new batteries will be needed every 15 to 20 years … and their capacity declines will be at least 1% a year.
CA already has the highest electricity price other than Hawaii
The comments on that video are depressing – that there are THAT many people who believe this sort of thing. (She transmutes energy into water so that she can sweat?)
The posted cartoon says it all for him. He knows there is no emergency, and he thinks the scam is justifiable because it will create a better (socialistic) world. He wants to take from others, using make-believe benefits as an excuse, so he can simply feel that his existence is justified … it is not.
Don’t you enjoy living a good quality of life? Eating good food? Living in a house with efficient air conditioning in the summer and heating in the winter?
In general, a healthy economy equates to a healthy environment too.
Those children who mine cobalt in Congo have to be healthy to do so. Sadly, a few suffocate in collapses.
strativarius
May 12, 2024 3:46 am
Garden taxes are back on the agenda. There are satellites for that.
Families with big gardens, and who live in areas with good schools or lower crime rates, are set to be clobbered by higher taxes as part of the socialist administration’s move to address “property wealth”. More worryingly for English voters, Sir Keir Starmer has now refused to rule out using the same Soviet-style spyware across the UK should it win the election. https://www.express.co.uk/news/politics/1898201/Labour-Wales-council-tax-bombshell
“Sperm whale vocalisations are more expressive and structured than previously believed, and built from a repertoire comprising nearly an order of magnitude more distinguishable codas.”
Codas are their click like calls.
David , I recently came across this pdf from BVG Associates entitled ‘Guide to a Floating Offshore Wind Farm’ published on behalf of the UK Crown Estate and the Crown Estate Scotland in May 2023.
176 pages and lots of photographs. Thought you’d be interested.
Your [U.S.] Tax Dollars At Work: In Two Years, $7.5 Billion Has Produced Just 7 EV Charging Stations
“When people gripe about paying taxes and the government being a poor the absolute worst possible capital allocation, this is what they are talking about: $7.5 billion in investments for electric vehicles has – in two years – produced just 7 charging stations across four states. ” [emphasis in original]
What they need to do right now is to take a portion of this 7.5 billion and re-allocate it to replacing Baltimore’s Key Bridge. That is estimated to cost close to 2 billion to replace and is a project that will benefit far more people than any EV charging station. But of course this corrupt administration won’t do that….far better to waste our taxes on projects that benefit very few people. And worse yet, the beneficiaries are wealthy people!
Ukraine a Corrupt Mafia State – ex-Boris Johnson adviser https://www.windtaskforce.org/profiles/blogs/ukraine-a-corrupt-s-thole-ex-boris-johnson-adviser
.
Backing Kiev pushed Russia and China into an alliance, Dominic Cummings has said
.
The UK and its allies got tricked by the US into backing a “corrupt mafia state” in Ukraine and getting into a war of attrition against a Moscow-Beijing partnership, Dominic Cummings has said in an interview.
.
The longtime Tory political strategist led the Vote-Leave campaign for Brexit and was one of the key aides to then-PM Boris Johnson until resigning in November 2020.
. “We should have never got into the whole stupid situation,” Cummings told the outlet I News, in an interview published on Wednesday, May 8, 2024, commenting on London’s full-throated support for Kiev.
.
He also described Ukraine as a “corrupt state that doesn’t matter at all.” “This is not a replay of 1940 with the Potemkin Zelensky as the Churchillian underdog,” he added. “This whole Ukrainian corrupt mafia state has basically conned us all and we’re all going to get effed as a consequence.”
.
US/EU sanctions have been “disaster” for the EU, but have had a beneficial effect on the growing Russia economy, because Russia successfully diverted its fossil fuel exports to China, India, etc., and is rapidly designing and manufacturing its own products and services to replace EU imports.
.
But the EU and U.K. ended up 1) paying more for imported fossil fuels from various sources, 2) having more expensive goods and services (making them less competitive on world markets), 3) having a lower standard of living, and 4) facing a growing alliance between Moscow and Beijing, according to Cummings.
.
All the West managed to do is get into a war of attrition with Russia, “who we pushed into an alliance with the world’s biggest manufacturing power.”
. British sanctions failing to harm Russia – UK MP
Cummings also addressed the argument that Russian President Vladimir Putin needed to be “taught a lesson” about invading neighbors.
. “The lesson we’ve taught Putin is that we’re a bunch of total jokers,” he said. “I mean, Putin already knew that before the war. But this Ukraine fiasco has emphasized it, and broadcast it the entire world, what a bunch of clowns we are,” he added.
.
In addition to the disastrous sanctions regime, the US/EU is also shooting themselves in the foot, trying to illegally seize frozen Russian assets, thereby undermining the global financial system controlled by the US/EU. The US/EU is encouraging the emergence of a BRISC-led financial system.
.
The US/EU wants to use these Russian assets to pay for the costs of Ukraine
But, the US/UK/EU has $260 billion of direct investments in Russia, which will be seized dollar for dollar.
.
Cummings slammed Johnson – with whom he is no longer on speaking terms – for using the Ukraine conflict for “acting out his Churchillian fantasies,” as well as the Parliament, which “swallowed all of his total BS on Ukraine and actually took it seriously.”
.
Johnson was the key figure in getting Kiev to reject a peace deal with Russia in April 2022, according to the top Ukrainian negotiator, as well as Ukrainian media.
.
The former PM Boris Johnson denied his role in scuttling the talks, calling the account “total nonsense and Russian propaganda.”
However, he confirmed that he told Zelensky the UK would back him “a thousand percent” and that any deal with Moscow would be bad.
Russia and China have won over much of Africa, too, while old colonial masters try to bully them, deny them loans to develop their own cheap fossil fuel resources, even assessing tariffs on products if they don’t go renewable.
That continent is kicking old colonial masters (and the US) out. Macron is getting it the worst. Europe has squandered the world’s largest opportunity to forge the biggest economic partnerships the world with former colonies.
Urban Heat Archipelagos
UHAs, such as on the US East Coast, from Portland, Maine, to Norfolk, Virginia, significantly contribute to local warming. That area used to be covered with forests.
Many large solar systems in the US Southwest add up to a heat archipelago, plus the very hot PV panels have very low efficiencies at high temperatures
Adaptation, such as increasing the width and height of dikes, and capacities of culvert and storm sewer systems, etc., planting billions of trees each year, rebuilding the rain forests, etc., will be required.
Because, huge quantities of solar energy are collected in the Tropics to warm the planet each day, preservation of the world’s rain forest belt is vital for the future well-being of the earth.
That should have priority over expensive, unfeasible, wind/solar/battery/EV/heat pump, etc., measures, implemented mostly in temperate zones.
. https://storage.ning.com/topology/rest/1.0/file/get/12390020087?profile=RESIZE_710x . Important Role of CO2 for Flora and Fauna Growth
Plants require require at least 1000 to 1200 ppm of CO2, as proven in greenhouses
Many plants have become extinct, along with the fauna they supported, due to a lack of CO2
As a result, many areas of the world became arid and deserts.
The current CO2 needs to at least double or triple
Earth temperature increased about 1.2 C since 1900, which is due to many causes, such as fossil CO2, flora CO2, and permafrost methane which converts to CO2.
.
CO2 emissions of fossil fuels are a blessing.
CO2 has increased from about 296 ppm in 1900 to 423 ppm at end 2023, and
1) Increased world greening by at least 10 to 15%, as measured by satellites since 1979. Increased greening produces oxygen by photosynthesis. It forms a filter in the upper atmosphere that absorbs harmful UV radiation, with wavelengths below 240 nm.
2) Increased world fauna
3) Increased crop yields per acre.
4) Reduced world desert areas
. https://www.windtaskforce.org/profiles/blogs/new-study-2001-2020-global-greening-is-an-indisputable-fact-and https://www.windtaskforce.org/profiles/blogs/co2-is-a-life-gas-no-co2-no-life https://www.windtaskforce.org/profiles/blogs/co2-is-not-pollution-it-s-the-currency-of-life . Benefits of CO2 https://issuu.com/johna.shanahan/docs/co2_pitch_4-3-24_baeuerle_english . Oceans Absorb CO2
Sea water contains 3.5% salt, NaCl, by weight.
CO2 molecules continuously move from the air into sea water, per Henry’s Law
CO2 and NaCl form many compounds that contain C, O2, H2, Cl. They sustain flora and fauna in the oceans.
At the surface, seawater pH = 8.1, CO2 423 ppm, the % presence of [CO2], [HCO3−], and [CO3 2−] is 0.5, 89, and 10.5; “Free” CO2 molecules at the surface, is only 0.5%; CO2 out-migration is minimal, given the conditions.
As a result, the oceans are a major sink of CO2 from human and natural sources in the TS.
At least 40% of new CO2 in the TS, human and natural, is added to the oceans; about 50% stays in the TS https://tos.org/oceanography/assets/docs/14-4_feely.pdf
Something does not add up, we are emitting 30+ gigatons of CO2 annually, Atmospheric CO2 increases roughly 2 PPM each year. One (1) ppm weighs 2.13 gigatons. It would appear that the atmosphere is retaining much less than 50% of emissions. When an atmospheric CO2 molecule touches water below the temperature threshold it instantly enters. And the vast majority of CO2 molecules entering the Ocean environment are instantly attacked by a variety of Ions such as calcium and magnesium and consequently settle in the ocean sediments. The amount of CO2 the oceans can hold is related to the distribution of various ions throughout the oceanic water column.
When the sun goes down plants produce CO2, how large are those emissions?
Yes, some years ago I wrote an article, fossil CO2 was 65% of human total, the other 35% from other human sources.
If all that CO2 already “out there” were reduced to ZERO, with zero people, the CO2 already in the atmosphere would continue to do “its less than one % thing” for hundreds of years.
See my articles regarding retained energy in atmosphere.
(1) With all the progess which has allegedly been made in California in replacing expensive gas and nuclear with cheap wind and solar using grid-scale batteries as a key enabler for greater reliance on the renewables, why is it that the price of electricity in California continues to rise?
(2) California relies on the Western Interconnect for roughly 30% of its power. Where is the all-up engineering feasibility analysis for replacing the gas-fired and coal-fired power generation now attached to the Western Interconnect with a combination of wind and solar backed by grid-scale batteries? Why hasn’t the Western Electricity Coordination Council (WECC) published this kind of all-up engineering feasibility analysis?
The below analysis shows why California electric rates have been increasing at 3 times the rate of US electric rates
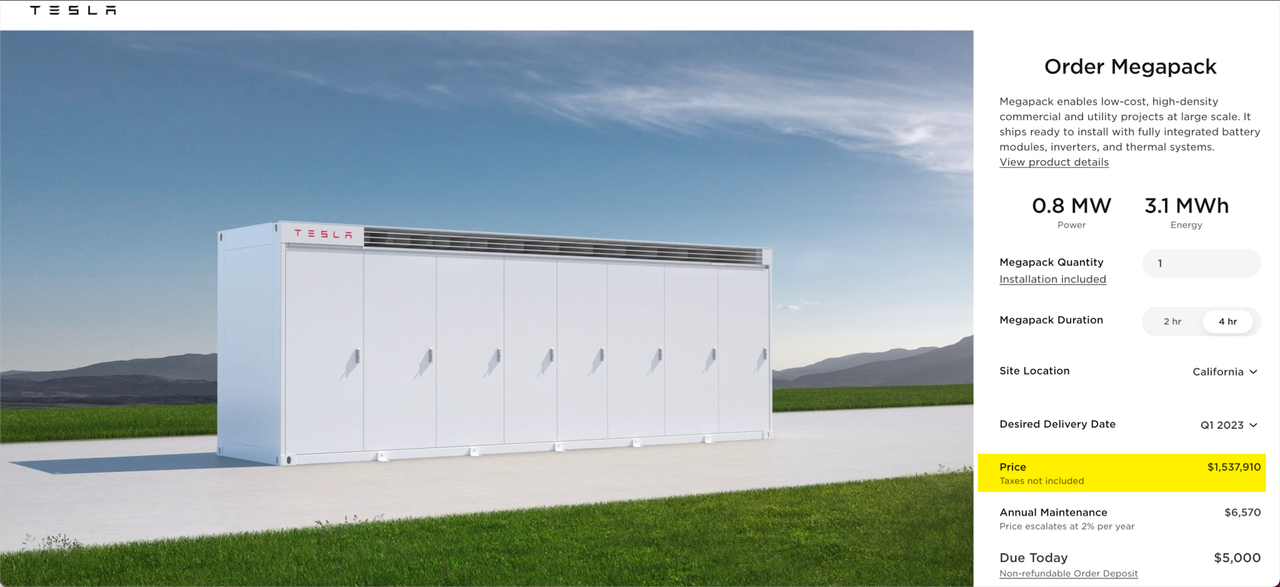
Example of Turnkey Cost of Large-Scale, Megapack Battery System, 2023 pricing
The system consists of 50 Megapack 2, rated 45.3 MW/181.9 MWh, 4-h energy delivery
Power = 50 Megapacks x 0.979 MW x 0.926, Tesla design factor = 45.3 MW
Energy = 50 Megapacks x 3.916 MWh x 0.929, Tesla design factor = 181.9 MWh
Estimate of supply by Tesla, $90 million, or $495/kWh. See URL
Estimate of supply by Others, $14.5 million, or $80/kWh All-in, turnkey cost about $575/kWh; 2023 pricing https://www.tesla.com/megapack/design ?itok=lxTa2SlF https://www.zerohedge.com/commodities/tesla-hikes-megapack-prices-commodity-inflation-soars
Annual Cost of Megapack Battery Systems; 2023 pricing
Assume a system rated 45.3 MW/181.9 MWh, and an all-in turnkey cost of $104.5 million, per Example 2
Amortize bank loan for 50% of $104.5 million at 6.5%/y for 15 years, $5.484 million/y
Pay Owner return of 50% of $104.5 million at 10%/y for 15 years, $6.765 million/y (10% due to high inflation)
Lifetime (Bank + Owner) payments 15 x (5.484 + 6.765) = $183.7 million
Assume battery daily usage for 15 years at 10%, and loss factor = 1/(0.9 *0.9)
Battery lifetime output = 15 y x 365 d/y x 181.9 MWh x 0.1, usage x 1000 kWh/MWh = 99,590,250 kWh to HV grid; 122,950,926 kWh from HV grid; 233,606,676 kWh loss
(Bank + Owner) payments, $183.7 million / 99,590,250 kWh = 184.5 c/kWh
Less 50% subsidies (ITC, depreciation in 5 years, deduction of interest on borrowed funds) is 92.3c/kWh At 10% usage, (Bank + Owner) cost, 92.3 c/kWh At 40% usage, (Bank + Owner) cost, 23.1 c/kWh
Excluded costs/kWh: 1) O&M; 2) system aging, 1.5%/y, 3) 19% HV grid-to-HV grid loss, 3) grid extension/reinforcement to connect battery systems, 5) downtime of parts of the system, 6) decommissioning in year 15, i.e., disassembly, reprocessing and storing at hazardous waste sites. The excluded costs add at least 15 c/kWh
COMMENTS ON CALCULATION
Almost all existing battery systems operate at less than 10%, per EIA annual reports i.e., new systems would operate at about 92.4 + 15 = 107.4 c/kWh. They are used to stabilize the grid, i.e., frequency control and counteracting up/down w/s outputs. If 40% throughput, 23.1 + 15 = 38.1 c/kWh.
Up to 40% could occur by absorbing midday solar peaks and discharging during late-afternoon/early-evening, which occur every day in California and other sunny states. The more solar systems, the greater the peaks.
We are not even talking about longer-term storage, as during a multi-day w/s lull.
40% throughput is close to Tesla’s recommendation of 60% maximum throughput, i.e., not charging above 80% full and not discharging below 20% full, to achieve a 15-y life, with normal aging.
Tesla’s recommendation was not heeded by the Owners of the Hornsdale Power Reserve in Australia. They excessively charged/discharged the system. After a few years, they added Megapacks to offset rapid aging of the original system, and added more Megapacks to increase the rating of the expanded system. http://www.windtaskforce.org/profiles/blogs/the-hornsdale-power-reserve-largest-battery-system-in-australia
Regarding any project, the bank and Owner have to be paid, no matter what. I amortized the bank loan and Owner’s investment
Divide total payments over 15 years by the throughput during 15 years, you get c/kWh, as shown.
There is about a 20% round-trip loss, from HV grid to 1) step-down transformer, 2) front-end power electronics, 3) into battery, 4) out of battery, 5) back-end power electronics, 6) step-up transformer, to HV grid, i.e., you draw about 50 units from the HV grid to deliver about 40 units to the HV grid, because of A-to-Z system losses. That gets worse with aging.
A lot of people do not like these c/kWh numbers, because they have been repeatedly told by self-serving folks, battery Nirvana is just around the corner.
At $575/kWhr, the capital cost to make solar a 24 hour power source would be at least $8050/kW assuming 14 hours of back up (probably generous) and 100% cycling. Going down to 50% cycling (25% to 75%) would double that cost, so we’re looking at $16,000/kW or $16 billion/GW just for the batteries. This is about the same as the Vogtle units 3 & 4 and doesn’t include the cost of solar generation.
Vogtle will last at least 60 years, 2.5 times Solar, and have a capacity factor of about 0.9
A 4-h battery system costs 38.1 c/kWh of throughput, if operated at a duty factor of 40%.
That is on top of the cost/kWh of the electricity taken from the HV grid to feed the batteries
California is in total denial about the cost of solar, because of feel-good brainwashing, plus the CO2 released before a panel is operating is at least 4 times greater than the “approved” values.
I spent 40 years in the power industry and did many feasibility and cost studies.
California is showing some signs of coming out of denial, realizing the Cal-ISO wasn’t kidding about the “solar duck”. One recent development is that new “rooftop” solar generation will only be credited for the wholesale price of electricity as opposed to retail price.
Speaking of the “solar duck”, California could (and probably should) have done a lot more to facilitate electric car charging during the peak times for solar generation. #1 was encouraging a lot more charging station where people park their electric cars during the daytime.
Your power industry experience definitely comes through – while never working in the power industry, I did take a couple of electric power systems classes at Cal back in the mid-70’s.
Climeworks did not give an exact cost for each ton of carbon removed, but said it was closer to $1,000 a ton than $100 a ton – the latter of which is widely seen as a key threshold for making the technology affordable and viable.
And since nature holds sway on the atmospheric CO2 balance….
…. will achieve absolutely NOTHING.
Capt Jeff
May 12, 2024 10:15 am
If you have a Facebook page, on Tuesday be sure to wish Mark Zuckerberg a happy birthday and congratulations on his self gifting himself his new diesel powered mega yacht Launchpad.
Hope he invites his climate misinformation fact checkers for a ride.
A look at how that Drax CFD is doing: now that the Baseload Reference Price is back below the strike price the plant is getting fired up. Because the BMRP is set for winter and for summer seasons based on the preceding six months of baseload price quotations there has been a delay in the price falling compared with day ahead markets. The only real function of the BMRP is to set the subsidy or tax applied to output. When it amounted to a huge tax the plant shut down exwept in donitions of extreme market stresss.
Today’s temperatures will be a low of 12C and a high of 25C A difference of 13 degrees…
The world is on the verge of a climate abyss, the UN has warned, in response to a Guardian survey that found that hundreds of the world’s foremost climate experts expect global heating to soar past the international target of 1.5C.
https://www.theguardian.com/environment/article/2024/may/09/world-is-on-verge-of-climate-abyss-un-warns
It’s going to be a lovely day – beers in the fridge, bbq ready to go
No anxieties, here.
I happen to like beverages that are produced from C3 plants.
“Soar past” to what? 1.6 C? 2.1? What defines soaring is the point.
Quote without comment, from the Telegraph:
The ONS this week published the latest figures for environmental taxes and they make for sobering reading.
In 2023, the UK squeezed £52.5bn out of the economy in green taxes, a 4.9pc increase year-on-year, and it is now close to its pre-pandemic high.
The revenue raised by green taxes has almost doubled since 2000. Within that, fuel duty is by far the biggest contributor, accounting for nearly £25bn.
The UK’s Emissions Trading Scheme – which seeks to reduce greenhouse gas (GHG) emissions in energy intensive sectors – now raises close to £6bn. Air passenger duty brings in £3.7bn, and the climate change levy – an environmental tax charged on the energy businesses use – close to £2bn.
Add it all up, and it is turning into a major burden. The average household paid £623 in green levies in 2021, up from £575 in 2020. They accounted for 5.5pc of government revenue, and took 2pc out of total GDP, in 2022. And that’s before the shadow climate change secretary Ed Miliband gets to work, as he almost certainly will later this year.
And if you want two totally different points of view on the Vermont proposed legislation, here they are.
Ars has the usual fanaticism (read the comments after the story). It seems most denizens would like to abolish the oil and gas companies.
https://arstechnica.com/tech-policy/2024/05/vermont-close-to-becoming-first-state-to-charge-big-oil-for-climate-damage/?comments=1&comments-page=1
Then there is a more level headed discussion of the same law by Francis Menton here:
https://www.manhattancontrarian.com/blog/2024-5-11-even-stupider-than-the-stupidest-litigation-in-the-country
I am not seeing how this is ever settled.
Wow, thanks for posting these links. Vermont has chosen very poorly. What next? Blame the sun for evaporating all that water that came down as rain and caused the floods? Completely nuts.
Looks like most of the commenters on that VT site like the essay. VT may be even crazier than Wokeachusetts!
Wow, time passes quickly.
It was two years ago this week that WUWT posted this essay.
https://wattsupwiththat.com/2022/05/16/wuwt-contest-runner-up-professional-nasa-knew-better-nasa_knew/
The NASA web article, to which I made reference in the essay, was posted Jan 14, 2009. Over 15 years ago. They knew very well back then that the static sense of the radiative effect of incremental GHGs was incomplete and misleading. Put the atmosphere (and oceans) into circulation, and one need not expect the heat energy involved in the static radiative effect to accumulate on land and in the oceans, certainly not to harmful effect.
The entire “climate” movement is based on the “forcing” + “feedback” framing of the study of the climate system response to incremental GHGs.
Better to re-discover that the atmosphere is the working fluid of its own heat-engine operation, at local to global scale, in response to absorbed energy. This includes the IR emitted from the surface and absorbed by clouds and GHGs. The end result? Dynamic self-regulation. The GHGs never added any energy of their own, and the atmosphere itself (including clouds) is the emitter to space that matters most.
‘The NASA web article, to which I made reference in the essay, was posted Jan 14, 2009. Over 15 years ago. They knew very well back then that the static sense of the radiative effect of incremental GHGs was incomplete and misleading.’
That’s about the same vintage as Trenbert & Fasullo [2009]:
‘There is an increase in net radiation absorbed, but not in ways commonly assumed. While there is a large increase in the greenhouse effect from increasing greenhouse gases and water vapor (as a feedback), this is offset to a large degree by a decreasing greenhouse effect from reducing cloud cover and increasing radiative emissions from higher temperatures. Instead the main warming from an energy budget standpoint comes from increases in absorbed solar radiation that stem directly from the decreasing cloud amounts.’
https://agupubs.onlinelibrary.wiley.com/doi/full/10.1029/2009GL037527
In a nutshell, the ‘canonical’ narrative wherein increasing CO2 emissions block OLR until the surface warms up sufficiently to re-establish radiative balance at TOA isn’t ‘collaborated’ by the models. The convenient upshot to this is that all observations, including increasing OLR concurrent with decreasing cloud cover, are considered verification of CAGW.
“That’s about the same vintage…”
Yes. I credit the contributors/editors/approvers of the NASA article with a more balanced description than one would understand, say, from IPCC AR4, which had been issued a couple of years earlier.
“The convenient upshot to this is that all observations, including increasing OLR concurrent with decreasing cloud cover, are considered verification of CAGW.” Yes, that is how it will likely be played, disregarding the obvious circular reasoning this requires.
Thanks. To me, the evolution of the CO2-forced greenhouse mechanism to conform with the GCMs effectively leaves all of alarmist science non-falsifiable by observation, outside of a mile of ice over NYC. It really is a case of ‘special pleading’.
Dynamic self-regulation?
Considering the estimated wide range of average temperatures in the past 20,000 years. that
is not very good self regulating/
Also, changes in cloudiness do not explain warmer nights since 1975, especially if cloud cover percentage is declining. The claimed 7% decline in the past few decades may be statistically insignificant for the imprecise estimate of the percentage of cloud cover.
Hello Richard, nice to hear from you.
There is a wide range of average temperatures on a planet-wide basis EVERY year. The dynamic self-regulation (i.e. the heat engine circulation ending up dissipating energy to space) is in response to absorbed energy, which of course varies in both hemispheres with the seasons.
https://climatereanalyzer.org/clim/t2_daily/?dm_id=world
I made no claim that “changes in cloudiness” explain “warmer nights since 1975.”
The only places you could possibly know if “nights were warmer” is where surface temperatures are measured…
… that is mostly in URBAN areas.
Some old pristine rural stations in Australia show NO night time warming trend at all.
So much for that argument…..
‘Considering the estimated wide range of average temperatures in the past 20,000 years. that is not very good self regulating.’
Actually, considering the magnitude and variability of the ‘forcings’ it deals with over geological time, the system does an amazing job of maintaining stasis around numerous set points. Re. the current ‘warming’ of 0.8C, I doubt your home thermostat is that effective.
You have to apply a little logic. The sun warms the oceans. The oceans warm the atmosphere, day and night.
I always like this picture…
Link time! I bet you missed me last week 😀
Batteries are taking on gas plants to power California’s nights
https://www.canarymedia.com/articles/batteries/batteries-are-taking-on-gas-plants-to-power-californias-nights
More people care about climate change than you think
https://ourworldindata.org/grapher/willingness-climate-action
I bet you missed me last week
Then, you lost the bet.
A legend in his own mind.
Every single bullet point is lie based, e.g., Energy Independence = use of Chinese coal produced solar panels, mined rare earth minerals, Chinese resins, etc. Preserve Rainforests = cut them down for solar or wind farms or palm oil plantations.
🤣🤣🤣🤣
As usual, no data in the link. What is needed for it to be informative is not GW, but GWh. As usual, GWh is a term that isn’t even mentioned. Can’t make any informed judgment from the piece.
We can make the informed judgement that the author has no real clue what he’s talking about.
Perhaps more alarmingly, if you visit the California Energy Commission,https://www.energy.ca.gov/data-reports/energy-almanac/california-electricity-data/california-energy-storage-system-survey, they make the same mistake.
Edit:
Is it a mistake, or are they simply trying to obfuscate the fact that 6.6 GWh, is sufficient to meet California’s electricity demand for maybe 20 minutes or so?
I’m surprised they didn’t mention it in MWh that would be a much higher figure and far more impressive to the unknowing 🙂
No, no, no, people. Here’s the deal.
All Californians need to go to sleep 20 minutes after sunset, The power will come back on a little after sunrise.
But for the wealthy there are also extended evening hours utilizing solid fuel wicked combustion illumination devices, sometimes referred to as ‘candles’.
Or you can attend the nearest mostly-peaceful protest and see by the light of the burning police station.
Knowing who is in charge in the California State government, I would not be surprised if the intent was to obfuscate. I’d probably be even less surprised is they didn’t even know the difference. A recent plot put up by Jacobsen touting that renewables could supply California actually showed California would 3X the current solar capacity and at least 200 GWh of battery capacity to supply California on renewables alone.
Of course the batteries don’t really “power” anything. The generation source that charged the batteries provides the power. The batteries just store and release LESS power, at a later time and at a MASSIVE cost to society, especially the poor, than the true generation source provided to charge the batteries.
Why do you hate the poor so as to want the massive wasteful expense on unreliable generation capacity that MUST be supplemented by massively expensive battery STORAGE? All that money COULD be used to help people.
California allegedly has enough batteries to power 3.6 to 3.8 million homes assuming the batteries are fully changed
If charged to 80% that would be 2.9 to 3.0 million homes
Less efficiency losses from conversion from DC to AC and losses through transmission lines
CA has 12.2 million housing units
CA also has over 700,000 nonresidential building based on its percentage of the total US population (with a total of 6 million US non-residential buildings)
4 hours is far from a whole day.
And new batteries will be needed every 15 to 20 years … and their capacity declines will be at least 1% a year.
CA already has the highest electricity price other than Hawaii
Where are those batteries? I want to be miles away when they go boom.
Liar.
No food needed supposedly.
“Let them eat air!”
The comments on that video are depressing – that there are THAT many people who believe this sort of thing. (She transmutes energy into water so that she can sweat?)
Yes. It doesn’t take much for people to believe anything.
Someone sent me this and I thought I’d share, made me laugh.
https://youtu.be/BnvRmj7G3XE?si=dP6WlDqNkrFgS1w8
So Lusername is from Melbourne apparently.
Well, when are you going to get on the band wagon and stop using fossil fuels??
*the sound of crickets*
Everything in Luser’s pitiful life is there because of fossil fuels and their derivatives and use.
Without them, it could not exist.
The posted cartoon says it all for him. He knows there is no emergency, and he thinks the scam is justifiable because it will create a better (socialistic) world. He wants to take from others, using make-believe benefits as an excuse, so he can simply feel that his existence is justified … it is not.
He is a bit worse than a simple waste of oxygen.
Don’t you enjoy living a good quality of life? Eating good food? Living in a house with efficient air conditioning in the summer and heating in the winter?
In general, a healthy economy equates to a healthy environment too.
> In general
What’s that – an (gasp!) average?
Pascal’s wager.
Wind and solar and the whole AGW scam ARE NOT creating a better world.
They, along with many other bits of odious leftist idiotologies are aimed directly at destroying western society.
They are destroying energy independence.
They are chopping down forests to install wind turbines
Wind and solar are NOT sustainable
Green jobs are basically a myth.
Cities become unliveable if deprived of reliable energy.
Renewables are a pointless waste of money and resources.
The cleanest water and air is in western countries, where energy allows it to be a priority
The green agenda is making children’s health and minds sick.
Those children who mine cobalt in Congo have to be healthy to do so. Sadly, a few suffocate in collapses.
Garden taxes are back on the agenda. There are satellites for that.
Families with big gardens, and who live in areas with good schools or lower crime rates, are set to be clobbered by higher taxes as part of the socialist administration’s move to address “property wealth”.
More worryingly for English voters, Sir Keir Starmer has now refused to rule out using the same Soviet-style spyware across the UK should it win the election.
https://www.express.co.uk/news/politics/1898201/Labour-Wales-council-tax-bombshell
A big garden in London?
Seems that crime and poverty everywhere is to be subsidized.
Some are fortunate enough to have a little more than most. I get the feeling that this one will be granted an exemption though.
Sperm whales have complex language
New research:
“Contextual and combinatorial structure in sperm whale vocalisations”
Open access at:
https://www.nature.com/articles/s41467-024-47221-8
“Sperm whale vocalisations are more expressive and structured than previously believed, and built from a repertoire comprising nearly an order of magnitude more distinguishable codas.”
Codas are their click like calls.
If only they could vote.
I bet their vocalisations are more intelligent, than our politicians in the UK.
David , I recently came across this pdf from BVG Associates entitled ‘Guide to a Floating Offshore Wind Farm’ published on behalf of the UK Crown Estate and the Crown Estate Scotland in May 2023.
176 pages and lots of photographs. Thought you’d be interested.
Search ‘BVGA-1644-Floating-Guide’
Your [U.S.] Tax Dollars At Work: In Two Years, $7.5 Billion Has Produced Just 7 EV Charging Stations
“When people gripe about paying taxes and the government being
a poorthe absolute worst possible capital allocation, this is what they are talking about: $7.5 billion in investments for electric vehicles has – in two years – produced just 7 charging stations across four states. ” [emphasis in original]https://www.zerohedge.com/markets/your-tax-dollars-work-75-billion-has-produced-just-7-charging-stations-across-four-states
What they need to do right now is to take a portion of this 7.5 billion and re-allocate it to replacing Baltimore’s Key Bridge. That is estimated to cost close to 2 billion to replace and is a project that will benefit far more people than any EV charging station. But of course this corrupt administration won’t do that….far better to waste our taxes on projects that benefit very few people. And worse yet, the beneficiaries are wealthy people!
No, it is way more important to ship off more untold billions to Ukraine so that the kickbacks to the pols can be done before the Nov. election.
Ukraine a Corrupt Mafia State – ex-Boris Johnson adviser
https://www.windtaskforce.org/profiles/blogs/ukraine-a-corrupt-s-thole-ex-boris-johnson-adviser
.
Backing Kiev pushed Russia and China into an alliance, Dominic Cummings has said
.
The UK and its allies got tricked by the US into backing a “corrupt mafia state” in Ukraine and getting into a war of attrition against a Moscow-Beijing partnership, Dominic Cummings has said in an interview.
.
The longtime Tory political strategist led the Vote-Leave campaign for Brexit and was one of the key aides to then-PM Boris Johnson until resigning in November 2020.
.
“We should have never got into the whole stupid situation,” Cummings told the outlet I News, in an interview published on Wednesday, May 8, 2024, commenting on London’s full-throated support for Kiev.
.
He also described Ukraine as a “corrupt state that doesn’t matter at all.”
“This is not a replay of 1940 with the Potemkin Zelensky as the Churchillian underdog,” he added. “This whole Ukrainian corrupt mafia state has basically conned us all and we’re all going to get effed as a consequence.”
.
US/EU sanctions have been “disaster” for the EU, but have had a beneficial effect on the growing Russia economy, because Russia successfully diverted its fossil fuel exports to China, India, etc., and is rapidly designing and manufacturing its own products and services to replace EU imports.
.
But the EU and U.K. ended up 1) paying more for imported fossil fuels from various sources, 2) having more expensive goods and services (making them less competitive on world markets), 3) having a lower standard of living, and 4) facing a growing alliance between Moscow and Beijing, according to Cummings.
.
All the West managed to do is get into a war of attrition with Russia, “who we pushed into an alliance with the world’s biggest manufacturing power.”
.
British sanctions failing to harm Russia – UK MP
Cummings also addressed the argument that Russian President Vladimir Putin needed to be “taught a lesson” about invading neighbors.
.
“The lesson we’ve taught Putin is that we’re a bunch of total jokers,” he said. “I mean, Putin already knew that before the war.
But this Ukraine fiasco has emphasized it, and broadcast it the entire world, what a bunch of clowns we are,” he added.
.
In addition to the disastrous sanctions regime, the US/EU is also shooting themselves in the foot, trying to illegally seize frozen Russian assets, thereby undermining the global financial system controlled by the US/EU. The US/EU is encouraging the emergence of a BRISC-led financial system.
.
The US/EU wants to use these Russian assets to pay for the costs of Ukraine
But, the US/UK/EU has $260 billion of direct investments in Russia, which will be seized dollar for dollar.
.
Cummings slammed Johnson – with whom he is no longer on speaking terms – for using the Ukraine conflict for “acting out his Churchillian fantasies,” as well as the Parliament, which “swallowed all of his total BS on Ukraine and actually took it seriously.”
.
Johnson was the key figure in getting Kiev to reject a peace deal with Russia in April 2022, according to the top Ukrainian negotiator, as well as Ukrainian media.
.
The former PM Boris Johnson denied his role in scuttling the talks, calling the account “total nonsense and Russian propaganda.”
However, he confirmed that he told Zelensky the UK would back him “a thousand percent” and that any deal with Moscow would be bad.
Russia and China have won over much of Africa, too, while old colonial masters try to bully them, deny them loans to develop their own cheap fossil fuel resources, even assessing tariffs on products if they don’t go renewable.
That continent is kicking old colonial masters (and the US) out. Macron is getting it the worst. Europe has squandered the world’s largest opportunity to forge the biggest economic partnerships the world with former colonies.
https://www.reuters.com/world's/africa/russian-troops-enter-base-housing-us-military-niger-us-official-says-2024-05-02/
https://www.bbc.com/news/world-africa-58751423
Excerpt from
https://www.windtaskforce.org/profiles/blogs/natural-forces-cause-periodic-global-warming
https://www.windtaskforce.org/profiles/blogs/hunga-tonga-volcanic-eruption
Urban Heat Archipelagos
UHAs, such as on the US East Coast, from Portland, Maine, to Norfolk, Virginia, significantly contribute to local warming. That area used to be covered with forests.
Many large solar systems in the US Southwest add up to a heat archipelago, plus the very hot PV panels have very low efficiencies at high temperatures
Adaptation, such as increasing the width and height of dikes, and capacities of culvert and storm sewer systems, etc., planting billions of trees each year, rebuilding the rain forests, etc., will be required.
Because, huge quantities of solar energy are collected in the Tropics to warm the planet each day, preservation of the world’s rain forest belt is vital for the future well-being of the earth.
That should have priority over expensive, unfeasible, wind/solar/battery/EV/heat pump, etc., measures, implemented mostly in temperate zones.
.
https://storage.ning.com/topology/rest/1.0/file/get/12390020087?profile=RESIZE_710x
.
Important Role of CO2 for Flora and Fauna Growth
Plants require require at least 1000 to 1200 ppm of CO2, as proven in greenhouses
Many plants have become extinct, along with the fauna they supported, due to a lack of CO2
As a result, many areas of the world became arid and deserts.
The current CO2 needs to at least double or triple
Earth temperature increased about 1.2 C since 1900, which is due to many causes, such as fossil CO2, flora CO2, and permafrost methane which converts to CO2.
.
CO2 emissions of fossil fuels are a blessing.
CO2 has increased from about 296 ppm in 1900 to 423 ppm at end 2023, and
1) Increased world greening by at least 10 to 15%, as measured by satellites since 1979. Increased greening produces oxygen by photosynthesis. It forms a filter in the upper atmosphere that absorbs harmful UV radiation, with wavelengths below 240 nm.
2) Increased world fauna
3) Increased crop yields per acre.
4) Reduced world desert areas
.
https://www.windtaskforce.org/profiles/blogs/new-study-2001-2020-global-greening-is-an-indisputable-fact-and
https://www.windtaskforce.org/profiles/blogs/co2-is-a-life-gas-no-co2-no-life
https://www.windtaskforce.org/profiles/blogs/co2-is-not-pollution-it-s-the-currency-of-life
.
Benefits of CO2
https://issuu.com/johna.shanahan/docs/co2_pitch_4-3-24_baeuerle_english
.
Oceans Absorb CO2
Sea water contains 3.5% salt, NaCl, by weight.
CO2 molecules continuously move from the air into sea water, per Henry’s Law
CO2 and NaCl form many compounds that contain C, O2, H2, Cl. They sustain flora and fauna in the oceans.
At the surface, seawater pH = 8.1, CO2 423 ppm, the % presence of [CO2], [HCO3−], and [CO3 2−] is 0.5, 89, and 10.5; “Free” CO2 molecules at the surface, is only 0.5%; CO2 out-migration is minimal, given the conditions.
As a result, the oceans are a major sink of CO2 from human and natural sources in the TS.
At least 40% of new CO2 in the TS, human and natural, is added to the oceans; about 50% stays in the TS
https://tos.org/oceanography/assets/docs/14-4_feely.pdf
Something does not add up, we are emitting 30+ gigatons of CO2 annually, Atmospheric CO2 increases roughly 2 PPM each year. One (1) ppm weighs 2.13 gigatons. It would appear that the atmosphere is retaining much less than 50% of emissions. When an atmospheric CO2 molecule touches water below the temperature threshold it instantly enters. And the vast majority of CO2 molecules entering the Ocean environment are instantly attacked by a variety of Ions such as calcium and magnesium and consequently settle in the ocean sediments. The amount of CO2 the oceans can hold is related to the distribution of various ions throughout the oceanic water column.
When the sun goes down plants produce CO2, how large are those emissions?
Fossil fuel CO2 was 37.55 Gt, or 4.8 ppm in 2023.
https://gml.noaa.gov/webdata/ccgg/trends/co2/co2_annmean_mlo.txt
(Human + natural) CO2 was 418.53 in 2022 + 2.55 ppm in 2023 added to the atmosphere in 2023.
The rest of (human + natural) CO2 was absorbed by oceans and other sinks
Each CO2 ppm = 7.821 Gt
The Mauna Loa curve shows an annual variation of 8 – 9 ppm during a year, due to biomass growth and decay of the seasons.
Photosynthesis 6CO2 + 6H2O → C6H12O6 (glucose) + 6O2
We need more biomass/trees to provide CO2 for trees so they can produce O2
.
Fossil fuels are a lower-bound on anthropogenic emissions.
http://wattsupwiththat.com/2015/05/05/anthropogenic-global-warming-and-its-causes/
Yes, some years ago I wrote an article, fossil CO2 was 65% of human total, the other 35% from other human sources.
If all that CO2 already “out there” were reduced to ZERO, with zero people, the CO2 already in the atmosphere would continue to do “its less than one % thing” for hundreds of years.
See my articles regarding retained energy in atmosphere.
SUMMARY OF WORLD CO2eq EMISSIONS; ALL SOURCES AND ENERGY RELATED
https://www.windtaskforce.org/profiles/blogs/summary-of-world-co2eq-emissions-all-sources-and-energy-related
Thank you for the links.
SUMMARY OF WORLD CO2eq EMISSIONS; ALL SOURCES AND ENERGY RELATED
https://www.windtaskforce.org/profiles/blogs/summary-of-world-co2eq-emissions-all-sources-and-energy-related
Aghh, now I see my confusion, carbon emission stats are the estimated weight of carbon not CO2 molecules. A conversion is required.
And, plants respire in the Winter. I doubt that there are good estimates for the emissions from Boreal forests.
The most amazing vertical well path I have ever planned.
Would you drill this well (Lime Green).
Frio, Jackson, Yegua and Queen City prospects in single vertical well bore.
Lions, Tigers and Bears, Oh my…
Myusername: Batteries are taking on gas plants to power California’s nights
Two questions for Myusername:
(1) With all the progess which has allegedly been made in California in replacing expensive gas and nuclear with cheap wind and solar using grid-scale batteries as a key enabler for greater reliance on the renewables, why is it that the price of electricity in California continues to rise?
(2) California relies on the Western Interconnect for roughly 30% of its power. Where is the all-up engineering feasibility analysis for replacing the gas-fired and coal-fired power generation now attached to the Western Interconnect with a combination of wind and solar backed by grid-scale batteries? Why hasn’t the Western Electricity Coordination Council (WECC) published this kind of all-up engineering feasibility analysis?
The below analysis shows why California electric rates have been increasing at 3 times the rate of US electric rates
Example of Turnkey Cost of Large-Scale, Megapack Battery System, 2023 pricing
 ?itok=lxTa2SlF
The system consists of 50 Megapack 2, rated 45.3 MW/181.9 MWh, 4-h energy delivery
Power = 50 Megapacks x 0.979 MW x 0.926, Tesla design factor = 45.3 MW
Energy = 50 Megapacks x 3.916 MWh x 0.929, Tesla design factor = 181.9 MWh
Estimate of supply by Tesla, $90 million, or $495/kWh. See URL
Estimate of supply by Others, $14.5 million, or $80/kWh
All-in, turnkey cost about $575/kWh; 2023 pricing
https://www.tesla.com/megapack/design
https://www.zerohedge.com/commodities/tesla-hikes-megapack-prices-commodity-inflation-soars
Annual Cost of Megapack Battery Systems; 2023 pricing
Assume a system rated 45.3 MW/181.9 MWh, and an all-in turnkey cost of $104.5 million, per Example 2
Amortize bank loan for 50% of $104.5 million at 6.5%/y for 15 years, $5.484 million/y
Pay Owner return of 50% of $104.5 million at 10%/y for 15 years, $6.765 million/y (10% due to high inflation)
Lifetime (Bank + Owner) payments 15 x (5.484 + 6.765) = $183.7 million
Assume battery daily usage for 15 years at 10%, and loss factor = 1/(0.9 *0.9)
Battery lifetime output = 15 y x 365 d/y x 181.9 MWh x 0.1, usage x 1000 kWh/MWh = 99,590,250 kWh to HV grid; 122,950,926 kWh from HV grid; 233,606,676 kWh loss
(Bank + Owner) payments, $183.7 million / 99,590,250 kWh = 184.5 c/kWh
Less 50% subsidies (ITC, depreciation in 5 years, deduction of interest on borrowed funds) is 92.3c/kWh
At 10% usage, (Bank + Owner) cost, 92.3 c/kWh
At 40% usage, (Bank + Owner) cost, 23.1 c/kWh
Excluded costs/kWh: 1) O&M; 2) system aging, 1.5%/y, 3) 19% HV grid-to-HV grid loss, 3) grid extension/reinforcement to connect battery systems, 5) downtime of parts of the system, 6) decommissioning in year 15, i.e., disassembly, reprocessing and storing at hazardous waste sites. The excluded costs add at least 15 c/kWh
COMMENTS ON CALCULATION
Almost all existing battery systems operate at less than 10%, per EIA annual reports i.e., new systems would operate at about 92.4 + 15 = 107.4 c/kWh. They are used to stabilize the grid, i.e., frequency control and counteracting up/down w/s outputs. If 40% throughput, 23.1 + 15 = 38.1 c/kWh.
Up to 40% could occur by absorbing midday solar peaks and discharging during late-afternoon/early-evening, which occur every day in California and other sunny states. The more solar systems, the greater the peaks.
We are not even talking about longer-term storage, as during a multi-day w/s lull.
40% throughput is close to Tesla’s recommendation of 60% maximum throughput, i.e., not charging above 80% full and not discharging below 20% full, to achieve a 15-y life, with normal aging.
Tesla’s recommendation was not heeded by the Owners of the Hornsdale Power Reserve in Australia. They excessively charged/discharged the system. After a few years, they added Megapacks to offset rapid aging of the original system, and added more Megapacks to increase the rating of the expanded system.
http://www.windtaskforce.org/profiles/blogs/the-hornsdale-power-reserve-largest-battery-system-in-australia
Regarding any project, the bank and Owner have to be paid, no matter what. I amortized the bank loan and Owner’s investment
Divide total payments over 15 years by the throughput during 15 years, you get c/kWh, as shown.
There is about a 20% round-trip loss, from HV grid to 1) step-down transformer, 2) front-end power electronics, 3) into battery, 4) out of battery, 5) back-end power electronics, 6) step-up transformer, to HV grid, i.e., you draw about 50 units from the HV grid to deliver about 40 units to the HV grid, because of A-to-Z system losses. That gets worse with aging.
A lot of people do not like these c/kWh numbers, because they have been repeatedly told by self-serving folks, battery Nirvana is just around the corner.
At $575/kWhr, the capital cost to make solar a 24 hour power source would be at least $8050/kW assuming 14 hours of back up (probably generous) and 100% cycling. Going down to 50% cycling (25% to 75%) would double that cost, so we’re looking at $16,000/kW or $16 billion/GW just for the batteries. This is about the same as the Vogtle units 3 & 4 and doesn’t include the cost of solar generation.
Eric
Vogtle will last at least 60 years, 2.5 times Solar, and have a capacity factor of about 0.9
A 4-h battery system costs 38.1 c/kWh of throughput, if operated at a duty factor of 40%.
That is on top of the cost/kWh of the electricity taken from the HV grid to feed the batteries
California is in total denial about the cost of solar, because of feel-good brainwashing, plus the CO2 released before a panel is operating is at least 4 times greater than the “approved” values.
I spent 40 years in the power industry and did many feasibility and cost studies.
California is showing some signs of coming out of denial, realizing the Cal-ISO wasn’t kidding about the “solar duck”. One recent development is that new “rooftop” solar generation will only be credited for the wholesale price of electricity as opposed to retail price.
Speaking of the “solar duck”, California could (and probably should) have done a lot more to facilitate electric car charging during the peak times for solar generation. #1 was encouraging a lot more charging station where people park their electric cars during the daytime.
Your power industry experience definitely comes through – while never working in the power industry, I did take a couple of electric power systems classes at Cal back in the mid-70’s.
The ‘world’s largest’ vacuum to suck climate pollution out of the air just opened. Here’s how it works
So, another mammoth waste of money to do nothing.
and many times the bogus “social cost of carbon” from multiple agencies.
And since nature holds sway on the atmospheric CO2 balance….
…. will achieve absolutely NOTHING.
If you have a Facebook page, on Tuesday be sure to wish Mark Zuckerberg a happy birthday and congratulations on his self gifting himself his new diesel powered mega yacht Launchpad.
Hope he invites his climate misinformation fact checkers for a ride.
https://joannenova.com.au/2024/05/mark-zuckerberg-shows-exactly-how-worried-he-is-about-climate-change-on-his-new-diesel-5000-ton-mega-yacht/
A look at how that Drax CFD is doing: now that the Baseload Reference Price is back below the strike price the plant is getting fired up. Because the BMRP is set for winter and for summer seasons based on the preceding six months of baseload price quotations there has been a delay in the price falling compared with day ahead markets. The only real function of the BMRP is to set the subsidy or tax applied to output. When it amounted to a huge tax the plant shut down exwept in donitions of extreme market stresss.
Imagine this, Polish farmers have had enough Green poison crammed down their throats:
https://www.reuters.com/world/europe/polish-farmers-march-against-green-poison-eu-climate-change-rules-2024-05-10/
Doh, too much planting results in a green glacier.
Or course this is bad:
https://lawrencekstimes.com/2024/04/27/green-glacier-of-trees/
Not climate related but nature being nature, in a zoo:
https://www.newsweek.com/bear-eats-duck-family-kids-zoo-video-1895965
Is draught the new normal in West Australia? Wait, I thought it was dry even in good years…
https://www.abc.net.au/news/2024-05-03/climate-change-reality-hits-home-in-rural-community/103779236
Maybe we need pollution from China after all. No, that is what the article says, but someone will take the model out put this way:
https://phys.org/news/2024-05-north-pacific-due-china-aerosols.amp
Another climate law suit to hurt the consumer:
https://amp.theguardian.com/us-news/article/2024/may/09/vermont-charge-oil-industry-climate-crisis
Or two:
https://www.detroitnews.com/story/news/local/michigan/2024/05/09/fossil-fuel-climate-change-big-oil-and-gas-industry-dana-nessel-michigan-lawsuit-private-law-firms/73624884007/
Good on Elon for staring down those stinking Canberra Comissars-
‘Free speech’: Musk’s win over stabbing clip (msn.com)
and you can keep on milking those EV virtue signallers although you might be running out of them by the looks-
Polestar 2 latest EV to have price slashed in Australia (msn.com)
Story tip! The green transition will only cost $9 trillion per year.
– – – – – – – – –
‘We don’t have the money’: Green transition price tag balloons to $9-trillion — a year
The bill for meeting climate goals will be immense. Governments worldwide are trying to figure out how to foot it
https://financialpost.com/financial-times/green-transition-price-tag-balloons-9-trillion-annually