By Andy May
Lazard’s levelized cost of energy (LCOE) is cited on the internet all the time as the source for “solar and wind are cheaper than fossil fuels.” They don’t really mean “energy,” they mean “electricity.” The world consumed only 18% of its energy in 2021 as electricity, so LCOE is just the cost of 18% of our total consumption, a fact often lost in these discussions.
However, just a quick look at their data shows that solar and wind are clearly not cheaper. Even within their April 2023 report they are not consistent in their numbers. To make matters worse, they bury critical details in the fine print and do not define their terms. I doubt some of their numbers, but for this discussion I only use the numbers in their report.
Figure 1 is based upon Lazard’s chart on page 8. This is the chart where they try and include the costs of backing up the intermittent nature of solar and wind power generation. The chart is complicated and poorly explained, so I’ve added some clarifying annotations. Solar does not work at night or on cloudy days and wind obviously doesn’t work if there is no wind, some sort of backup (“firming”) is needed for when the Sun isn’t shining, and wind isn’t blowing.

They examine four scenarios, labeled “MISO,” “CAISO,” “SPP,” and “PJM.” They do not explain what these cases are, but I assume they are from specific electric utility companies. The graph shows the cost of Lazard’s unsubsidized LCOE in black, their subsidized cost is in light blue, and the backup or “firming” cost is in beige. They do not specify the backup duration for natural gas, but the specified outage time planned for the Lithium-Ion battery case (CAISO) is only four hours. Windless periods are usually at night and in the winter, when it is dark over 12 hours a day, so I have no idea where “4 hours” came from.
The units on the chart are $/MWh (U.S. dollars per Megawatt-hour). The units for the assumed backup cases in the fine print (see note #1) are kW-mo (kilowatt-months). This is probably to confuse the reader; I can think of no other reason. There are 730 hours in a month and 1,000 kW in a MW, so the conversion is x730 and then divide by a thousand. The figure does the conversion for you.
Notice the Lazard figure specifies a range of LCOE from $39-$101 per Megawatt-hour for Natural Gas Combined Cycle power generation. Yet, in the fine print, they specify that the “Natural Gas CT” backup assumptions for solar and wind (used in MISO, SPP, and PJM) are from $6 to $7.45 per Megawatt-hour. They do not define “Natural Gas CT,” but I interpret it as conventional natural gas power generation. Conventional natural gas plants are cheaper than combined cycle, but less efficient.
How is it that the cost of “Natural Gas CT” is a sixth or less of the cost of natural gas LCOE, when used to back up solar and wind? Can anyone clarify this? I’m no expert, but this looks like disinformation to me. In figure 1 the Natural Gas CT cost, only when used to backup solar and wind, is shown as a red line. It is much, much cheaper than the solar and wind costs provided, whether they are subsidized or not. Since wintertime is when solar and wind fail most often, and it can be for days at a time, batteries are clearly ineffective as a backup. Besides batteries fail most often in wintertime also, as anyone who drives a car knows. If we are using this magical and mysterious “Natural Gas CT” power plant at $6/MWh to back up much more expensive solar and wind, why bother with the solar and wind?
For a more in-depth look at the relative costs of solar, wind, coal, natural gas and nuclear see here.
As electricity consumers are also, by and large, also the taxpayers funding subsidies, not including subsidies in the cost of wind and solar is deliberately deceptive.
Other than the expenses, my checking account is in great shape.
Even if the subsidies came from import taxes, it’s still deceptive to not have them included. Part of the reason for doing so is to hide the full cost of wind and solar, but another reason is that this shows costs per MWhr. A big part of the ‘renewables’ push is that fossils get huge subsidies. If they show the amount of subsidy per unit power produced, it would reveal that wind and solar get far more than fossils.
Never mind that the subsidies to fossil are mainly normal tax deductions (ie keeping their own money) that all businesses have and the subsidies to wind and solar are disbursements- money taken from taxpayers.
Fossil fuel ie coal does not have any subsidy. It is taxed several times (at least in Australia) -1/ mining royalties which in Queensland at present is the world’s highest 2/ company income tax 3/ tax or government take on transport 4/ for export government take in port charges
There is a question if oil is a fossil fuel at least some of it is abiotic. In Australia there is a special high royalty on extracted oil. For sales of oil and oil products there is GST and for petrol and diesel there is an excise (around 1/4 of the selling price). There is no excise tax on diesel used on a farm or in stationary appliance which do not use roads. An exemption from a tax is not a subsidy as claimed by Greens
Natural gas which is extracted from oil & gas wells is not a fossil fuel. It has been proved that sources come from below the deepest fossils ever recorded. It has been shown that methane withdrawn from the lower coal seams has been absorbed from emissions lower than any seam below. Coal miners know that methane (fire damp) occurs in deep seams and black damp (CO2) occurs in seams closer to the surface. Anyway, in Australia natural gas particularly in wells has an high royalty. LPG which was popular for motor cars originally had no excise but now is taxed for excise so the usage has reduces. Ethanol (made from sugar cane) added to petrol for cars has no excise tax (to make it competitive) but subject to GST & company tax
Fossil fuels are taxed at multiple points in the U.S. as well. Just to clarify terms: The classic definition of subsidy in the U.S. was money sent from the government to an individual or group. Democrats in the United States now refer to those as ‘disbursements’.
Tax breaks are rules that are used to reduce the amount of tax owed. For instance, all companies are allowed to declare the depreciation in value of key equipment as a loss. Democrats now include those deductions under the umbrella of subsidies along with disbursements. If two companies have the exact same tax rules but one is 10 times larger than the other, the larger company has ten times the deductions. It will also pay ten times as much in total taxes. But Democrats will say the large company is getting more in subsidies while avoiding any context.
Nice to see someone else who recognizes the most logical Genisus for MOST natural gas is from deep in the earth. But don’t you agree that a few trillion cubic feet originate in “fossil containing formations”?
Subsidies must be included- after all- the biggest complaint against woody biomass for energy (which as a forester I like) is that it’s subsidized. Well, if that complaint holds, then all subsdidies ought to be counted. Of course subsides are everywhere in our economy- sometimes in the open and visible and other times deeply buried. Somebody should write a tome on the subject. It might be enlightening.
Figures don’t lie but liars figure.
There are lies, damned lies, statistics, and worst of all LCOE!
And then there’s New York
Leftists lie about EVERY subject, so why should the cost of electricity be an exception?
Lazard Corp, makes their money as investment bankers, and a few bucks here and there for this and that. We shouldn’t fault them for their heavy thumb on the LCOE scale for investment opportunities where the product is mandated and that can sustain earnings at negative prices because of tax credits and curtailment payments, plus much more. That’s good marketing. The problem is the “less than wise” critical thinking challenged voters who can’t see through the facade and the corrupt politicians who use the Lazard LCOE tables to justify their support for environmentally and economy destroying wind and solar.
Lazard’s numbers do not add up. But they are not the only ones.
Back in 2015 EIA issued a press release claiming that the LCOE of on shore wind was about equal to CCGT. They made a number of blatantly wrong assumptions I deconstructed in guest post ‘True cost of wind’ over at Judith’s. Correctly done, the LCOE of CCGT was about $58/MWh, while onshore wind was $146/MWh. About 2.5x.That does not include the additional cost of wind subsidies.
Some of that might be from pricing Solar + Back-up and Wind + Back-up with the “Back-up” priced separately. It isn’t Solar Wind and Battery…it’s Solar PLUS Back-up and Wind PLUS Back-up. And still requiring FF firming for reliability.
We used the ERCOT grid at its then 10% wind penetration for both the intermittent backup and the additional transmission line costs. EIA had nothing for backup and half the actual addition transmission line costs. But their greatest sin was using 30 year life for both, when wind is at best 20 while CCGT is warrantied for 40. That is in your face dishonesty from an official US government agency.
They almost certainly didn’t count extra land costs either.
In 2015 CREZ wasn’t congested. Why were you adding transmission line costs in ERCOT?
Because they added several thousand miles to move the electricity from north Texas where the wind sites were to DFW and Houston where the demand was. Nothing to do with congestion.
Yes. That is a whole other ballgame. The fact is that urban communities who want the power don’t want the turbines anywhere near their cities, so they are all remote. And therefore need long lines capable of transferring the peak power that the windfarms can produce. And like everything else connected with wind or solar capital expense, you pay for technology capable of handling the peak power, but the benefit drives solely from the average power generated, which is, in the case of solar, about 10-15%, and in the case of wind, 20-30%, of the peak. So all other things being equal, a grid with remote renewables on it need longer links capable of carrying far higher power than a grid that simply balances a series of conventional power stations running near full capacity all the time located close to the demand centres.
Key point. Renewable grids are longer, of higher capacity, by between three and ten times, and are underutilised, in comparison with conventional power station links.
I recently researched TNUoS transmission charges in the UK. Back in 2008/9 they were just £1.35bn, in essentially the pre-renewables grid. For 2023/4 they are £4.1bn, three times higher – yet supply has fallen from a peak 400TWh to around 270TWh.
A wind Turbine will not work on an Island all by it’s self. power is needed to start it up. [Other than the small “toy” wind Turbines.] Also ignored is the fact that a Wind Turbine requires a connection to the “GRID” 24/7/365 to obtain the power needed to operate. This power, about 15% of nameplate max generating potential is NOT subtracted from the “Gross Power” delivered to the Grid the above figure quotes Gross power, NOT NET Power. As a result to get that “Supplied” power means that you actually need one additional Wind Turbine for each five WTs erected in the Wind Farm.
For more information on Wind Turbine Consumption read -> http://www.aweo.org/windconsumption.html
Exactly right. You cannot blackstart a system with only wind. You cannot blackstart a nuclear power plant either. You have to have coal, gas or hydraulic.
Very interesting. So, we’ll need a wind turbine’s energy to start another wind turbine which will send its energy to another wind turbine to start it up. The last one in the chain will send energy back to the first to start it up. Finally, a perpetual motion machine!
The link included this line:
“Could it be that at times each turbine consumes more than 50% of its rated capacity in its own operation?!”
In my opinion 50% is BS
If blades are icing, they have to be stopped to prevent damage and deicing will take a large amount of energy for a short period of time during some winter days.
Wind turbines can still keep spinning for hours after winds stop or die down.
WORST CASE:
In Canada, where wind turbines can experience icing up to 20% of the time in winter months, special “cold weather packages” are installed to provide heating to turbine components such as the gearbox, yaw and pitch motors and battery, according to the Canadian government. This can allow them to operate in temperatures down to minus 22 degrees Fahrenheit (minus 30 Celsius).
Around a quarter of the world’s wind turbine capacity is installed in cold climate sites
Available wind power in cold climates is approximately 10% higher than other areas due to the increased air density at lower temperatures,
Adding a thin layer of carbon fiber to the blades of the turbines that can be automatically heated can prevent ice before it forms. Anti-icing protection is primarily employed by aircraft companies, whose planes and devices must survive cold altitudes. This technology is expensive and can have a negative effect on turbine efficiency. It is also not suited for warmer climates.
Add deicing expense to the LOOOOONG list of negatives for adding windmills to electroc grids, which should never be done, in my opinion. Unless you want to sabotage grid reliability.
Interesting that windmills, solar panels and EV batteries all have problems with cold weather.
Turbine blades can freeze
Solar panels can get covered with snow
EV battery powered automobiles can lose 40% to 60% of their range at 0 degrees F. (Source: Ford Motor EV engineers in cold weather EV testing, in Northern Minnesota, in December 2022)
So it is no surprise that leftists, who know nothing about everything, like windmills, solar panels and electric vehicles … and believe the LCOE fake numbers too!
‘Wind turbines can still keep spinning for hours after winds stop or die down.’
What?? Are they pulling energy from the grid to do this?
Yes of course, I’ve observed this numerous times, but why? Could it be that production tax credits are awarded on the basis of: “production” without differentiating between from the wind or from the grid? Most likely. Not unlike the German’s who beamed high intensity lighting on their solar panels at night to collect the price advantage (until they got caught).
If wind is so cheap, why is NY not building more without the $100MW subsidy increase???
Anyone who likes this post should watch this classic <i>Decouple</i> episode with the great Mark Nelson. I particularly like the title screen with the picture of Gorn and the caption: The Lazard People are Taking Over.
https://youtu.be/p9PARx79i6s
The interview with Mark Nelson was very informative and educational. Lots of fudging can occur in LCOE.
Andy; some names… SPP = Southwest Power Pool, CAISO = California Independent System Operator, MISO = Mid-Continent Independent System Operator, and PJM = PJM Interconnect. All of these are regional power grids
Thanks! I figured they were utilities, but I didn’t know the names. It is a pretty shoddy report.
All the better to confuse people – God forbid that anyone would dare to check their work!
Mid-Continent Independent System Operator
California Independent System Operator
Southwest Power Pool
Pennsylvania Jersey Maryland Interconnection
Probably spitting into the wind given how comments have been taken previously, but here I go anyway…
When bidding solar the contractor isn’t bidding to provide a maximum output for the full day. The idea for firming solar isn’t that you can now meet the grid profile, rather it is so that your solar generation can act about like you would expect. That is, you have a source for provide generation during unexpected cloudy events, or unexpected lulls in wind. The firming power provides that coverage.
How can the cost of backup be one sixth the cost of NGCC (which should be lower than NGCT)? Easy, the cost of the backup is distributed over the GWh generated. That is, you take the total capital cost and total fuel cost and spread it over the total generation provided by renewable+backup. Imagine you have a solar plant that you bid 1GW for 4 hours per day for 365 days per year (so ignoring cloudy days, rain, difference between spring and winter, etc.) so 1.5 TWh/year. Turns out your panels only produced 1.2TWh that year. You needed 1GW of natural gas fired generation, and it ran a total of 300 hours. You take the capital cost of the NGCT plus 300 hours of fuel, and you divide that cost by 1.5TWh. What this gives you is the cost of backing up the 1.5TWh that you bid for the year. If you wanted to know the cost of the gas produced power you would divide by the 300GWh instead (so 5 times more expensive). However, that was not the intent. The intent is “for each unit of power that comes from this facility how many dollars went into providing the backup?”
We can of course argue about whether that is the right metric or whether it covers everything you need. However, that is what the calculation is doing.
I suspect you are correct. They are only charging the natural gas plant active time to the solar+wind. This is stupid, who pays for the idle time when the natural gas plant is not feeding power to the grid? This is the critical flaw in the calculation.
No, it’s not a critical error. You take the capital cost for this year and add the operational cost for this year and put that into the calculation. I think they are overestimating the cost personally. With the exception of ERCOT there aren’t really any growing grids in the US. That means the current installed capacity can operate as the firming capacity and your cost is not the capital cost of new equipment, but the maintenance cost of already depreciated equipment.
My deeper interest in this is that the numbers should have gone haywire over the last year with interest rates so high. The cost of gas should have dropped dramatically against all the high capital cost sources (nuclear, wind, solar). I don’t see that in a cursory glance at the chart you posted.
Natural gas was already cheap, how low can you go? Your business models rely on “fully depreciated natural gas backup” If it wasn’t for subsidized wind and solar capturing market share those assets would be generating income. The owners need a compensatory payment for those turbines sitting idle. Eventually those seldom used turbines will require replacement. Only the RE generator benefits and in a sane world would be required to provide replacement. What does that do for your business model?
chadb,
Very interesting comments, thanks for both. I understand that the calculation of the backup is spread over all the electricity generated in the year and probably is for a fully depreciated gas plant. It makes sense and that is why the calculated backup cost is so low, relative to the actual natural gas cost.
My problem is that the utilities are chasing wind and solar subsidies and with the take or pay mandates. The natural gas plants are not subsidized, the incentive is to minimize them. The revenue and demand goes to solar and wind first, natural gas last. Weather is variable, you will reach a point where there is not enough natural gas, and the fault lies with the subsidies (see Texas Feb., 2021).
I suspect without the subsidies, utilities would build a lot less wind and solar and a lot more natural gas, which is safer and more stable.
I understand the calculation, I just don’t think it accurately reflects reality. Nor is it a good basis for policy decisions.
There is / was / ongoing some sort of ‘Inquiry’ going on here in the UK about The Covid Trainwreck that was = UK’s response to the thing
A sweet little nugget came out of it where BoJo admitted to some form of ‘graph dyslexia’
It was, as Prime Minister, he was presented with an epic stream of graphs to look at and there upon base his decisions and course of action.
He admitted that he ‘couldn’t read them’ – that he couldn’t glean any useful information from them and frankly, they ‘hurt his brane’
On heating that I initially had Zero Sympathy.
Along the lines, ‘Sorry Bojo, you are sugar addicted and alcoholic buffoon that’s permanently asleep, drunk or hungover. It’s no wonder you couldn’t read these things‘
Having seen the image we’re presented here, suddenly I have completely changed my mind.
It is graphical garbage – only courtiers/couturiers of The Emperor can see anything in that.
It the further dawned, harking to the TV series Yes Minister, that that is exactly what was happening.
i.e. The Blob, a loosely woven but epic in number gang of ‘left leaning brexit remoaners’ within the Whitehall machine were creating these graphs to get revenge on Boris for trying to push through Brexit – they were trying to take the piss out of him, get him to make a fatal blunder and thus have him removed from office.
(Why they needed to is a mystery, it’s obvious the booze alone would do that = as it actually did)
Is that what’s going on here in the graphic we see, it is everything to all people and as such, says completely Nothing At All
two points immediately:
1/ Why are batteries even mentioned, batteries are NOT a source of generation
2/ Surely Shirley, the cost of providing firming will depend on exactly when, during the daily cycles of evening/morning peaks and weather variations, on WHEN it is needed.
By definition, firming will be needed when ruinables fail to supply, but, you can only put a price on that if you know when they are going to fail
Which you don’t and never will
The thing is complete guesswork and unreadable garbage.
So, back to Lazard & Co – where exactly do they fit in relative to the (UK) Blob and the (US) Deep State
Who butters Lazard’s bread, how generously and on which side?
For the batteries the idea is that you will bid into the day ahead market knowing both your expected sunshine and your battery state of charge. When the state of charge is low you use some of your generation to charge your battery.
The “firming” isn’t to firm the entire day, but to ensure that you can provide what you bid into the market. That is, “no surprises.” There may be surprises two weeks from now, but on the day-ahead bid you are able to make what you bid for.
Then the cost of firming has nothing to do with the time of day. You may have an opportunity cost that differs, but the true cost is just the cost of the battery.
Holy shit, the more you think about that (Boris vs the blob remoaners), the worse it gets.
Those ugly faceless people have immense amounts of blood on their hands for doing that haven’t they?
Just because they lost a petty little referendum on Europe they effectively consigned ‘how many’ people to death and lifelong illness/injury.
Safe and Effective my arse
And the folks creating the garbage graph/thing we see in this story are going to have even more on their hands ain’t they – for promoting/pushing the Total Junk Science that is = the GHGE
And just look at NASA, for the utter horror that was is their Global Greening story,
Add to which the OCO Sputniks that NEVER had a hope in hell of doing what they were supposed to do yet were still launched and are creating ‘data’ – said ‘data’ now being wildly re-imagined tp point The Finger at China
Yes, things really are ‘worse than anyone thought’
To make matters far worse, if that is even possible, the U.S. Supreme Court, in its infinite lack of wisdom, has deferred to the bureaucracy all matters related to science in their appalling Chevron deference decision. Essentially turning the U.S. over to the EPA and other agencies.
Chevron is likely to be reversed or severely narrowed in this SCOTUS session. Two cases were consolidated and the oral argument pushed to early 2024 so that new Justice Jackson can participate. She had to recuse from the first of the two that was previously scheduled to be argued already.
I sure hope so Rud, Chevron Deference is the worst Supreme Court decision for our country since Dred Scott, at least in my non-legal opinion. You know much more than I do.
I am almost certain your wish will be granted. The case is very simple and stark. The National Fisheries Service required fishing companies to have a government catch inspector on each fishing boat, paid for by the boat. Lower courts gave that Chevron deference when fishing boat owners sued, where the NFS demand is a clear violation of the last clause of the 5th Amendment.
“The National Fisheries Service required fishing companies to have a government catch inspector on each fishing boat, paid for by the boat.”
Never heard of that- it’s outrageous- totalitarian. And at a high pay scale, no doubt.
So much for the suppossed ultra right wing (Trump appointed) Supreme Court.
Lazard and Bloomberg are financial services outfits catering to big time clients
Both either lie through their teeth, to do not know what they are talking about.
The US-EIA is engaging in a gross deception regarding the costs of wind, solar, batteries, EVs, etc., which is fed to politicians and the public and the Media.
The purpose is to brainwash the people to pay more for electricity/kWh than would be the case if only fossil, nuclear and hydro were used.
The public is told wind and solar are competitive with fossil, which is total BS.
Levelized Cost of Energy by US-EIA
The wind/solar/battery bubble is in meltdown mode. This is not a surprise, because the US-EIA makes LCOE “evaluations” of W/S/B systems that purposely exclude major LCOE items.
The EIA deceptions reinforced the delusion W/S are competitive with fossil fuels, which is far from reality.
The excluded LOCE items are shifted to taxpayers, ratepayers, and added to government debts.
W/S would not exist without at least 50% subsidies
W/S output could not be physically fed into the grid, without the last four freebies.
1) Subsidies equivalent to about 50% of project owning and operations cost,
2) Grid extension/reinforcement to connect remote W/S to load centers
3) A fleet of quick-reacting power plants to counteract the W/S up/down output, on a less-than-minute-by-minute basis, 24/7/365,
4) A fleet of power plants to provide electricity during low-W/S periods, and during high-W/S periods, when rotors are feathered and locked,
5) Output curtailments to prevent overloading the grid, i.e., paying owners for not producing what they could have produced
https://www.windtaskforce.org/profiles/blogs/biden-30-000-mw-of-offshore-wind-systems-by-2030-a-total-fantasy
Regarding batteries, Bloomberg often spouts $100/kWh delivered as AC in the near future.
That is total BS
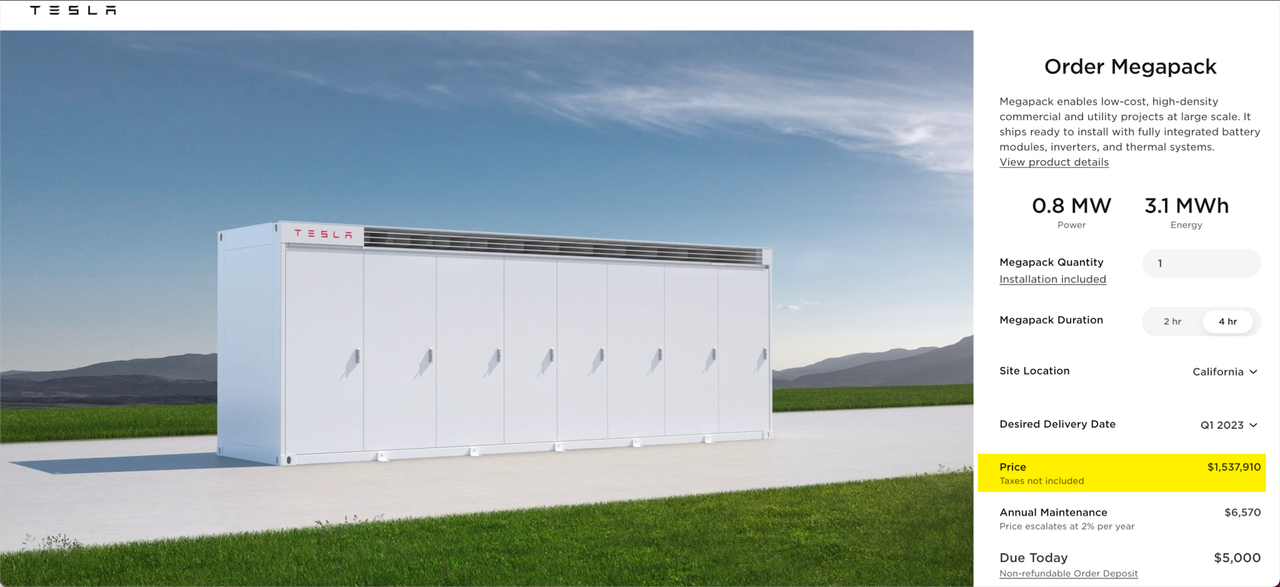
Utlity-grade, site-specific, large-scale, battery systems are at least $575/kWh delivered as AC, 2023 pricing, if Tesla Megapacks are used. Just google the Tesla Megapack website
EXCERPT from
https://www.windtaskforce.org/profiles/blogs/battery-system-capital-costs-losses-and-aging
Example of Turnkey Cost of Large-Scale, Megapack Battery System, 2023 pricing
 ?itok=lxTa2SlF” target=”_blank” rel=”noopener nofollow ugc”
 ?itok=lxTa2SlF
The system consists of 50 Megapack 2, rated 45.3 MW/181.9 MWh, 4-h energy delivery
Power = 50 Megapacks x 0.979 MW x 0.926, Tesla design factor = 45.3 MW
Energy = 50 Megapacks x 3.916 MWh x 0.929, Tesla design factor = 181.9 MWh
Estimate of supply by Tesla, $90 million, or $495/kWh. See URL
Estimate of supply by Others, $14.5 million, or $80/kWh
All-in, turnkey cost about $575/kWh; 2023 pricing
https://www.tesla.com/megapack/design
<a href=�
https://www.zerohedge.com/commodities/tesla-hikes-megapack-prices-commodity-inflation-soars
Annual Cost of Megapack Battery Systems; 2023 pricing
Assume a system rated 45.3 MW/181.9 MWh, and an all-in turnkey cost of $104.5 million, per Example 2
Amortize bank loan for 50% of $104.5 million at 6.5%/y for 15 years, $5.462 million/y
Pay Owner return of 50% of $104.5 million at 10%/y for 15 years, $6.738 million/y (10% due to high inflation)
Lifetime (Bank + Owner) payments 15 x (5.462 + 6.738) = $183 million
Assume battery daily usage for 15 years at 10%, and losses at 19%
Battery output = 15 y x 365 d/y x 181.9 MWh x 0.1, usage x 1000 kWh/MWh = 99,590,250 kWh delivered to HV grid
(Bank + Owner) payments, $183 million / 99,590,250 kWh = 183.8 c/kWh
Less 50% subsidies (ITC, depreciation in 5 years, deduction of interest on borrowed funds) is 91.9c/kWh
At 10% usage, publicized cost, 91.9 c/kWh
At 40% usage, publicized cost, 23.0 c/kWh
Excluded costs/kWh: 1) O&M; 2) system aging, 3) system losses from HV grid to HV grid, 3) grid extension/reinforcement to connect the battery systems, 5) downtime of parts of the system, 6) decommissioning in year 15, i.e., disassembly, reprocessing and storing at hazardous waste sites.
NOTE: The 40% usage is close to Tesla’s recommendation of 60% usage, i.e., not charging above 80% and not discharging below 20%. Tesla’s recommendation was not heeded be owners of the Hornsdale Power Reserve. They added Megapacks to offset rapid aging of the original system and added more Megapacks to increase the rating of the expanded system.
http://www.windtaskforce.org/profiles/blogs/the-hornsdale-power-reserve-largest-battery-system-in-australia
Wow! I did not know all that. I will keep your comment for future reference, thanks.
Here’s the actual performance of the Hornsdale Power Reserve since start up
Batteries are a really dumb way for backing up wind/solar. If you are committed to net zero for whatever reason your best option is:
Build solar until you are reaching grid saturation in August (this overbuilds June and typically underbuilds December)
Build wind (if you have good resources)
Run gas for everything else
Do direct air capture to remove any generated CO2.
Not arguing that anyone should do that, merely that it is the cheapest way to reach the goal. It also has the added benefit that as people realize the goal is less than helpful you can stop the most expensive part of the project (the capture portion). Alternatively when it is all finished and you are in the financial state that Argentina is right now you can cut the subsidies to the air capture, save money, bankrupt the leeches who only survive as subsidy farmers, and remove the efficiency drag. I guess you could do the same with batteries, but you also have a mountain of hazardous waste to deal with too.
Your entire argument here simply adds up to “net zero is idiotic beyond belief for electricity consumers.” The notion of direct air capture is simply nonsense designed to make money for carpet-baggers.
Build more wind? Why? 2×0 is still zero.
Build solar? Why? There’s no generation at night or on overcast days.
YES! Net Zero is idiotic beyond belief, I 100% agree with that statement. However, if I am a power generator that is legally required to develop a path toward net zero, or I am forced by my shareholders to develop such a path I should develop a path that
1) Involves the least pain along the way
2) Is the easiest to reverse if people come to their senses
As a business I have a fiducial obligation to my shareholders to maximize their value. If there are a ton of subsidies available if I install solar panels then I am legally obliged to install the solar panels. Thing is, I may not even want them. I might think the entire process is a headache and makes the grid less stable and requires other investments to offset that added complexity, doesn’t matter. I am obliged to install the solar panels, offset the complexity and hand the subsidies over to my investors.
Let’s I’m 68 and have a heart attack. I can either sell my house to pay the doctor’s bill or use Medicare. I have an obligation to take care of my wife, so even if I think Medicare is a terrible program and should be ended I have an obligation to my wife to take the Medicare money and keep the house. That doesn’t mean I like it as a program, it just means that from where I am sitting my best choice is that Medicare pay the bill. Similarly for many of these companies their best choice is the subsidies, regardless of what they think is best for the country.
That would be a very expensive, area intensive way to run an electrical system, with high owning and operations cost
operating and maintenance, O&M, is a subset of project operations, which includes all expenses, such as taxes, insurance, site lighting, fire protection, surveillance, etc.
Batteries are incapable of backing up wind and solar. That is not their actual function.
They are there to replace the rotational inertia of the spinning conventional turbines that are now shut down in order than a sudden loss of power to the grid will not result in such a large frequency drop that all the other renewable generators drop off as a precaution.
They have no function to reduce intermittency whatsoever.
Rotational inertia provides stability, already for more than 100 years.
Wind and solar provide instability, already for 30 years
That instability has to be counteracted by the OTHER traditional power plants to maintain stability.
If the capacity of the traditional plants is insufficient, when wind and solar are larger percentages of the electricity fed to the grid, all hell breaks loose.
The URLs are very useful for additional info
JP Morgan’s 2022 Energy Report cast doubt on LCOE.
You can read it here: https://www.climatecatastrophefund.com/
From the executive summary:
‘First, “levelized costs” comparing wind and solar power to fossil fuels are misleading barometers of the pace of change.
Levelized cost estimates rarely include actual costs that high renewable grid penetration requires: (a) investment in transmission to create larger renewable coverage areas, (b) backup thermal power required for times when renewable generation is low, and (c) capital costs and maintenance of utility-scale battery storage. I am amazed at how much time is spent on this frankly questionable levelized cost statistic. ‘
Lazards are climate botherers decked out as financial advisers. How many of their employees have been responsible for running a power station?
China and India are constantly demonstrating the lowest cost source of electricity generation – COAL.
Where is the transmission line item in their LCOE table:
https://www.cnbc.com/2023/10/17/world-must-add-or-replace-50-million-miles-of-transmission-lines-iea.html
My electricity connection fee has doubled in the past decade to pay for all the new power lines to transports electrical energy from far flung horizons to me front yard. Just more encouragement to go off-grid.
This report from Larard supports my contention that they are climate botherers:
https://www.lazard.com/media/ih1lus0h/lazard-2022-corporate-sustainability-report-062623_final.pdf
Any financial adviser that is not open to coal projects is not serving their clients.
The whole “renewable” charge depends on China burning humungous amounts of coal to make all that “renewable” stuff that will ultimately prove unsustainable. The fantasy is built on consumer theft and you have to think there are enough voting consumers smart enough to turn the tides and end the fantasy.
I don’t know why so much navel gazing / bellybutton fluff picking is necessary to determine whether wind & solar generated electricity costs more than coal & gas generated electricity.
Just look at consumers’ power bills for those served by gas & coal vs those infected with solar & wind.
What makes Green Energy economics and Climate Change Science feasible is making up numbers when reality impinges on the narrative.
MISO is Midcontinent Independent System Operator (also a thick paste produced by fermenting soybeans with salt and kōji)
CAISO is California Independent System Operator
SPP is Southwest Power Pool
PJM Interconnection is a regional transmission organization (RTO) that coordinates the movement of wholesale electricity in all or parts of Delaware, Illinois, Indiana, Kentucky, Maryland, Michigan, New Jersey, North Carolina, Ohio, Pennsylvania, Tennessee, Virginia, West Virginia and the District of Columbia.
My guess is that when Nat Gas is being used to back up wind and solar, they are only counting the incremental costs of running a Nat Gas plant. When it’s being run as a primary source of power, they include all costs.
True, that is how they get the number. They spread the natural gas generating cost over all the electricity produced regardless of source, it is an “incremental” cost to the total grid cost (whether it is cost of capacity or delivery, I don’t know). I suspect it does not include all the costs associated with keeping an idling, and nonproductive natural gas plant going all year. Also, I do not think there is any incentive to make sure you have enough natural gas supply for a disaster like Texas in 2021.
It is government intervention at its worst. Paying incentives to intermittent sources that must be backed up with non-incentivized natural gas. Utilities chase the subsidies and screw the public.
Does a “levelization” have even more arbitrary assumptions then a “homogenization”?
A little wind and solar is fairly cheap and reliable. Unfortunately a lot of wind and solar is very expensive and very unreliable because of the need for reliable backup running hot, battery storage, ancillary services to provide grid inertia and the list just grows. Wind and solar suffer from negative economies of scale.
Definitely the fact that electricity is but a fraction of total energy consumption is often lost in discussions. However, it isn’t readily apparent where the 18% figure is found in the link from Exxon. That figure seems low.
“The world consumed only 18% of its energy in 2021 as electricity, so LCOE is just the cost of 18% of our total consumption, a fact often lost in these discussions.”
The calculation uses the values in the Exxon 2023 data for 2021.
Under “End-use sectors – World” find the total energy consumed (453 quads) and divide into total electricity delivered (83 quads) = 18.3%. You must add the residential and commercial, transportation, and industrial sectors.
I did notice that total primary energy is 577 quads and the total of the end-use sectors (453) do not match, not sure why. There is something in primary, that does not go into consumption, perhaps waste heat.
I don’t see any reference to “life of project” and how it affects costs. In the past, there have been attempts to liken the life of solar and wind facilities as being similar to a coal power plant, which favors renewables in a big way. How is it equalized in this economic comparison?
Good point. The Lazard study uses a 20-year lifetime for gas, 40 for nuclear, 40 for coal, 20 for gas combined cycle (page 14).
Gas plants, nuclear and coal plants can (and have) lasted 60 years.
They use 20 for wind and 25-35 for solar. These are very generous and unlikely.
The term back up is wrong as it is generally used, “to make up for when the sun doesn’t shine and the wind doesn’t blow”. Wind is very variable as it’s Achilles heel is that output is proportional to the cube of wind speed, small variations of wind speed produce large variations in output, it is not all or nothing.
Wind and solar cannot modulate power which is required to balance the demand on the grid and the supply into it. I.e. on an instantaneous basis what goes out must be matched by what goes in.
In the U.K. this is provided by Closed cycle gas power plants (They use exhaust waste heat from the gas turbines to make steam and run steam turbines as well), these run all the time sometimes at very low levels but often at very high levels. Not only balancing but like all conventional generators provide inertia, reactive power control and short circuit current level support.
Wind and solar are incapable of providing these essential criteria, they are third rate generators and as such their value is very low.
The quality of the energy produced is a very important consideration. If it were not for take-or-pay mandates for wind and solar they would be useless.
“If we are using this magical and mysterious “Natural Gas CT” power plant at $6/MWh to back up much more expensive solar and wind, why bother with the solar and wind?”
They’ll say- “to save the planet” and of course to enrich the solar-wind industrial complex and all the politicians singing the climate emergency opera.
If governments got out of the energy business- promoting, subsidizing, regulating- whatever- and let private enterprise and we individuals decide for ourselves what is the lowest cost energy- we’d get closer to the truth. It never used to be difficult to decide for ourselves if a Chevy was cheaper or more expensive than a Ford. Without complex formuals, charts, spreadsheets.
Yes.
It isn’t an easy calculation, and I did it once, in the context of UK grid. Fundamentally you have to make some rather dubious assumptions about for example how much of the O & M (operation and maintenance) costs of running and indeed amortised costs of building, a gas power station need to be plonked into the ‘cost of wind’ and how many hours of its use are in fact dedicated to wind backup rather than just being a base load generator. In addition there is an even more data poor consideration of how much its more intermittent usage as backup increases both wear and tear, and, in fact, gas usage per unit generated – like driving through traffic, start/stop operation guzzles that gas.
I spent several days of head scratching and end up with, I think about £62/MWh with the (then) gas prices.
Umm. I wrote it all down here: There is a whole section devoted to this problem. Pages 23 onward. Every assumption is explained and I leave it to the community here to peer review it. It was at least a couple of days of hard work deriving the formulae.
Note that that was with the then gas prices. Today its a lot worse.
I think this is a very very important issue, which is why I tried to apply the best engineering and cost accounting to it. The problem is that its a complex issue, with many challengeable assumptions having to be made to model it. Like climate change, because it is so complex, it’s very, very easy to hand wave the arguments away and simply rely on the old ArtStudent™ trick of appealing to an authority that you have paid to give you the answers you want suitably described in increasingly complex bullshit, so that intelligent people are too proud to admit they can’t follow it, and therefore simply resort to applauding and taking the conclusions as read.
The problem is that whilst engineering and cost accounting are my areas of expertise, that is an extraordinarily rare twin skill set, and its almost completely absent from politicians, even the honest ones who care. It is something you need to hand over to world class consultancy firms. Who can operate interdisciplinary teams. And its a costly exercise. Far more costly than the sort of exercise in carefully crafted bullshit that is normally the case
Very good report! I’m about halfway through it. I will finish it.
Having read the comments, and trying in my own mind to arrange my own putative response to them, I feel it worthwhile to actually state how I, as an engineer, would go about costing wind power and renewables. It certainly would not be based solely on the cost of wind turbines and solar panels and the electricity generated from them. Levelised or otherwise.
In terms of national impact of – say – a UK wide renewable energy grid, the only way – short of actually building the thing and looking in horror at everyone’s electricity bill, which is, to date, the only method being employed, it seems – is to build a conceptual grid in something like a spreadsheet. The same way any other massive engineering project is costed. And then build another one based, say on nuclear and conventional power, and compare the cost of electricity one to the other.
If the right questions are asked and the same cost of capital applied to both, there are now sufficient historical data on the variability of wind and solar power to enable accurate data on capacity factors and turbine lifetimes and operational costs and so on.
In the end one is not actually interested in ‘the cost of renewable energy’ but the overall cost to the nation of one type of grid compared to another.
And that must needs include the environmental impact of renewable energy, the social impact of massively long underutilised transmission lines and the collapse in house prices adjacent to windfarms and electricity pylons, as well as the cost of whatever backup strategies are employed, and the cost to industry of being required to load shed at peak times in winter etc etc.
The horrific uncertainty associated with renewables is another factor: At least with nuclear – which is the obvious and only other non-fossil alternative – you know exactly where you stand technically. You have very predictable availability, and build costs are limited to the power stations themselves, and not to all the ancillary bolt-on extras like battery banks – that are necessitated by the nature of renewable generators.
This is the sane way to honestly answer the political question, from the perspective of the nation as a whole, as opposed to green crony capitalists.
No political party in the UK has proposed such a study.
“This is the sane way to honestly answer the political question”
Which is probably why no political party in the UK has proposed such a study.
Lol. You got me there…
L iars
C ost
O f
E lectricity