Guest Post by Willis Eschenbach.
With all the recent interest in rare or extreme weather events, I got to wondering … what makes a weather event rare or extreme?
With that in mind, here’s a thought experiment whose relevance will be made clear shortly.
Imagine some woman works in the Tennessee Valley plant of a big corporation. It’s a 24/7/365 operation. The Regional Manager likes to visit each plant, spend a day or more there, and stir things up. So the woman decides to record the comings and goings of the Regional Manager. At the end of the year, she graphs it up and it looks like this:

Figure 1. Dates of visits of the Manager to the plant.
When she runs the numbers, she finds out that the Regional Manager’s been visiting the Tennessee Valley plant about one day in five.
So here are two questions.
In Figure 1, is a visit by the Regional Manager a “rare event”?
In Figure 1, are these visits “extreme events”?
Obviously, no. Something that happens about one time out of five is neither rare nor extreme.
Why is this a relevant thought experiment? Well, like I said, I was wondering what makes an event “rare” or “extreme”. So I went to “THE SCIENCE”, which in this case are the Glossaries of the two latest IPCC Assessment Reports. Here are the definitions from the Fifth (AR5) and Sixth (AR6) Assessment Reports.
Extreme weather event
An extreme weather event is an event that is rare at a particular place and time of year. Definitions of rare vary, but an extreme weather event would normally be as rare as or rarer than the 10th or 90th percentile of a probability density function estimated from observations.
and
Extreme weather event
An event that is rare at a particular place and time of year. Definitions of ‘rare’ vary, but an extreme weather event would normally be as rare as or rarer than the 10th or 90th percentile of a probability density function estimated from observations. By definition, the characteristics of what is called extreme weather may vary from place to place in an absolute sense.
I cracked up when I saw those definitions.
Why?
Well, because on average, one observation out of every five is “as rare or rarer than the 10th or 90th percentile of a probability density function estimated from observations”.
So the IPCC is claiming that one weather observation in five is “rare” … here’s how that plays out for a few years of daily Chicago Midway Airport temperatures. This shows the IPCC-defined “extreme Chicago temperatures”.

Figure 2. Daily average temperatures at Midway Airport, Chicago. Horizontal red lines show the 10th and 90th percentiles of the observed temperatures. Yellow area shows the one in five temperature records that exceed those percentiles. Middle white area encompasses the 80% of the data between the 10th and the 90th percentiles.
I swear, the inmates are in charge of the IPCC asylum.
CODA: This post is about extreme weather events. About a month ago, in a post called “The IPCC Says No Climate Crisis” I highlighted that the IPCC agreed with a recent study pointing out how little change there’s been in extreme weather events.
The study was entitled “A critical assessment of extreme events trends in times of global warming“, and the conclusion says:
In conclusion on the basis of observational data, the climate crisis that, according to many sources, we are experiencing today, is not evident yet.

Can’t say it any better than that. And the IPCC itself agrees. Here, shown as white squares in the first data column, are the areas of the weather where the IPCC says there is no significant change in frequency or strength.

Figure 3. IPCC AR6 Table 12.12. The column entitled “Already Emerged In Historical Period” shows climate phenomena that the IPCC says have or haven’t changed due to “global warming”.
Let’s be clear about this. The following are the areas where the IPCC itself, in the graphic above, says there is low scientific confidence in the existence of any visible “global warming” effects in the form of weather extremes:
- Air Pollution Weather (temperature inversions)
- Aridity
- Avalanche (snow)
- Average rain
- Average Wind Speed
- Coastal Flood
- Drought Affecting Crops (agricultural drought)
- Drought From Lack Of Rain (hydrological drought)
- Erosion of Coastlines
- Fire Weather (hot and windy)
- Flooding From Heavy Rain (pluvial floods)
- Frost
- Hail
- Heavy Rain
- Heavy Snowfall and Ice Storms
- Landslides
- Marine Heatwaves
- Ocean Alkalinity
- Radiation at the Earth’s Surface
- River/Lake Floods
- Sand and Dust Storms
- Sea Level
- Severe Wind Storms
- Snow, Glacier, and Ice Sheets
- Tropical Cyclones
So when folks claim things like “We’re already seeing the effects of global warming in storms/cyclones/floods/coastal erosion/fire weather/sea level/etc.”, feel free to tell them that the IPCC and reality itself both beg to disagree.
Now, you can clearly see above that the IPCC itself agrees wholeheartedly with the paper “A critical assessment of extreme events trends in times of global warming”. Both the paper and the IPCC Table 12.2 above say that to date there is very little sign of any change in almost all measures of extreme events.
Since my earlier post, however, there’s been a disturbing development. Despite the paper agreeing with the IPCC, in an act of venal scientific malfeasance, the usual alarmist “scientists” including the serial liar Dr. Michael Mann have intimidated the publisher of the paper into withdrawing the paper.
I cannot find any report of any specific statement that these underhanded “scientists” found to be false. They just claimed unspecified problems with “the selection of the data, the analysis, and the resulting conclusions” … yeah, right. There’s an excellent discussion of the issues here.
Climate cowards. They can’t defeat an argument, so they try to censor it. Here’s the most subversive part of the paper they’ve censored …

Can’t have scientists saying things like that … it’s just not done.
But the good news is, you know these climate thugs are running scared when they have to illicitly prevent the publication of ideas that might do significant damage to their to-date-endless climate money gravy train …
My very best to all,
w.
USUAL CAVEAT: When you comment, please quote the exact words you are discussing. This avoids endless misunderstandings.
Good look at the reality of climate variance, Willis. I commented to one true believer that “if rainfall averages 40 inches a year, but normally varies between 20 inches and 60 inches a year, it is not climate change at either of the extremes”, which caused the true believer to change the topic.
Nice one Ron.
We are getting close to the root cause of the problem – the belief that an average value is synonymous with stability.
And don’t forget the pervasive misuse of “normal” instead of “average,” as in today’s high is above “normal.”
Also, don’t forget that 50% of the people you see in the street have a sub normal IQ.
Doesn’t sound that sweet when they are sub-normal. I wonder how long it will be before that becomes hate speech, (but only applied to me and not to the weather, of course).
When one takes into account alcohol and drug addled brains, and survivors of motorcycle or severe head-on automobile crashes and combat injuries, it is obvious that more than 50% have IQs less than 100.
median IQ is 100
An assertion in the face of counter evidence. About par for the course.
Except at Lake Wobekon where all of the children are above average. 🙂
My retort is “any temperature that is not a record , is a normal temperature ….”
No, records are normal too. It’s not rational to assume it will never be hotter or colder than yesterday
next up you’ll argue that normal means 90 degrees.
I will note however that you guys always try to divert attention by making silly semantic arguments
In many places, that is normal.
Mr. Mosher: Thank you for this textbook example of projection.
That is because weather reporters typically report daily weather events as either “normal”, “above normal”. and “below normal”. They rarely use the correct terms of “average” or “mean”, which imply correctly that this is a statistical measure, not a measure of “normality”.
So it is no surprise that people view any variation from the mean as “abnormal”. In fact, most people do not realize that the mean value of any data set can be abnormal. For instance averaging a series of measurements that tend to vary a lot from the mean, such as daily “average” temperatures in a given location. If the typical diurnal temperature variation is 20-30 deg F, it is likely that the average of those daily highs and lows is experienced for only a few minutes per day out of 24 hours.
It is really all too easy to bamboozle most people with statistics that they do not understand. Which is what prompted Samuel Clemons to quip that “There are lies, damned lies, and statistics”.
It goes even further than you describe.
For example, it may be that some particular location in Florida average 60 inches of rain per year. But it may also be that a careful look at the actual annual rainfall will show that this location has NEVER had 60 (two sig figs, IOW between 59.5 and 60.5 inches) in any calendar year.
60 inches a year may be so rare as to be non-existent when it comes to such statistics, at least in our current relatively short span of record keeping. Maybe in a thousand years or so we might have had exactly 60.0″ a few times. But maybe not.
In another example, the average daily high temperature at some location near TIA on January 15th may be 72°. And it may also be true that there has never been a single January 15th when the actual average high temp was 72. In fact, in places like Central Florida, and also in such locations as Philadelphia (to name two places where I have lived and conducted daily weather data collection over some period of time), at that time of year the temperature is largely a function of the wind vector (velocity and direction).
If you examine the Wind Rose for that day, you may find that the wind near Tampa is most commonly from the North-Northwest or from the South-Southwest, with smaller frequency of days from other directions. This corresponds to hot windy days ahead of approaching cold fronts, and cold windy days behind cold fronts. On these days, the temperature is going to be in the mid-80s or so, or in the mid-50s or so. IOW 15 degrees hotter or colder than the average. That is what is common, or normal. It may only be near 72 for a daily average high when jet stream has retreated to the north and light easterly winds prevail.
Likewise in Philly, there are lots of days when the wind is blowing strongly from a North to Northwesterly direction, and some days when the winds are from the South or Southwest. On those days, it will be substantially below average for the date, and above average for the date, respectively. This again is related to the approach and departing of cold fronts. Such frontal passage typically occur with a frequency of over one a week.
Only a zonal flow of wind from the West is likely to bring an average daily high to locations in the mid latitudes. And in some years there may be very little of such zonal flow, sometimes none.
Average temperatures for many parts of the Earth are uncommon, although perhaps not “rare”.
And this is not a simple sematic argument or nitpicking, as S.M. would have us believe. Gaslighting does not work on the strong minded or the knowledgeable.
It does not matter what cutoff points one uses as the definition or such words as “rare” and “common”.
In such cases, the average daily high Temp is not at the center of the distribution, because the distribution is not normal, not bell shaped, but instead has two distinct lobes.
Any logic/science/proof/explanation with a true believer is mostly futile.
thats peak stupid. climate change is not a yearly thing.
if rainfall averages 40 inches a year and varies between 20 and 60.
if the average changes to 20 over a number of years. THATS climate change.
Tell it to those who claim a “20” event resulted from climate change.
He is not talking about an event but rather a change in the 30 year average from 40 to 20.
Which has happened in exactly zero places on the entire globe in the historical period.
He isn’t but plenty of alarmists and journalists do.
Mr. McGinley: Excellent, someone who can do a “screen save” should keep this admission from Mr. Mosher, that Climate Change is observed nowhere on earth.
Show us a pair or Koppen climate maps of the world from two widely separated years and point out some places that the climate has changed, eh?
Be a good lad come on now, you said it.
I can tell you of one distinct and well documented parameter in one particular geographic region that there are long term changes in the frequency of extreme events, and perhaps even in the average monthly low temperature sufficient to nudge some spots from one Koppen zone to another.
In peninsular Florida, it has happened in our lifetime that there was a change in frequency of killing freezes (sufficient to wipe out a substantial proportion of a crop of say oranges or strawberries or eliminate entirely a crop such as avocados from the state for a period of years) from very rare the mid1950s to mid1970s, to very common in the mid1970s to mid1990s, and then back to very rare since then.
However, when you speak of climate change, it has been pointed by warmistas that this refers in common parlance in the present day, to only those changes brought about by human beings’ emissions of CO2 and perhaps other greenhouse gasses.
But an examination of the documented history of growing oranges in the state of Florida, that such multidecadal switches from “easy to grow orange trees” to “nearly impossible to raise orange trees”, over large portions of the state, has been seen to have occurred as long as people have been trying to grow oranges here, IOW from the period around and after the Civil War, IOW the 1860s.
Large parts of Florida were settled long time ago, and such political divisions as the naming of counties in the state occurred as people moved in and settled the state.
There is a place called Citrus County, which got it’s name due to a large scale growing of…wait for it…CITRUS! But one would be hard pressed to find anyone growing citrus on a large commercial scale in the past 60 years, and more especially since the freezes in the 1970s. When I moved to Florida for college in 1982, there were huge areas of orange growing around Orlando (Orange County), and in many areas between Orlando and Tampa, especially and in particular such places as northern Hillsborough and Pasco Counties. Many growers who had lost fruit but saved their trees in the series of terrible freezes that began in 1977, were wiped out in the 1980s by even more and even worse freezes, including events where the freezes were not mostly radiational cooling events of one or two nights duration, with relatively few hours of temps below 28°F and then only at night(generally it takes 4 hours or more below 28° F to damage oranges), but instead were advectional freezes in which high winds accompanied freezes that had durations of several days and extended all the way down to the growing areas south of Miami where such crops as avocados were grown on trees that were decades old, killing them graveyard dead.
Similarly, enormous groves of oranges along SR 50 in Central Florida, groves with trees that were also decades old and huge reliable fruit producers, were killed down to below the graft line, in these freezes that occurred in the mid-1980s.
Similar events occurred beginning in the 1890s and continuing for a couple of decades, after decades of weather that almost never saw a killing freeze in any part of peninsular Florida. This period was followed not long after by a series of hurricanes over about 10-12 years, that virtually wiped-out entire cities and towns in the southern half of the peninsula, culminating in the 1935 hurricane that was the strongest to ever hit Florida in the documented historical period.
People left in droves after each of these events, leaving most of Florida sparsely inhabited by the 1950s, and mostly people did not start moving back until the advent of inexpensive air conditioning.
Long term multi decadal patterns shift and change, yes, but these changes can be seen to often be related to fluctuations in the frequency of severe weather events.
And most significantly, such changes and shifts can be shown to be cyclical in nature, and nowhere and not at all an inexorable or monotonic shift in the same direction.
Milwaukee since 1870 has had 7 years where it never got to 90°F. And from 1916 to 1999 it never did so. Three of those seven years were since 2000. Is that any different or more rare than the record highs for all those years. Anyway I don’t recall any reports about not reaching 90° in those three recent years from our local media.
Milwaukee was warmer in the 1930’s than it is today.
CO2 is not a problem for Milwaukee.
Milwaukee’s temperature chart profile looks nothing like the profile of the bogus, bastardized “hotter and hotter” Hockey Stick chart. Another example of why the Hockey Stick chart should be considered a fraud.
There are lots of examples of Milwaukee’s benign temperature profile, where it is not any warmer today than in the recent past, from places all over the world. More examples of why the Hockey Stick chart should be considered a fraud. The Hockey Stick chart is the Outliar. Its temperature profile looks nothing like the written, historical temperature records.
The 1930s is the decade with the most hot temperature records that are still standing, by far. Many more that in the last decade.
I was gonna say sumpfink about Hokey Schticks, but yours is better…
1916 to 1999 is 83 years where “it never did so”. If both of your sentences are about never “getting” to 90°F, what do the 7 years (out of the 83 years from 1916 to 1999) have to do with anything?
Anomalies are part of the problem. They are a ΔT, a change as it were, from a station baseline. A trend of anomalies doesn’t mean a whole lot, especially since anomalies do not have a common baseline.
How many temperature records from different locations that show little to no growth must be posted before we see some that have 2, 3, or 4 degrees of growth that will cause an average of 1.5 – 2 degrees?
Two degrees of rise in an absolute temperature should be quite apparent even over 100 years. Where are these locations?
Jim,
Your observation hints at something I have been pointing out for years: There are Warmista-Made Fake-Graffs-R-Us graphs showing consecutive decades of rising temps over most of the past 100, 120, and even 150 years.
And yet there is not a single specific location that shows any such trend or pattern, when the unadjusted temperatures are examined.
How exactly doe the entire globe warm inexorably over many decades, with exactly zero actual spots where anything similar can be pointed to?
The answer, or course, is that the time series data of the US and of the world have been tampered with and altered (IOW faked) beyond any useful purpose except to perpetuate and promulgate the alarumist narrative.
This is just one of many separate items that all by themselves completely refutes the climate crisis narrative that the warmistas are spewing.
We can see what is really happening on a large scale in recent years, by looking at the best data set there is of a wide geographical area over time:

Nothing.
There is nothing unusual happening with the weather or the climate regimes of the Earth.
There is nothing that is outside of the historical range that has been observed and documented over more than a century, and more like a century and a half, of careful observations.
I am curious about the exact location of these readings?
It does not say, but is it from the Milwaukee airport?
And how has land use in and around this airport changes over this period of time?
I would not be surprised if that place had grass fields at the beginning of this time series, and that the airport was at that time, as was common practice, placed outside of and some distance from any large scale human habitation, and that this location progressed over time to paved runways, to being surrounded by industrial parks and housing and such, to the airport now being virtually inside the city and having several huge paved runways, large buildings, and even larger areas of paved surfaces for taxiing and parking of aircraft, in addition to massive hangers in large number.
In fact, Milwaukee metro area has grown hugely over the period of time in question, the last 100 years or so, has it not? It is twice as large as it was in 1950, growing from under 800k to over 1600k.
The airport that was at one time well outside the city and miles from any significant habitation, is now completely surrounded by a large urban area.
UHI effects make places like Milwaukee an awful place to examine historical temperature trends and make any conclusions about the relationship between the temps in that city to global average surface temps.
Milwaukee-Airport-aerial-photo-AHLV4100.jpg (600×283) (photoshelter.com)
I was just noticing the three location changes in this graph.
Worthless for any purpose of comparison.
Nice post, WE.
Thought I would posit some truly rare climate events previously predicted to have happened—but didn’t:
1/ By anybody’s and everybody’s definition of Global Warming, sea level MUST rise. It simply must.
Yet me and or you can do a basic back-of-envelope calculation to show that the observed rises can be explained using Archimedes Principle and a reasonable guesstimate of how much silt the world’s rivers are putting into the ocean.
That is before: Probably half as much dust again is being picked up by the wind and transported and dropped into the water that way
2a/ For an object (e.g. Earth) to be in the situation it is (alone in Space with only the Sun for company) – there are only 3 ways (singly or in combination) in which it can attain and maintain a higher temperature than it had previously
Have any of those things demonstrably happened?
NB: By reference to greenhousegases, an increase in absorption is not equivalent to a decrease in Emissivity
They are entirely different processes/mechanisms.
2b/ If none of the 3 things above have, or be seen to have happened, what sort of junk science asserts that an object (e.g. Earth) of contemporary high temperature is losing less heat energy than the same object when it was colder than present?
It breaks every rule in the book
The very definition of A Green House Gas is arbitrary nonsense:
All substances, atoms or molecules, whether solid liquid or gas demonstrate and have the properties of these very select substances.
That is: They resonate or ‘ring like a bell‘ when hit.
‘Hit’ as meaning when bombarded by and absorbing photons/quanta/packets of energy from other objects that are radiating. (have temperature)
All substance/materials/molecules/atoms do that and they all have myriad resonant frequencies – speak up now, Will Happer.
otherwise we all know this property – we refer to it as ‘colour’ and our eyes are supremely sensitive.
Even we can distinguish over 20 million different colours within a vanishingly small fraction of the electromagnetic spectrum
(Maybe from 450 nanometres through to 650 nanometres)
There are 3 stellar examples:
1/ Is why The Moon radiates more visible light than it could possibly reflect due to its very low albedo
2/ Is what creates Ozone at any and all points/altitudes in Earth’s atmosphere = Oxygen molecules are set resonating so violently by solar UV that they break apart and reform as tri-atomic Oxygen. aka Ozone
e.g. Tacoma Narrows bridge -‘cept it didn’t reform itself afterwards
3/ It is the very working principle by which Roy Spencer measures and records his monthly Global Temperature updates.
Involving Oxygen again = where molecules of ordinary di-atomic Oxygen resonate – at a frequency which is measurably dependant upon the tempeture and pressure they are at.
(Somewhere around 55Gigahertz)
IOW: Oxygen is a GreenHouseGas yet the lying scumbags of Climate Science scream from the rooftops (of their Ivory Towers) that it is no such thing
It depends on the formal definition of albedo. Bond Albedo gives different measurements than the Geometric Albedo. The Bond Albedo is the correct measure for spherical, diffuse reflectors when doing thermodynamic calculations.
Peta, your conclusion is not correct I’m afraid.
When the air temperature is x, there is a resonant frequency of O2 typical of that temperature. It is a temperature indicator, not heated by IR. It is heated by the other molecules (whether GHG’s or not).
If I put a thermocouple in that volume of air it will similarly be heated by the molecules and I can read it, but that would not make thermocouples a GHG.
Stay well
Crispin in Kampala
You are forgetting the fact that as the land erodes into the sea, the continents get lighter which allows them to rise.
Yes, it takes years for the continents to react to these changes, however the continents have been eroding since there were continents. The uplift being felt now, is the result of erosion that happened thousands of years ago.
Beyond that, compared to the volume of the oceans, the amount of silt washing into the oceans enough to matter.
The mountains lose mass, the coast gains mass, especially the section that is currently under water but still in the shallows of the continental shelf.
So, the mountains lose mass, the land underneath them rises due to buoyancy and they continue to erode.
The coast acquires mass from the sediments and sinks, making it look like a sea level rise. Remember, the measuring stick is stuck to the bedrock, the sediments go over these rocks, it all sinks together.
So the concept of erosion CAN erosion can cause a ‘sea level’ rise.
Maybe someone should get a grant for this?
So the concept of erosion CAN
erosioncan cause a ‘sea level’ rise.The UN position can be summarized into two simple rules:
Eco-zealots know full well how the art of propaganda works. Prescient movie line from 1992:
That’s right, it is all about the information, and the Bad Guys have control of most of it.
If an extreme weather event is defined as either less than the 10th percentile or more than the 90th percentile of some weather parameter (temperature, rainfall, snowfall, etc.), then 20% of all weather is extreme–it follows from the definition of percentiles.
What would be more telling is the ratio of high-end events (>90%ile) to low-end events (<10%ile) over time. For example, if we have a 50-year record of temperatures for a given location, and newer data is compared to this 50-year record, if there are more >90% ile values in the new data than <10%ile values, then one could say that the frequency of abnormally high temperature is increasing.
They always say “follow the science” or ‘listen to the scientists” , that is until a prominent scientists calls them out on their propaganda.
https://youtu.be/D1kW2wUP1y4
You should only listen to the APPROVED scientists.
Card-carrying members.
The IPCC seems to think that in general they can let others carry the propaganda ball. But the mere fact that they do not call out the lies, even those being presented by the UN, betrays their intent.
Excellent point. Kinda like the locals who lived near any of the death camps – they might not have worked in the camps themselves, but they certainly knew what was going on inside the wire.
Burning human flesh has a uniquely repulsive odor, as first-responders or veterans are all too aware. Yes, those living nearby should have realized what was happening.
There, fixed it for ya…
“WAS was” -you’re making even less sense than usual. Are you off the little happy sweets again?
Thank you for pointing out my typographic error. It is só important that we always get the facts straight. Otherwise we start believing things…
Or, in your case, NOT believing things.
What’s the accent over the ‘o’ for, by the way?
Whoa!
Looks like we have an ACTUAL denier in our midst.
Do me a favor, and do not agree with anything I say, ever, eh?
Yea, it never happened. The videos and pictures are all fakes. There was never a pile of bodies in that room at Dachau where I stood. The ovens were used for bread. The “shower”, that was not a shower was a figment of my imagination and the holes in the shooting wall were put there afterwards.
Sick!
I visited Dachau the first time while TDY. Later I was stationed at Flint Kassern in Bad Tolz. After I got to know the Bavarians around me I went back to Dachau again.
I had to figure out how it happened. How a people that treated us so decently and in fact kindly could have allowed that to happen?
After all the Kassern was an SS Officers training school and Bad Tolz was a hospital center with 8 hospitals during the war. One of the 8 satellite camps of Dachau provided the slave labor for those hospitals and the Jukershulle.
In the end sitting on the steps of what had been the mess hall for the guards at Dachau and what is now a museum, and thinking I realized that there was only one answer that made sense.
It can happen anywhere! It can happen here! Such horrible mass crimes can be perpetrated and ignored by any people in any society, given the right circumstances.
And those that don’t understand that will be far more likely to be the tools to facilitate it happening or at the very least ignoring until it is too late to stop it.
Just to be clear, I do know that the shower/gas chamber at Dachau was never used. But it was there ready to be used. There were piles of bodies, train car loads, without it being used.
BTW not far from Dachu is Furstenfeldbruck. At the air base there is where the shoot out between the German authorities and the Palestinians that massacred the Israeli athletes at the Olympics in 1972 occurred. They had not repaired the bullet holes in the control tower. I guess as a reminder. That was in 1987.
Then you are affirming that they realized it was happening.
Accurate assessment. You can find a “rare” meteorological event someplace in the world several times a day. How do I know? Because the AGW fanatics find them and let us know.
<get your migraine medicine ready to hand>
“”Climate change made the storm that devastated the Libyan city of Derna, killing thousands of people, up to 50 times more likely, experts say.
By Justin Rowlatt
Justin Rowlatt’s getting his airmiles sorted – he’ll be able to get a free upgrade to ‘Davos’ class seats soon!
Fredi Otto going ballistic again 🙂
Just today the President (or whatever his title is) of Ukraine seems to have pointed to the recent earthquake in Morrocco and conflated it with and blamed it on climate change.
He also seems to have been saying we can prevent natural disasters if we all spend all of our time, efforts, and money on doing so.
Although his monologue seemed somewhat muddled, and he may have been saying that we cannot afford to have wars when we have bigger fish to fry, like climate change and natural disasters.
If that is what he was saying, was he calling climate change a natural disaster?
In any case, we have now reached a state of affairs that no one blinks an eyelash when people refer to weather events as “climate change”.
Mr. M: I’m guessing nobody in the room with Mr.Z. had the nerve to suggest that Ukraine should surrender to Russia because Ukraine “freedom” is a lesser priority than AGW.
The science humor cartoon has this covered.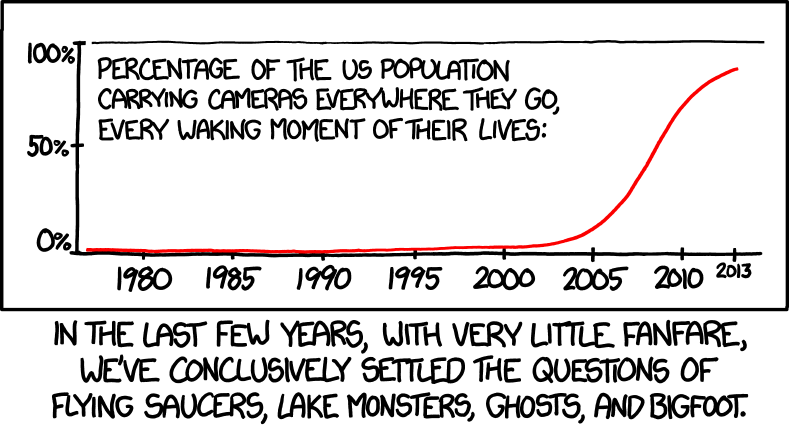
To which I would add we also now know just how common “rare” weather events are.
Some used to claim that cellphones cause brain cancer. They don’t.
But they do cause climate hysteria.
Fun story from back when I became Chief Strategy Officer at Motorola (late 1990s). Found out that for decades we operated a pig farm. Strapped public safety radios and then cell phones to their heads. Devices were modified to emit much more than max allowed RF. 4 years on, pigs would be killed and necropsied. No brain cancer. Mot did it to have ammo in case we got sued for causing brain cancer. Word must have gotten around to ambulance chasing lawyers, because nobody ever did. They knew they would lose.
The 5 G scare is being tested by the Chinese…some cities already have it installed so it is just wait and see…thanks Xi.
Now what we need is some sort of pervasive radiation that will kill the COVID virus and nothing else.
Professor Luc Montagnier. He won a Nobel prize. Please go see why, it has immediate importance to your statement. (it’s the other way ’round)
It lends credence to the paranoid theory that covidiocy seemed to erupt in places with good 5G coverage…
The science of cymatics have a long way to go, and nobody I know of is doing it at RF. But then, I don’t know that many things…
Even Montagnier was stuck at audio frequencies and maybe a bit higher.
I see no attention given to the disturbing effort growing to wean us off conspiracy theories involving evolution. Even before we know there’s some evolution conspiracy? Now that makes me look over my shoulder!
5G, mostly installed in locations of high population density.
Spread of respiratory viruses, easiest in places of high population density.
Mass delusions, easiest in places with high population densities.
Democrats, mostly occurring in places with high population density.
QED.
Everything and anything we do only ever makes everything and anything worse, never better, so that would be flat out impossible.
Or, as I have often remarked, “The corollary to Newton’s Third Law is that for everything a society does, there is an equal and opposite reaction called Unintended Consequences.”
My initial remark was tongue in cheek.
I wonder what the Animal Rights crowd (The ones that won’t use products or drugs tested on animals.) would do if they founds out their cellphones were tested on animals?
Would there be a drop in climate hysteria? 😎
Pigs have really fat heads. Also, humans live longer than 4 years. Is there any engineering record as to what exactly was modified on these devices? Except for the licensing issues and possible bleeding over other channels, modifying transmitters can mean anything. I would love to see the paperwork!
I appreciate the work you do here, mister Istvan, so I’ll refrain from airing my views on Motorola et cie performing “safety studies”. The quality of information shared is worse than the climastrologists, in my view. Especially considering that Motorola-employed professor that got 4 million and no publicity for his research on RF damage… I shall try find that bloke’s statement again, remember it from the old Wireless World magazine?
And the media reports them as evidence of man made climate change. Sunak must have been made aware of this manipulation as he is putting the brakes on Net Zero.
“So when folks claim things like “We’re already seeing the effects of global warming in storms/cyclones/floods/coastal erosion/fire weather/sea level/etc.”, feel free to tell them that the IPCC and reality itself both beg to disagree.” Tell the AHOLE in the WHITEHOUSE this then!!
For most of the media, a weather event is considered rare or extreme whenever doing so advances the climate crisis narrative. Even if the event is neither rare nor extreme by any rational measure.
Do you notice the bit of wicked wordplay going on here? When the public hears the term ‘extreme weather event’ they think ‘extremely dangerous weather event’ (hurricanes,tornadoes,floods, etc). But when the IPCC uses the term it means ‘extremely rare weather event’. So climate alarmists will speak about climate change increasing ‘extreme weather events’ the public is misled into thinking they’re talking about more bad storms. Very clever, these climatese.
Sorry. I can only upvote you once.
You have made a very perceptive point.
I did it for you.
It’s all about giving the “approved” impression.
Over a decade ago what used to be The Weather Channel would routinely show the record high and low for the day during the “Local on the 8s”.
After it changed hands they stopped doing that.
Record highs set 50 years ago didn’t fit with the “Global Warming” meme.
(It might give people the wrong “impression”.)
Yeah, but even then they did not post the record high low, or the record low high, for the date.
So there is that.
If there was really anything unusual going on, it would be readily apparent by looking at a graph of the means and the extremes for every location, or any location.
Rarest thing of all?
Any time period when the planet had zero severe or dangerous weather events occurring.
It has never happened.
Hilarious! Note that what is truly rare is average weather. Thus it is hype to call it “normal” which many do, especially hotter than normal. The weather is almost always not average but not abnormal.
Speaking of frivolous / alarmist claims of “extreme” and “rare” weather conditions, here’s today’s serve of bullshlt from an Aussie news site –
Temperatures soared to between 10 and 15 degrees above average in many areas of Sydney, including in the CBD, which hit a peak of 34.6C at 1.55pm on Tuesday.
That was its equal hottest September day on record.
The CBD weather station, on Observatory Hill near the Harbour Bridge, has been taking temperature readings since 1858.
The average maximum temperature for Sydney city in September is just 20C.
The heat was also a record-breaker at Sydney Airport, where the mercury peaked at 35.9C at 1.39pm.
It beat the previous September peak of 35.6C, which was set in 2000.
https://www.news.com.au/national/weather/australia-heatwave-sydney-sees-hottest-september-day-on-record/news-story/ac9c668a22f41ee7c8b3eec2e50a04b5
Note the stations’ placements that were highlighted –
The CBD weather station
and
Sydney Airport
UHI effects, anyone?
Of course no mention is ever made of the 1896 catastrophic heatwave that took >400 lives.
Rural areas around Sydney recorded up to 47 C. Fore example –
Bulli N.S.W. 13 Jan – 115° F “This has been, the hottest day known“.
Kiama N.S.W. 13 Jan – 117° F ” A Scorcher Everywhere. Death and Distress.“
Parramatta N.S.W. 13 Jan – 111 ° F “Fruit Broiled on the Trees.” “Birds and Animals Drop Dead.”
Camden N.S.W. Tuesday, 14 Jan – 123°F “Great Heat Wave ” “LIST OF CASUALTIES.”
https://joannenova.com.au/2012/11/extreme-heat-in-1896-panic-stricken-people-fled-the-outback-on-special-trains-as-hundreds-die/
It would be an “extreme” challenge to find two WORSE places to measure temperature than at Obs Hill and Sydney Airport !! 🙂
Can the good people of the interweb please help me raise funds for a new thermometer? I also want one that can measure down to point nine, but I am stuck with a worthless piece of crappadoodle that only has marks at every ten point ones.
Please send money urgently, or, alternatively, send me one of them super-dooper mega-accurate zero-point-one mercury fermommeters.
I thank you all for assisting me in this time of low resolution temperatureness.
You’re asking the wrong people, I’m afraid – try Mikey Mann or other climate activists, they seem to have cornered the market in thermometers that are accurate to 0.1° and often 0.01°.
🙂
So there is an 80 percent chance of an individual type of extreme weather event not occuring, but there are 25 types of different weather event mentioned.
So is the chance of none of them hapenning 0.8 to the power of 25 ??
(I make that about 1 in a hundred ..so the chance of any one occuring is 99 times in 100).
????
Yes and No.
The extreme weather events are not independent. So it’s not quite that high.
But the principle you make – that the chance of at least one of them happening is greater than if there was only one type – is true.
On a related topic, notice how they never ever report what percentage of locations are having nothing bad occurring on a given day?
What is the value in identifying a rare event? If it is anything more than just a topic of conversation among the laypeople, then probably the 10% and 90% confidence interval or a ninety percentile level of the cumulative density function (cdf, the definition Willis stated seems to have incorrectly used the pdf rather than cdf) seems too small — 5% or 1% would be more common or just stating a “p” value and letting the reader decide for themselves the rarity or not of the event.
Sometimes we are interested in practical problems: 1) specifying a design that will survive an event of some magnitude that occurs infrequently, but within the lifetime of a machine or structure, 2) deciding if events follow a particular pdf and rare events are necessary to clarify the tails of the distribution, 3) deciding if the parameters of a process are stationary or not by examining whether or not rare events are becoming less rare.
In these practical cases the definitions above wouldn’t be worth much.
Thanks W.
I wonder if age has an influence on thinking something is a rare event.
I recall hearing when the Great Lakes were shrinking/flooding.
Same with the Great Salt Lake.
Then ski resorts didn’t have enough snow, and same resorts closed because of too much snow. [There are others.]
Rare may be in the eye of the beholder.
Anyway, the recent rare flood event at Derna, Libya reminded me of the Johnstown Flood {in time and space, not too far from my childhood}. Pesky dams and heavy rain make for a dangerous combination.
But Al Roker said it was worse in a TED Talk!
https://www.ted.com/talks/al_roker_an_extreme_weather_report_from_america_s_weatherman
If one accedes to the “consensus” that climate variables can be measured to ever greater decimal places as data is accumulated, then the space of outcomes becomes a virtual continuum, and as everyone knows for a continuous probability density, the probability of any single event is extremely small. Therefore every single event is an “extreme” event. Ah what a “climate emergency” we have, every event is an extreme event……clearly more money is needed.
Is this what they mean by the 10th and 90th percentile? Could they be referring to a bell curve where the outlying areas would contain a very small number of instances?
10% of the data occur by the 10th percentile, and another 10% occur after the 90th percentile, adding to 20% occurring at alleged “extremes”. 20% is 1 in 5. Is that very small?
20% is what the Big Three are offering the striking union workers.
It’s probability density so yes, it’s a bell curve but its as much of the curve that represents 10% of values at either end. To really understand the statement we need to understand what they’re measuring and why they chose those metrics.
What we are seeing more and more of, however is, thanks to modern technology, lots and lots of coverage broadcast into the magic box in our homes, of every raindrop or sunbeam.
There’s no doubt, there are some dreadful tragedies and disasters happening around the world. It’s a great shame these events are being used to promote the phony climate crusade. Deliberately crafted to appeal to the emotions of those less well informed, and of course, those who simply want to believe that the human race can only act to self destruct, and take the whole planet with them.
Data used to be a good way to argue scientific points.
Here is some data about heatwaves, with reference to what IPCC claims in that table that Willis shows.
These are heatwaves in Australia, in 8 cities that together host about 80% of Australia’s population.
Heatwaves where people live might be more important than those in a vast desert.
Please give this link time to download. Then, take a look to see if you can find serious excursions above or below the norm.
Please ask if you would like the raw data behind these graphs for your own analysis.
Geoff S
https://www.geoffstuff.com/eightheatwave2022.xlsx
The climate alarmist set have not been able to find dread in more than an alleged global temperature rise. The IPCC table confirms this.
Sea level change is happening, but it is hard to link it to man-made climate change because it has been at the same rate long before CO2 started to increase.
The global temperature change has far larger uncertainty than is admitted. I have a UHI paper in prep that shows how poorly it has been treated. UHI could account for more than half the alleged rise in global temperatures. Some satellite based studies in progress might soon clarify.
The big question still is whether that global temperature change is caused by acts of Man, or is it natural? It is getting harder to separate propaganda science from hard science.
Geoff S
Very nice Willis. They are grasping at straws, they have no proper science defend their position.
As much as I appreciate the compelling scientific case Willis repeatedly brings to the table, the alarmists consistently win politically and in public opinion. There is too much money, politics, and inertia behind climate hysteria, and it appears that it will only end when enough people have been forced into poverty, which is the #1 cause of death. Thanks Willis for making the scientific case against climate alarmists.