Image above: Global Water Vapor – Source: NASA: https://earthobservatory.nasa.gov/global-maps/MYDAL2_M_SKY_WV
Readers may recall that we have reported on the massive amount of water vapor that has been injected into the stratosphere by the 2022 eruption of the Hunga-Tonga volcano. A recent study said a 13% increase in stratospheric water mass and a 5-fold increase of stratospheric aerosol load.
Water vapor is by far the strongest greenhouse gas according to NASA, and it stands to reason that the dramatic increase in stratospheric water vapor is having an effect on global temperature.
Water vapor is Earth’s most abundant greenhouse gas. It’s responsible for about half of Earth’s greenhouse effect — the process that occurs when gases in Earth’s atmosphere trap the Sun’s heat.
https://climate.nasa.gov/explore/ask-nasa-climate/3143/steamy-relationships-how-atmospheric-water-vapor-amplifies-earths-greenhouse-effect/
Dr. Ryan Maue writes on Twitter:
Everything was going fine until mid-March 2023, and then a dramatic 1°C warming spike in a matter of 2-weeks raised global temperatures to the record levels we are at today.
La Nina –> El Nino is certainly important for the Equatorial Pacific temperature increase. But, how is Hunga-Tonga affecting the Southern Hemisphere polar vortex? Not so good with the Antarctic sea ice down there.
And, the Northern Hemisphere is much warmer than normal especially in the Atlantic. How are all those trillions of gallons of water vapor in the stratosphere doing? How much is left, and how many more years of impacts?
https://twitter.com/RyanMaue/status/1685753261620363267

Another metric, the UAH satellite data also shows a spike in recent months, though still not as strong as the 2015/2016 El Nino, it is at least as strong as the 1997/1998 event.

From a recent publication, “Global perturbation of stratospheric water and aerosol burden by Hunga eruption” bold mine:
The eruption of the submarine Hunga volcano in January 2022 was associated with a powerful blast that injected volcanic material to altitudes up to 58 km. From a combination of various types of satellite and ground-based observations supported by transport modeling, we show evidence for an unprecedented increase in the global stratospheric water mass by 13% as compared to climatological levels, and a 5-fold increase of stratospheric aerosol load, the highest in the last three decades.
https://assets.researchsquare.com/files/rs-1864748/v1_covered.pdf?c=1659031907

Figure 6. Global perturbation of stratospheric water vapour and aerosol burden. (A) 372 Evolution of the global MLS stratospheric water vapour mass (3-day averages) between 100 hPa 373 – 1 hPa pressure levels (solid black curve) and climatological (2004-2021 period) annual cycle 374 (dashed curve), the positive and negative anomalies are shown respectively as red and blue 375 shading. (B) Deseasonalized stratospheric water vapour mass anomaly (per cent 3-day averages) 376 for both hemispheres and the whole globe from MLS. The embedded panel shows the evolution 377 of global anomaly in 2022. (C) Stratospheric aerosol optical depth (SAOD) anomalies for the 60⁰ 378 S – 60⁰ N latitude band (monthly averages) from GloSSAC merged satellite record extended using 379 OMPS-LP measurements at 675 nm scaled to 525 nm wavelength using GloSSAC data and SAGE 380 III/ISS measurements at 521 nm converted to 525 nm using SAGEIII-derived Angstrom exponent. 381 The SAOD anomalies are computed with respect to the background level estimated as GloSSAC 382 SAOD average over volcanically-quiescent 1995-2003 period. The embedded panel shows the full 383 time span of SAOD series. The cyan and pink letters indicate the most significant volcanic 384 eruptions and wildfire events respectively (EC – El Chichon, Pi – Pinatubo, Sa – Sarychev, Na – 385 Nabro, Ke – Kelud, Ca – Calbuco, PNE – Pacific Northwest wildfire event, Ra – Raikoke, ANY 386 – Australian New Year wildfire event, HT – Hunga Tonga).
Here is a video worth watching on the issue.
The mendacity … of ²⁄₁₀₀° being significant. It is of no significance whatsoever: the Δ°, daily is 500× that. The ΔT is seasonally 200× that in the tropics, and 2000× in the temperate and polar zones. Isn’t perceptible in any way apart from precision-instrumental. Sheesh!
It’s the tyranny of the models.
To put it in context, the UK MO was desperately hoping for a repeat (a proto trend?) of last year’s three hot days and a thunderstorm.
Instead they (and we) got a repeat of their infamously predicted barbecue summer. At least two months of sub normal temperatures – phew it’s 19C whatever will we do – and over adequate rainfall.
For global read regional.
Currently 14C at 18:00 in August. Had the heating on all day. Of course it’s only weather.
The whole country with weather as bad as San Francisco?
The time is way overdue for the Ministry of Silly Walks:
The doofus from Oxford University (Similar to Hahhhhhvid, that’s Awwwwwksfudd) at 1:23 is a perfect specimen of a worthless British elite academic spewing nonsense.
It’s important because of the importance!
Uh huh.
Anything lacking even the remotest anthropological angle does not count. It fails the narrative compliance check without consideration of any kind. And it goes down the memory hole doubleplus quick.
A quick search of the BBC yields…. absolutely nothing since the eruption in 2022
“Tonga volcano: Plume reached half-way to space”
Dr Simon Proud, from RAL Space, said these were “unheard-of altitudes” for a volcanic plume.
https://www.bbc.co.uk/news/science-environment-60088413
The BBCs dependent child – also known as the Guardian – is a little more up to date and yet….
“Scientists calculate 2022 eruption of Hunga Tonga-Hunga Ha’apai volcano released 1,000 times more energy than Hiroshima bomb
…
The researchers’ computer simulations of the event, based on a combination of data sources, suggest the western coast of Tofua Island experienced waves of up to 45 metres in height
https://www.theguardian.com/world/2023/apr/14/tonga-volcano-explosion-equalled-most-powerful-ever-us-nuclear-test
…it’s hung up on last year’s tsunamis. With ‘suggestions’ from models.
There is, despite the knowledge of how high water was blasted into the stratosphere, no thought, no curiosity even as to what that might mean (I think in truth at least some of them know, or suspect)
“Record Global Temperatures Driven by Hunga-Tonga Volcanic Water Vapor”
Is a headline we’ll never see in the media, nor anybody advocating such an idea. No matter how factual and accurate it might be.
Why is it always Hiroshima bombs with these people? No, I didn’t imagine it…
“The planet is building up heat at the equivalent of four Hiroshima bombs worth of energy every second. And 90% of that heat is going into the oceans.
Right, now I’ve got your attention.”
https://theconversation.com/four-hiroshima-bombs-a-second-how-we-imagine-climate-change-16387
Has any media tried to blame the spike on CO2 yet?
That’s all they say…. We must reduce emissions etc
Let me try.
The CO2 heating has led to so much loss of ice at the poles that weight on continental plates is reduced, allowing movements that release magma throughout the world.
This volcano is clearly due to 4x4s.
Give ne research funding and I can prove it with models.
The checks in the mail. Wait for it.
I hope it is a certified check. I’d hate to have that reality check bounce.
It is a certified virtual money order!
In the UK you need to be sure you can cash it. Say the wrong thing, and you get debanked. Accounts closed. No explanation.
Strat – Why is it always Hiroshima bombs with these people?
Why compare to the well known ‘Hiroshima bomb’ measurement.
By today’s standards the two bombs dropped on a Japan were small — equivalent to 15,000 tons of TNT in the case of the Hiroshima bomb and 20,000 tons in the case of the Nagasaki bomb. (Encyclopedia Americana. Danbury, CT: Grolier, 1995: 532.)
Same reason they DONT use the Tsar Bomba’s yield of 50 megatons: astronomically powerful—over 1,570 times more powerful, in fact, than the combined two bombs dropped on Hiroshima and Nagasaki.
Your answer, Wouldn’t scare enough people.
Apropos of nothing in particular, the UKs winter electricity production is about a megaton of TNT per day.
Imagine having storage for a week of no wind, sitting next to your house…
That puts things into a concerning perspective.
Yep. Maybe it is just a little bit heavier atmosphere together with a more active sun pushing harder on the surface of this planet.
Your “greenhouse effect” link says the following: “Without carbon dioxide, Earth’s surface would be some 33°C (59°F) cooler.” You say WV is about 1/2 of the effect. The link seems to attribute the entire effect to CO2.
Which?
I think what NASA is asserting is that without CO2 there would be no water vapor in the atmosphere because it would be too cold. Another way I have heard it said is CO2 is the lever for water vapor. Hence the two statements are compatible
The sun sublimates solid water in various places on earth and at low temperatures. It would be silly to say without CO2 there would be no WV.
Yes its silly I agree. Isn’t this all about silliness?
Even in the absence of the sun, wind can cause sublimation of ice.
Sublimation occurs of course, but the driving force is the degree to which the air in contact with the ice/snow is not saturated with water vapor. At -18°C (0°F), very little water vapor is needed to reach saturation. That’s why there’s truth to the idea “too cold to snow”.
This illustrates the importance of always asking the question how significant is the effect? We often get stuck thinking in abstractions and absolutes. You’re right that it’s wrong to say there would be “no” water vapor when there would be “negligible” water vapor. But is that really relevant?
I answer that below. It is relevant because the greenhouse effect of water vapor would bring us back to approximately where we are today except for the CO2 and all life on earth.
Claiming CO2 is the control knob for levels of water vapor is more modeling codswallop. Water vapor is going to accumulate in the atmosphere regardless of CO2 levels. It is purely the result of evaporation and air mass movement. There orders of magnitude more WV I in the atmosphere than CO2, plus it has about 5 times higher specific heat value. There ain’t no way unless CO2 is a magic molecule. Next they’ll claim CO2 has more power than “dark energy “. Moreover, how can it be claimed that WV contributes only half to the greenhouse effect, given the above mentioned ratios of the 2
Molecules? Just experience the difference of a 24 hour period in a desert vs a humid area.
Amen
First of all, I must give props to any comment employing “codswallop”!
I agree that i does look like an attempt to designate CO2 as the master control knob.
There could never be an atmosphere devoid of greenhouse gases on a water planet like earth. If earth somehow lacked CO2, but had all its water, I reckon that at equilibrium it would be a wet wasteland maybe a few degrees cooler than it is today.
If you somehow started out at -20°C and a bone dry CO2-free atmosphere, there would indeed be very little water vapor able to evaporate/sublimate into the atmosphere. But if the greenhouse effect is real (which I for one acknowledge), that little water vapor would slow the night-time cooling a bit so that the temperature is a little warmer at sunrise than the prior day. This will allow the air to hold more water vapor as the sun heats the surface during the day, which will in turn slow cooling even more, resulting in an even warmer temperature at sunrise the next morning.
Clearly that is a positive feedback which eventually must be countered by negative feedbacks. Otherwise we would end up with a very hot high pressure atmosphere mostly of steam and a dry surface. And what are those negative feedbacks? Well the obvious one is clouds.
That thought experiment should lead us to the conclusion that no practically-feasible amount of additional CO2 added to the atmosphere through fossil fuel burning could fundamentally reduce the negative feedback provided by clouds.
Anthony is quoting NASA on water vapor being about 1/2 of the greenhouse effect. It’s at the other link shown in Anthony’s post. NASA says water vapor is responsible for half the warming, and here’s what they say at the link about CO2:
“Carbon dioxide is responsible for a third of the total warming of Earth’s climate due to human-produced greenhouse gases. Small increases in its concentration have major effects.”
Of course, this is just a guess on NASA Climate’s part. They don’t really know how much warmth a given amount of CO2 will add to the Earth’s atmosphere, not even after 50 years of trying to figure it out.
For all they know, all the warming may be from things other than CO2.
I thought it was funny that the title on the page at the link Anthony gave was “NASA Climate”. I’ve been using the name kind of derisively for some time now, and it appears it’s official now.
I used “NASA Climate” to kind of separate the climate change kooks working there from serious scientists working on the NASA space programs.
Tom, that was my point. How can there be so many different answers from the same organization about the same thing? This is a rhetorical question.
Which is it? All, 33%, 50%, none?
Yes, somewhere in that range, without a doubt.
Fig. 4 of my analysis of the relationship between atmospheric CO2 concentration and anthropogenic sources suggests that the anthropogenic CO2 only explains about 0.32% of the variance in the atmosphere.
https://wattsupwiththat.com/2022/03/22/anthropogenic-co2-and-the-expected-results-from-eliminating-it/
I had a look at this Figure 4 and the explanation leading up to it. I saw shortly Figure 4: “The R2 value shows that only 0.32% of the variance in the net monthly global CO2 is predicted or explained by the change in monthly anthropogenic emissions”. As if C.S. is ignoring the fact that monthly variations are a big thing with seasonal sources and seasonal sinks, and that using whole-year data instead of monthly data would make a big change.
I also noticed: “However, looking at the bigger picture, the annual changes in anthropogenic emissions and the net annual global changes in atmospheric CO2, there is little to support the idea that a time delay of greater than a month is hiding the control of anthropogenic emissions over the total net source-flux change.” There is the matter of how the difference between manmade emissions and atmospheric CO2 increase has a lot of the difference between these being short term noise and seasonal variations. There is the matter that C.S. has Figure 5 using detrended data, and the detrending has Figure 5 ignoring strong positive correlation in longer term. I saw “Figure 5, (below) shows the plotted de-trended residuals for annual anthropogenic and total net-flux”.
Others have already established that there is no long-term (geologic time) correlation between CO2 concentrations and temperature. More recent work (Law Dome ice cores) have even called into question the cause and effect relationship.
At issue is whether the apparent correlation with anthropogenic emissions is spurious or not. I get the feeling you didn’t read the whole article. I’m following recommendations of how to distinguish spurious correlations from true correlations where cause and effect can be established. If you have other approaches to eliminate spurious correlation, I’d like to see them.
That is why the R^2 value is so low. You are supporting the thesis that anthropogenic CO2 has a negligible impact.
R^2 values are wholly dependent on the slope of the trend. No slope, no R^2. Instead, rely on p value and the standard error of the trend.
The -33ºC figure is derived from flawed assumptions and a very flaky formula for wrapping incoming solar energy onto a sphere. A much more realistic formula is outlined by Dr. Markus Ott here:
https://www.youtube.com/watch?v=Bj6ORbRBZ2s&t=20s
and here:
This is complete nonsense. And although they try to use the moon as a starting point, their formula even fails to explain the temperature of the moon.
382.8K ( =(((1-0.11)*1368*cos(0))/5.67e-8)^0.25 )
The average maximum temperature of the moon however is 394K.
Average maximum? Makes no sense. If you mean average overall, then there must be regions of higher and lower temperatures. Maximum lunar temperature is over 400K apparently:
https://lunar.gsfc.nasa.gov/images/lithos/LROlitho7temperaturevariation27May2014.pdf
It makes a lot of sense. The moon is not flat, rather it has craters and so on. This topography has some influence on temperatures. A crater can work like a parabolic disc, concentrating heat and thus reach some 400K.
Sorting out this issue, the average maximum temperature, with the sun at zenith, is.. 394K.
A few questions. Based on my understanding of Wijngaarden and Happer in these pages the greenhouse effect is determined by the effective height from which IR radiation to space occurs.
Greenhouse warming occurs because of the negative lapse rate in the troposphere, and the effective emmission height being higher and therefore cooler, with increased concentration of GHG leads to less IR loss to space
1) the temperature in the stratosphere increases with height. Putting more H2O there will cause the effective level at which occurs black body emission to space to rise resulting in more radiation to space at a higher temperature i.e. global cooling
2) Krakatoa. In 1884 injected a huge amount of water vapour into the stratosphere causing cooling over many years or so we are told
3) we were told back in the seventies that supersonic jet contrails in the stratosphere would cause clouds which would reflect visible and UV back into space So too with any water vapour in stratosphere – causing cooling
so in summary increased water vapour in the stratosphere should cause cooling. Please tell me if I got it wrong
This volcano was quite deep – under water.
“2) Krakatoa. In 1884 injected a huge amount of water vapour into the stratosphere causing cooling over many years or so we are told“
Krakatoa ejected a large amount of SO2 which has a cooling effect. The Tambora in 1815
also was a huge ash/SO2 eruption which led to the “year without summer” in 1816.
The Hunga-Tonga eruption blew some 40 trillion gallons of water into the high stratosphere/mesosphere as it was an underwater eruption.
Radiation physics only deals in one of the energy transport mechanisms of the atmosphere. As such, it misses a lot. I wouldn’t put much value in “emission height”. It’s a construct of marginal value.
”Emission height” is just the altitude at which the lapse rate temperature matches the equivalent radiative temperature of the planet by the SB equation at .3 albedo. Its just a mathematical construct like the average depth of snow on the planet or the average depth of the ocean. The outgoing IR is NOT from a given height. The planet as viewed from a satellite is a mosaic of emissions at sea surface temp, ground temp, cloud top temps, with some water vapor and CO2 emissions from various altitudes thrown in. Just look at some GOES satellite pics. It’s not what I get from reading Wijngaarden and Happer.
Thne mean free path of an IR photon close to the ground is only a few metres, so it gets absorbed and a proportion are re-emitted, perhaps at a different wavelength, depending on the excited stat of the GHG molecule. In fact, the actual emissions to space mostly occur at high altitudes where the mean free path increases to the order of km. It’s just that as the atmosphere thins out, photons tend to go a bit further when emitted upwards than when emitted downwards before being reabsorbed, creating an effective net flow upward.
This paper can be viewed as a precursor to Wijngaarden & Happer, and goes into some of the underlying physics in more detail than they do.
https://www.hindawi.com/journals/ijas/2013/503727/
Recommended if you can follow along with the argument.
I seen claims that attribute 60-70% of warming to water vapor
Not on the BBC you haven’t.
It’s a long time since the beeb made a decent documentary on the subject, but back in 1998 Aubrey Manning made “Earth Story”, a series of eight parts, and I’m pretty sure that the last part dealt with the then controversial AGW theory and if memory serves he said that WV was over 200 times as effective as CO2. It’s probably why you can’t get it on BBC IPlayer any more, but the series is still available on youtube, Google play and Amazon.
https://play.google.com/store/tv/show?id=-UM5UuF9PY0oQ9K7lIPkJA&cdid=tvseason-1sqRfcGyiLOLiaU_keC7kQ&gdid=tvepisode-IwPgQ0DUWdU
https://www.amazon.co.uk/Earth-Story/dp/B0752S1C3D
https://www.youtube.com/watch?v=IwPgQ0DUWdU
Well worth watching the whole series.
80% in the models.
Water vapor is indeed the main greenhouse gas in Earth’s atmosphere, and CO2 is second place to water vapor. There is the matter that warming the world has a positive feedback mechanism from increase of water vapor, even though the CMIP3, CMIP5 and CMIP6 climate models seem to overstate this water vapor positive feedback.
Going forward it’s going to be hard to discern the natural influences on the climate. The volcano’s effect could last years.
Strange – nobody in the alarmist camp added “it’s worse than we expected”.
It would seem that water would fall out fast if not in equilibrium, it could not persist where it can not be suspended.
Good point, Walter.
For volcanic stratospheric aerosols (SO2) the measured washout is 2-3 years depending on the injection. Data in essay Blowing Smoke in ebook of same name.
Dunno about water vapor, hasn’t measurably happened before.
“Dunno about water vapor, hasn’t measurably happened before.”
Yes, we are in new territory.
“Record global temperatures”. That’s funny. No, that’s hilarious.
Yeah, because last month, before UAH reported the warmest July in its global record, most folk here were saying there was nothing to see. What warm temperatures? Airports. Air conditioning units. Fake news.
Now there’s a clamour to explain why the warmest July in the global instrument temperature record, which they initially denied had even happened, was caused solely by an underwater volcano that erupted more than 18 months ago!
It is indeed hilarious. Keep the comedy coming, WUWT.
I realise you are just too lazy to look up stuff for yourself. I have fallen into your trap. Below is a commentary on the lasting effects of the Tonga eruption. Try finding the sources from the commentary.
I quote:
‘The water vapour effects of the Tonga eruption are likely to remain in Earth’s stratosphere for several years. A study published in Geophysical Research Letters estimates that the eruption sent around 146 teragrams (1 teragram equals a trillion grams) of water vapour into the stratosphere – equal to 10% of the water already present in that atmospheric layer. That’s nearly four times the amount of water vapour that scientists estimate the 1991 Mount Pinatubo eruption in the Philippines lofted into the stratosphere.
The water vapour from the Tonga eruption will likely affect Earth’s climate in a number of ways. It could:
The exact effects of the water vapour from the Tonga eruption are still being studied, but it is clear that they will be significant and long-lasting.
According to a study published in Nature Communications, the water vapour from the Tonga eruption could remain in the stratosphere for up to 5 years. The study’s authors found that the water vapour is slowly mixing with the rest of the stratosphere, and it could take several years for it to fully dissipate.
The long-lasting effects of the water vapour from the Tonga eruption are a reminder of the power of volcanoes to impact our climate. Volcanic eruptions can inject large amounts of gases and particles into the atmosphere, which can have a significant impact on weather patterns and climate change.
Indeed, many considerations, and work in progress to evaluate them. I think that the Nail was probably expecting an instantaneous response to the eruption rather than a delayed one, although he offers no explanation for that expectation. By the same token, part of the work needs to identify the mechanisms of delay in the response. There are of course plenty of examples of significant lags in climate response to particular impulses.
So why did the warming after the Hunga Yonga explosion not happen at all for the following 13.5 months, and then all of a sudden warming happened over a few months? I think the Hunga Tonga explosion was a small bit player, and what mainly happened was the last of the three dips of a triple dip La Nina and recovery from that, plus a bit of early influence from the current El Nino, and the upspike of July (and last few days of June) 2023 appears to me as mostly a short term spike.
My hypothesis would be if this ‘spike’ is indeed due to the HT eruption that the added SO2 and aerosols would cause cooling as observed in previous eruptions and the stratospheric H2O would cause warming and that initially they cancelled out. The SO2/aerosols would be flushed out over about 18 months leaving only the warming effect of the strat H2O which will last for several more years. It’ll be interesting to see how it pans out.
That sounds logical.
Give it a rest Rusty. You know very well that several of us said unequivocally that it was warmer. What we also said, and continue to say, it’s nothing to be concerned about. There is NO CLIMATE EMERGENCY!
Probably around the same as mid 1930s,
(surface data and related fabrications are too tainted by many factors to use for comparison.)
… and definitely NOT as warm as most of the Holocene.
Just a degree or so of highly beneficial warming from the LIA, which was the coldest period in 10,000 years.
From 10-20 times more people die from COLD that from heat, so more warming would be beneficial to human life, especially if it effects minimum temperatures more than maximums.
Yes, very beneficial to human life. That’s why they are opposed to it.
Oh, you’ve said it, and ‘others’. That’s a weight off, Rich.
You missed this:
Where Is The “Climate Emergency”?
LINK
Enjoy.
I do sometimes feel bad for you Rusty, if you really have worked yourself into a tizzy over a mega-hyped non-issue. But other times it seems like you’re just a soldier in the propaganda army, executing your assigned tasks.
Do you have any capacity to question The Narrative? Do you not notice the pattern of hyping things that happen on a regular basis as if they were extraordinary? Have you not noticed that the supposedly unprecedented events are drawn from ever corner of the globe where in generations past, such events would mostly pass unnoticed?
How can you really be so obtuse as to think that a temperature series going back to 1979 is a meaningful time period that justifies the phrase “hottest on record”? You seriously don’t see the dishonesty when most people will assume it means a few centuries and some (probably not a tiny number) will take it to mean in all of history? Even if it is technically accurate it is lying with the truth. I know that 1979 is lost in the mist of time. Jimmy Carter, the Iranian hostage crisis, the year I graduated high school. Even Jimmy is still with us! Hottest “on record”, indeed!
Use your head for more than a hat rack, Rusty!
> “the warmest July in the global instrument temperature record,”
According to NASA:
“there are too few data before 1880 for scientists to estimate* average temperatures for the entire planet.”
I find it hard to believe that even in 1880, there were sufficiently distributed data points from the southern hemisphere and northern polar regions for any reasonably reliable estimation of an average temperature for the entire planet.
But let’s assume that NASA is correct, that still means that it’s just the warmest estimated July since the earth started coming out of the Little Ice Age (a.k.a. the coldest period in the last 10 thousand years)
*estimate (verb) – roughly calculate or judge the value,
Heck with 1880, even today we don’t have enough ground stations, and the few stations we do have are mostly concentrated in Europe and N. America. The rest of the world ranges from poorly covered to virtually uncovered.
So, there is UAH v6 TLT. And, USCRN agrees with adjusted USHCN which is part of GHCN. And, there are plenty of sea surface datasets that show the world is warming, with my favorite one being HadSST3 which got shown to not overreport its warming trend. And, please consider JRA-55 and ERA5. JRA-55 even got favorably cited by Steve Milloy of junkscience, who does cherrypicking to argue against existence of modern global warming. Even Ryan Maue said at least once ERA5 is good.
“there are plenty of sea surface datasets that show the world is warming,” If you believe that are you sure you don’t want to buy a bridge. The oceans cover 73% of the world humans and ship cross very little of it. The measurements are garbage, dissimilar and random over the last 150 years, that is not a data set it is junk.
DK,
Why do you bedwetters think you can perpetually get away with taking as a given that warming is harmful? You seem to assume that all you need to do is “prove” that there is some warming and for some reason we are expected to agree that there’s a CLIMATE EMERGENCY!!
The effects of warming to date, even granting all the unwarranted assumptions that it is entirely due to fossil fuel emissions, is wholly beneficial to human flourishing. In terms of agricultural output, deaths from extreme temperatures, deaths from extreme weather events, extent of forest fires, numbers of major hurricanes, etc.
The effects on the biosphere are similarly positive, with greening of the earth. The polar bears and the coral are thriving.
The empirical evidence is that ECS is ~1.7K/doubling of CO2. We don’t have enough fossil fuel left to reach levels of warming that could be net detrimental.
So why do you really want to destroy our economy?
There’s another assumption, they assume that if it is warming, CO2 must be the cause.
Carefully selected sites, meticulously adjusted all agree with the predetermined conclusions.
How special.
It’s looking solidly reliable that Earth just went through its warmest month *at least* since the Medieval Warm Period. And, even Judith Curry favorably cited reconstructed past global temperature showing what we have now being warm enough and sustained enough to exceed the peak few decades of the Medieval Warm Period.
And why was wheat farmable in Greenland during the MWP and not yet now? Past warm periods were more dependent on polar warming by solar radiation than the modern manmade one is, and polar amplification (especially in and near the Arctic) was a big thing then as well as now.
‘Solidly reliable’? Hmm….first time for everything perhaps. So… why did the BBC exaggerate the figures?
https://www.youtube.com/watch?v=EYSLttmmbjE
And how was there snow in Aus, on Mount Washington, South Africa and New Zealand; and floods in the Crimea; and the coldest August I can remember in 30 years preceded by a cool July in central France; and the coldest since 2017 in Antarctica; and some of the coldest temperatures ever recorded in Siberia? And the UK suffering yet another drenching when I awoke this morning?
Roll on the heat – I’m perishing.
https://snowbrains.com/mt-hutt-new-zealand-finally-gets-big-snow-dump/
https://www.bbc.com/news/world-africa-66155057
https://www.capetownetc.com/news/more-snow-and-disruptive-rain/
https://www.hmn.ru/index.php?index=1&ts=230727112152
https://archive.ph/8tzUU#selection-1024.0-1026.0
meteovovosti.ru
https://www.weatherzone.com.au/news/concordia-antarctica-hits-82-9c-world-s-provisional-lowest-temperature-since-2017/
Once again, rusty nail can’t be bothered to actually support his wild claims. Ridicule and snark is all he can manage.
Here’s one of the things about those of us at WUWT, we are allowed to have our own idea, our own theories and to promote and defend those theories. Unlike the places you prefer where everybody is required to support the master narrative or risk being exiled.
And once again, in order to give yourself a target that is weak enough for your feeble intellect to handle, you have to lie about what others have been saying.
Nobody was saying that the warmth of July wasn’t happening. What we ridiculed was the absurd claims that it was the warmest July ever.
BTW, I notice you don’t even try to refute the claims regarding the Tonga eruption. We both know why, it’s because you can’t.
Don’t you feel compassion for the strawman you just blew into pieces? It will be fun to see the rusty nail try to rebuild it!
Oh, I’m just in pieces, Jim….
Ridicule and snark does creep in, from time to time, for which I apologise.
They certainly were. It was excuse after excuse. Some utterly ridiculous.
But Roy Spencer just said it was the warmest July, according to his satellite data set (since 1979). The global surface temperature producers have all indicated the same thing (going back to 1850, in some cases).
Not only that, but since July is the warmest month globally (not just in the northern hemisphere), it means July 2023 was indeed the warmest month ever recorded by instruments. Roy Spencer of UAH accepts and admits this in his recent update.
Why do you find that absurd?
Story tip:
“”UK offshore wind at ‘tipping point’ as funding crisis threatens industry
Industry figures warn climate crisis goals cannot be met unless government pumps more money into renewables””
https://www.theguardian.com/environment/2023/aug/05/uk-offshore-wind-at-tipping-point-as-funding-crisis-threatens-industry
I could quote St. Bob of Geldof…. but I won’t
Finally, a tipping point I can agree with.
The chart “A ML.Sv5 Global stratospheric water vapour mass” chart shows global water vapour increases immediately after the Honga-Tonga eruption in Jan 2022. Why did it take 18 months for this water vapor to cause a noticable increase in global temperature and how long will it continue to significantly effect global temperatures?
See Phil’s comment elsewhere. I think he’s on to something – cooling SO2 aerosols have an average life in the stratosphere of 18 months. We don’t yet have a number for how long warming H2O lasts at those heights.
Interesting…thanks.
It’s likely the final years of La Nina would have been much colder without something going on. I think H-T may very well have been that something. It wasn’t “noticeable” because we were starting from a low point.
Excellent data point!
If borne out over the longer term (i.e., that required for the step-change in tropospheric water vapor content to asymptote back to normal), it is nature clearly “demonstrating” in the natural atmosphere that water vapor is in fact the predominate “greenhouse gas” that affects lower troposphere temperatures.
Supporting what the above article states, independent of the Hunga-Tonga volcano disturbance, water vapor is by far the strongest of all greenhouse gases in Earth’s atmosphere due to:
(a) its normal orders-of-magnitude higher ppm concentration levels, and
(b) the fact that it has extraordinarily wide absorption bands in the LWIR spectrum, many of which overlap those of CO2.
Thank you, Hunga-Tonga volcano, for showing that atmospheric CO2 levels are a bit player in “global warming” compared to water vapor.
Oh, and we haven’t even discussed a likely increase in clouds (and their potential of positive feedback to increase LT warming) due to the volcano’s injection of both water/water vapor and cloud condensation nuclei into Earth’s atmosphere.
c) It can change phase at atmospheric temperatures, and absorb and release latent heat.
True . . . but neither liquid water nor solid ice qualify as a greenhouse gas.
But if we are talking about energy transfer, it is very important
From the article: “Readers may recall that we have reported on the massive amount of water vapor that has been injected into the stratosphere by the 2022 eruption of the Hunga-Tonga volcano. A recent study said a 13% increase in stratospheric water mass and a 5-fold increase of stratospheric aerosol load.”
So we have a five-fold increase in stratospheric aerosol load, and the temperatures warm up.
Now, according to some, aerosols in the Earth’s stratosphere will cause cooling, and we know that aerosols from the eruption of the Pinatubo volcano caused temperatures to cool by about a degree or more for a couple of years, yet here we have a five-fold increase but instead of cooling, we have warming.
So what’s going on with the aerosols?
Why did it take 11 months to produce the warming effect?
It’s 19 months since the eruption.
About a two year lag on ocean seismic activity vs UAH. !
It is easy for someone to find one or another index of undersea geologic activity that has significant positive correlation with UAH v6 TLT. Just like the US autism diagnosis rate has good correlation with US organic food sales.
Thing is, that the person used it to predict the 2015/16 El Nino.
And there are very good reasons why seismic event could affect the weather.
Your comment is irrelevant.
Also, Antarctic sea ice was affected from the end of last year.
Same reason my kettle takes a measurable to boil water for a brew when I’m mulling over a problem?
Heating and cooling aren’t instantaneous.
BBC have been reporting high temperatures due to climate Armageddon all year so it hasn’t taken that long as far as I’m concerned
It takes time for anything injected in the atmosphere to be transported from the injection point to the rest of the world.
Whether that process would take 11 months, I don’t know. Does seem to be a bit long.
As I said elsewhere here, there is the matter of lack of warming for 13.5 months after the Hunga Tonga explosion, followed by warming making a noticeable uptick in the few following months. And, global temperature is maintaining fairly good correlation with a month or two behind ENSO indices.
Watch carefully DK, Rusty, and Nitpick Nick! I’m about to do what none of you are capable if doing.
I agree with the alarmist trolls that we don’t have a clear explanation for the long delay before effects suddenly became noticeable. I’m not saying Hungry Tonka Truck has had no effect, but if I have to go with BurlHenry and his SO2 master control knob I am not too comfortable with that.
Tom Abbott:
“So whats going on with the aerosols?”
Moisture from the Hunga-Tonga is settling out of the atmosphere, and on its way down, it is flushing out dimming industrial SO2 aerosols in the troposphere, causing temperatures to increase because of the less-polluted air. There has been a huge decrease in the amount of SO2 aerosols in the atmosphere since 2022, as shown by NASA/GMAO images. This one is for 2022.
Hmmm . . . there’s an awful lot of white to deep purple shading in that global map . . . that reflects an SO2 column “mass” of 0–0.5 e16 molecules/cm^2.
0.5e16 molecules/cm^2 is a bit less than 0.2 Dobson Units.
The average concentration of ozone in Earth’s atmosphere is about 300 Dobson Units, equivalent to a layer 3 millimeters (0.12 inches) thick—the height of 2 pennies stacked together—if all the ozone were compressed together at sea-level at a temperature of 0 deg-C.
However, “If all of the air in a vertical column that extends from the ground up to space were collected and squeezed together at a temperature of 0 degrees Celsius and a pressure of 1 atmosphere, that column would be 8 kilometers thick (or about 5 miles). Compare that to the 3 millimeters described above, and you may realize just how tenuous is the Earth’s ozone layer.”
— ref: https://ozonewatch.gsfc.nasa.gov/facts/dobson_SH.html
Looking at SO2 versus ozone in terms of DUs: SO2 is a bit player in climate forcing.
You may be on to something, Burl.
Yep . . . perhaps by intentionally misrepresenting what data plots show?
See discussions below.
ToldYouSo
How am I misrepresenting anything?
I am only showing available data If you have an issue with the data,contact NASA/GMAO. I am sure that they will be happy to hear from you
“The color coding scale for the 2023 and 2020 images is essentially identical, showing a huge decrease in atmospheric SO2 aerosol levels.” — BurlHenry, posted August 5, 2023 7:30 pm
The color coding scale, especially with respect to the white and shades-of-purple color coding ranges of SO2 they represent, in your posted Earth-coverage map graphics are NOWHERE near the same, as I pointed out in my post of August 6, 2023 6:49 am.
That you have refused to acknowledge this, but instead obfuscated this fact by deflecting discussion to the total scale range, per your comment:
“The color coding scale is the colored bar at the bottom. For the 2023 image it spans 0 to 10. For the 2020 image, the span is.01 to 12. Almost identical.”
has cause me to conclude that you are intentionally misrepresenting data. Show me to be wrong.
Finally, it is you that presented the graphics . . . why did you present the 2020 graphic with a white-purple color coding so different from that of the previous two graphics if not to support your absurd claim of “showing a huge decrease in atmospheric SO2 aerosol levels” from 2020 to 2022-2023?
QED.
ToldYouSo:
The 2020 graphic was one that I had downloaded on Jan 21, 2020.
I wanted one for 2020, and used it, not having any other at that time.
Since the images are archived, I revisited Jan 1, 2020, and it is shown below: I have no idea why they differ, perhaps they tweaked their algorithm to make it less sensitive to lower levels of SO2. This one has the same color scale as the others, and it does show more SO2 in 2020 than in 2022 or 2023.
Tom Abbott:
This is the SO2 image for June 30, 2023
Tom Abbott:
This is the SO2 image for Jan, 2020
But at a completely different color-coding scale than the previous two posting of similar SO2 images.
ToldYouSo:
The color coding scale for the 2023 and 2020 images is essentially identical, showing a huge decrease in atmospheric SO2 aerosol levels.
One is linear, one is log.
Need to be same to compare properly.
bnice2000:
“One is linear, one is log”
You lost me. How do you come to that conclusion?
How do you come to that conclusion.
I looked at the colour scales along the bottom. !
The last graph may not be log, but it certainly is not linear.
Some sort of hodge-podge scaling actually
… look at the 8 and 12 at the end.
Yes , I was wrong about the third chart being log. (I just looked at the 8 and 12 at the end)
It’s something else.. it’s just a nonsense scale
The gap between 0.01 and .35 is the same as between .35 and .85….. so not to scale
Then goes by steps of .5 up to 4.85, then goes wonky again to 8 and 12.
Really?
As anyone can see (except those that may unfortunately be color blind), your posted graph for 2023 has:
— white shading indicating about 0.0-0.2 e16 molecules/cm^2 of SO2
— purple shading indicating about 0.2-0.4 e16 molecules/cm^2 of SO2
whereas your posted graph for 2020 has:
— white shading indicating about 0.0-0.01 (yes, 0.01) e16 molecules/cm^2 of SO2
— purple shading indicating about 0.01-0.35 e16 molecules/cm^2 of SO2.
As my old college professor would have said: “Hell, son, that ain’t even close to being true!”
ToldYouSo
The color coding scale is the colored bar at the bottom. For the 2023 image it spans 0 to 10. For the 2020 image, the span is.01 to 12. Almost identical.
For SO2 aerosols, their concentration in the atmosphere is meaningless. They are a thin haze of micron-sized Sulfuric Acid droplets which reflects the incoming solar radiation away, and cools the Earth.
White areas represent areas with few or no SO2 aerosols present, so there, the full intensity of the solar radiation strikes the Earth’s surface, and temperatures rise.
You seem to have missed my statements about the different scales for the white coloration and for the purple shading that are predominate in both the 2023 and the 2020 graphs. The total span of coloration in the legend is thus meaningless in context.
Try again.
ToldYouSo:
The 2023 and the 2020 images are measuring the same column mass of SO2 in the atmosphere, 10 to the 18 molecules per square cm. How they convert those measurements into colors is
really irrelevant. The 2023 image clearly shows a LARGE decrease in the column mass of SO2 in the atmosphere.
No wonder that it is warming, there is far less SO2 aerosol pollution in the atmosphere, probably having been flushed out by the descending moisture from the Hunga-Tonga eruption.
Hopeless . . . I give up.
Burl,
in 2020, the middle of the yellow shading is right at ‘3’;
in 2023, please tell me what quantity represents the middle of the yellow shading.
Don M:
Not much yellow on the maps to compare with the color bars, but a careful examination with increased lighting and magnification shows that the column masses for the yellows are essentially identical.
I see the 2023 as a ‘4’ … not essentially identical … starts out as 33% greater.
I just use the yellow as example. Problems with other color scheme as well … but more pronounced.
(So, you are telling me that you don’t see 2023 yellow as a 4 quantity?)
Dan M:
No, I see it as about 3.75, a bit of green in it.
Aerosols cool, water warms.
How strongly aerosols impact the climate depends on the type of aerosols injected, the amount, where they were injected from and the height they were projected to.
How much impact water vapor has depends on how much was injected, where it was injected from and how high it was projected to.
Whether the warming or cooling would predominate depends on balancing all of these factors.
One needs to be very careful when making blanket statements. To wit:
“Aerosol particles also shape the climate as they circulate in the atmosphere. Some of these particles can reflect sunlight, helping to cool the atmosphere. Other aerosol particles absorb heat from sunlight. This causes the atmosphere to warm.“
— https://www.energy.gov/science/doe-explainsclouds-and-aerosols
(my bold emphasis added)
Poor old water.
It has to be, simultaneously:
…… substance there ever was. Or could ever be.
I asked, a while ago, if anyone if anyone fancied building their own Green House Earth model
From very first principles, the most simple Earth you could ever imagine on just a single sheet in Excel
In case you forgot….
Start at solar noon on the Equator and consider a (say 5° wide) strip of latitude from East to West
Having calculated figures for Temp and TempхArea, move up in latitude to the next strip and repeat
BUT remember especially, for each strip away from the Equator, the effective solar constant will decrease as the cosine of the latitude
Keep going till you reach the pole (or 85° if you did it in 5° steps)
I get a temperature of 10.5°C
Play with Albedo (simply put some mud, algae, seaweed etc in the water)
If Albedo was 0.03, you get a temp of 12.7°C
Lower the Emissivity just a touch to 0.92 an you get 15.0°C
All that is without any atmosphere.
Just look out of your window, – everything the atmosphere does (evaporation and convection) are devices that cool the surface
The Green House Gas Effect is fantastical contrived nonsense.
Earth does not need it to be at the temperature it is and anyone (familiar with Excel) can prove it
Back to where I started and ‘water’
Why it works is because water stores heat energy.
Now, where inside the usual explanation of the GHGE is that taken account of?
Any closer to understanding why, during a continuous stream of rain, I was watering the trees in my garden?
(Using free water off my house/garage roof. And solar power to pump it – even during the rain!!!)
“”The most misunderstood
The most ‘taken for granted’
…… substance there ever was. “”
Indeed
“”Mum dies from water toxicity after drinking nearly 2 litres in 20 minutes””
https://metro.co.uk/2023/08/04/mum-dies-after-drinking-nearly-2-litres-of-water-in-20-minutes-19266058/
Another X File
died from lack of salts, manifested by quick dilution with water.
“The Green House Gas Effect is fantastical contrived nonsense” !!
Particularly as greenhouses do not work that way anyway!
CO2 is a gas that add to greenhouses to promote more vigorous plant growth. 🙂
Perhaps you should consider that a significant proportion of the surface will be ice?
Regardless of what you think about the greenhouse effect, there is a band of added water vapor 30 – 50 miles up in the shape of a sphere reflecting heat back to the surface in a parabolic trajectory, what would you call that process?
The operative word here is “reflecting”. That reflection can never be 100%. Meaning it will see an exponential decay over time. IR *is* radiation. As such it sees an inverse square law reduction over distance. The heat reflected, even at 100% reflection, will see an inverse square law reduction by the time it reaches the Earth. That somehow never seems to be considered when discussing the “greenhouse effect”.
Stratospheric water vapor affecting atmospheric circulation
https://www.nature.com/articles/s41467-023-39559-2
Aug 17, 2021
Studying Earth’s Stratospheric Water Vapor
https://www.nasa.gov/feature/langley/studying-earth-s-stratospheric-water-vapor
Ignore the first 2 lines: Open Access and Published: 03 July 2023 above
Apparently the sun is doing its bit as well
https://link.aps.org/doi/10.1103/PhysRevLett.131.051201
I saw an article about that earlier. The Sun is apparently putting out more gamma rays than expectd. To what effect, we don’t yet know.
Thought I would put more data meat on these bones. Roy Spencer’s blog posts the UAH satellite based monthly anomalies for several atmospheric depths.. What he posts here is the lower troposphere (showing hot 7/23). What henposts there includes in tabular form the lower stratosphere.
Hunga Tonka erupted 1/22.
So I went and got the USH lower stratosphere month before and month after anomalies for the globe. 12/21 was -0.15. 2/22 was +0.04. Hunga Tonka!
The sequence continues, from Feb
0.04 -0.07 -0.25 -0.22 -0.31 -0.39 -0.40…
Not so convincing
After dinner and reading more comments, thought would add a big caveat. The pre/ post Hunga anomaly does NOT explain the July 23 heat because of the delay, most likely explained by other factors. What Roy’s data showed is that there was an immediate lower stratosphere warming effect from the water injection.
Rud Istvan:
For a VEI4 volcanic eruption, it takes, on average, 16 months for its SO2 aerosols to begin settling out of the stratosphere.
Moisture from the Hunga-Tonga eruption may have had a similar delay of about 18 months before it began settling out.
Most volcanic eruptions result in the formation of an El Nino, because its descending SO2 aerosols coalesce with industrial SO2 emissions in the troposphere, and flush them out, resulting in less polluted, cleaner air, and temperatures rise to form an El Nino.
It appears that the descending moisture from the Hunga-Tonga eruption has had the same effect, efficiently flushing out SO2 aerosols (and smoke?) in the troposphere, and causing temperatures to rise.
The Hunga Tonga volcano exploded on January 15th 2022. Ryan Maue’s graph of 2-meter temperature according to JRA shows lack of warming trend through February 2023. Then in March 2023, there was a short term spike a little taller than the one of April 2022, then global temperature went most of the way back down. A little warming trend started in March 2023. This warming trend got going more in May 2023, although the spike around the beginning of July 2023 looks like a short term spike above this warming trend.
Global temperature made a sharp upward turn in a matter of about 3 months, with this 3 month period starting almost 14 months after the Hunga Tonga explosion.
As for UAH v6 TLT: For the past roughly 3.5 years from late 2020 to June 2023 is the recent triple dip La Nina causing a cooling trend with dips in early 2021, early 2022 and early 2023, and May & June 2023 having warmed up to merely just below the bulk of the warmer readings of 2020. July 2023 looks like it’s probably a short term spike, a little smaller than the one of January 2013 and the great spike of December 1987.
So, I think the Hunga Tonga explosion is not a major factor here, especially considering that a 13% increase of stratospheric water vapor is tiny compared to the amount of water vapor in the part of the troposphere above the 500 millibar level. I think this is mainly recovering from the recent triple dip La Nina with a bit of influence from the beginning of the current El Nino, and late June & July 2023 had a major short term spike.
Many thanks for the post about the aftereffects of the Hunga Tonga eruption, Anthony.
Side note: Whenever I read the name Hunga Tonga, I’m reminded of the opening chant to the song “Hooked on a Feeling” by Blue Swede.
https://www.youtube.com/watch?v=Bo-qweh7nbQ
Regards,
Bob
“it stands to reason that the dramatic increase in stratospheric water vapor is having an effect on global temperature”
Well, you need to do some quantification. The increase in wv in the graph is about 200 teragrams. A teragram is a megaton. We put about 38000 Mt of CO2 into the atmosphere every year. wv is a somewhat stronger IR absorber, but not that much.
“Not that much”
Would you like that engraved on your headstone?
https://www.geocraft.com/WVFossils/greenhouse_data.html
“We put about 38000 Mt of CO2 into the atmosphere every year”
And nature puts in many times more than that… and takes the same or more back out… each year.
This water vapour got injected straight into the stratosphere..
Doesn’t happen with our CO2 emission.
Our CO2 emissions are mostly at the bottom of the troposphere and are used by plant life to the benefit of the whole planet.
They also have no measurable effect on climate.
Two problems, the first is that CO2 is already pretty close to being saturated in the atmosphere. Each additional unit of CO2 has less and less impact.
The second is that most of the wavelengths the CO2 absorbs are also absorbed by WV. While there are a number of wavelengths that are absorbed by WV that are not absorbed by CO2.
These two things combined show that additional WV will have more of an impact than does additional CO2.
Although the 200 Mtons is a moderate proportional rise in the very dry stratosphere, the total mass of wv in the air is 1250000 Mtons. So it has a tiny extra effect within those wave bands. Whereas we have added about 40% of CO2.
Nick doesn’t think that the Stratosphere is different from the Troposphere.
He is just making up nonsense to suit his sick ideology.
NO, we have not added about 40% of CO2… nearly all of the 3% human part of all CO2 emissions is absorbed/used each year as part of the continuous Carbon Cycle.
CO2 is what provides for ALL LIFE ON EARTH
It is not pollution, it is the GAS OF LIFE, and there is no evidence it produces any measurable warming.
The 3% figure is dependent on being part of each year’s seasonal sources & seasonal sinks. Whole-year figures tell a very different story with good track record of annual repetition, with annual atmospheric CO2 gain being about half of annual manmade emissions, and the other half being absorbed by nature, especially the ocean. Although, what the ocean absorbs is not so much half of each year’s annual manmade emissions, but closer to (more accurately mostly beyond a decade in time scale) 5% of each year of every decade of manmade emissions.
The source and sink fluxes are proportional to the percentage or partial pressures of the different original sources of CO2. The fact that the annual anthropogenic CO2 emissions is about twice the annual increase of CO2 in the atmosphere is just coincidence. The seasonal draw-down phase can’t keep up with 1) increasing biomass resulting from increasing CO2, 2) increasing out-gassing from the oceans from increasing temperature, 3) increasing respiration from boreal tree roots adjacent to an Arctic that is acknowledged to be warming 2-3X faster than the rest of the world, and 4) increasing methane and CO2 emissions from melting permafrost.
The seasonal ramp-up phase is driven primarily by low temperature limiting bacterial and fungal activity, but goes on all year. Whereas, the draw-down phase is driven by active photosynthesis and is limited by both temperature and available sunlight, limiting it to 4 or 5 months. Thus, as the Earth warms, there is a lag in reaching equilibrium because the two seasonal phases are asymmetrical, and we are seeing an increase currently.
“and the other half being absorbed by nature, especially the ocean. “
So… you are saying that only half the total amounted CO2 emitted is reabsorbed each year….
… or are you saying that the sinks know what molecules were human CO2 and what weren’t?
There is the matter that the sublinear effect of CO2 (as well as of greenhouse gases in general) is well known. The “official figure” for CO2 is 3.7 W/m^2 forcing per 2x change of CO2. Even Chris Moncton, as an author of WUWT articles, cited favorably a study that indicated only about 10% less.
There really isn’t an “official” figure. The 3.7 W/m2 figure comes from Myhre et al. 1998. Newer estimates like those from the RRTM are closer to 4.0 W/m2.
Which are in error, because they basically treat radiation as the only energy transfer in the atmosphere…
.. which even you must know is preposterous.
Models, models, models.. !.
“Sherwood and the team stress that their results are very sensitive to the altitude at which water vapour is emitted, and don’t apply to aircraft water vapour emissions – these have a much higher global warming potential.
“If all our irrigation water went into the altitudes where aircraft fly, it would probably have a pretty big warming effect, …”
https://physicsworld.com/a/are-our-water-vapour-emissions-warming-the-climate/
As long as CO2 is well mixed, it has no warming effect above 100 ppm. This water vapor is not well mixed and placed where it has the most significant warming effect.
Do you ever tell the truth about anything?
Would you like to quote what I said that you dispute?
“wv is a somewhat stronger IR absorber, but not that much” FAIL
Where is the supporting evidence for this?
The extra 13% water in the stratosphere lingers on.
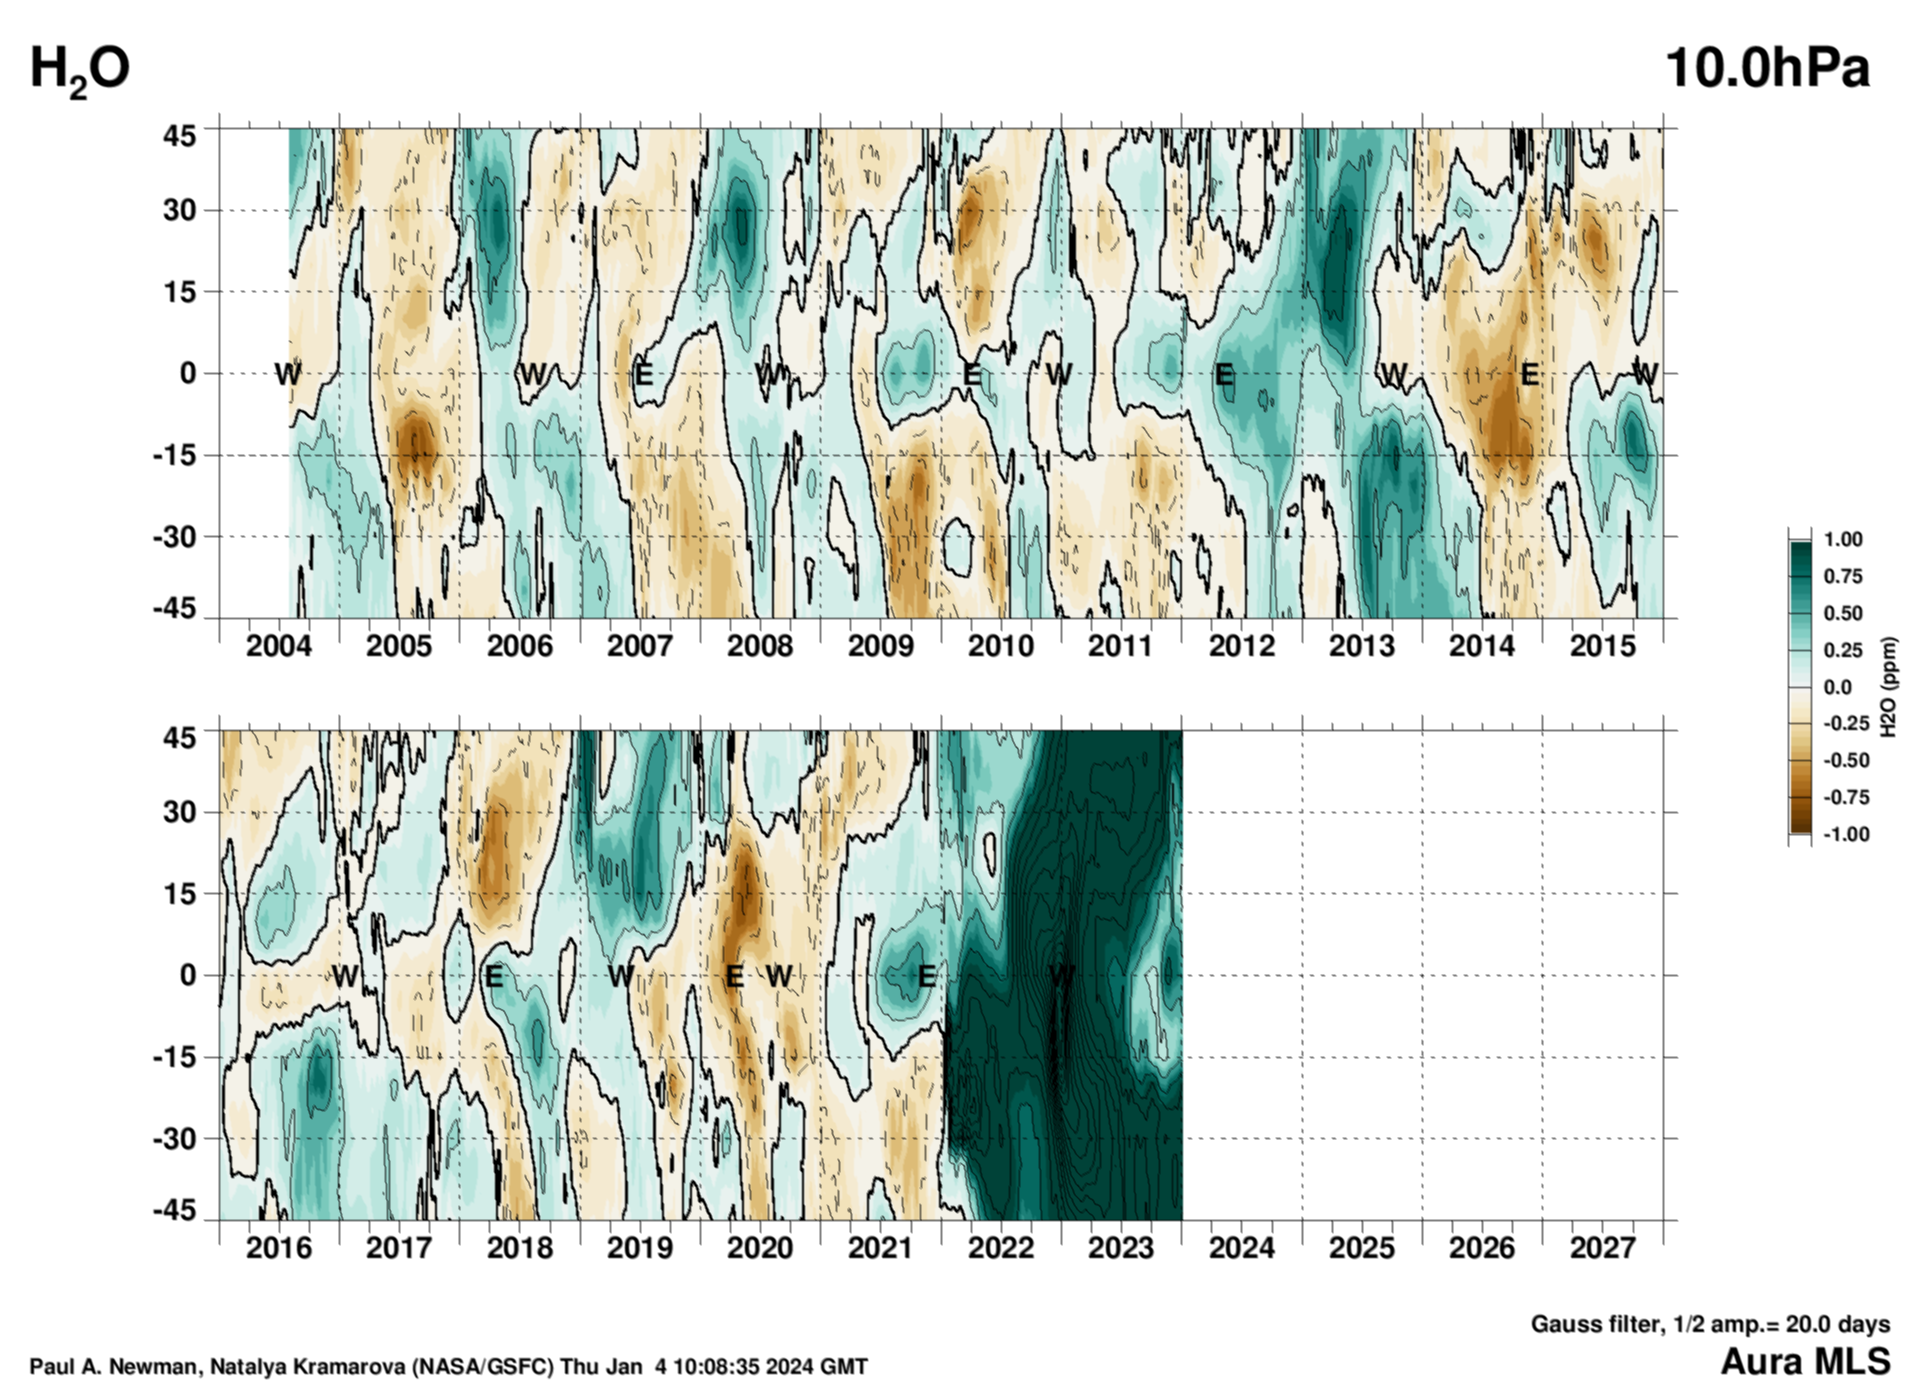
Water (H2O) versus pressure at the equator from the NASA JPL Microwave Limb Sounder (MLS) on the NASA Aura satellite.
Volcanic eruptions, every year, put FAR more GHGs into the atmosphere than humans have in our entire existence. Last year’s Tonga blast added billions of tons of water vapor, the number 1 GHG, on top of billions of tons of every other GHG. When are leftards going to present their big plan for stopping volcanos?
The Hunga Tonga explosion was only claimed to increase stratospheric water vapor by 13%, without statement of what time perios this applies to. Furthermore, this is small compared to even the amount of water vapor in the subset of the troposphere that is above the 500 millibar level, and most of the water vapor in our atmosphere is below the 500 millibar level.
You apparently missed the quote above, directed to Stokes, that makes the point that the altitude of injection is very important. It matters not where “most of the water vapor” resides. The article by Anthony is about an unusual event that has injected a large amount of water where it is not usually found.
The height profile over the equator shows how the additional water rises up to where the ozone is. This process takes some time, and only in 2023 the Hunga water reaches the critical altitudes where the ozone layer resides.
The maximum concentration of the climate critical ozone layer is around 30-35 km altitude (around 2-3 hPa)
Interesting.
Are there UV readings over SH for the last several months available ?
JUST STOP
OILVOLCANOES!150 Mt of H2O is having an effect on global temperature?
A huge increase in the stratosphere.
Please try to keep up !
See my response to Nick.
If the injection of megatons of water vapor into the stratosphere has minimal effect, how can air travel emissions have any effect?
To the extent that Tonga increased the amount of water in the atmosphere, wouldn’t that extra water have increased relative humidity and as a result slowed down evaporation from the oceans surface. A decrease in evaporation would have led to an increase in the temperature of the oceans.
Oceanic evaporation depends on SURFACE RH. This is an increase in RH in the stratosphere (a miniscule one, maybe from “dry as mid-Sahara” to “dry as Morbid Valley”). Any addition to water vapor below ~30,000 feet rained out very quickly.
Now, if the hypothesized increase in surface temperature due to the stratospheric water vapor is correct – the event actually INCREASED the evaporation from the oceans.
(Edited to change one word, trying to lessen the burden of Charles. Only thing I can see that would trigger the idiot AI.)
Any time I’m feeling low, can’t make temperatures go … up, I just watch a YouTube video show: https://www.youtube.com/watch?v=S94Bh3Qez9o
Thanks, finally some science here, but it’s just ENSO, http://climexp.knmi.nl/data/inino34_daily_2022:2024.png
Starting at about 1’20”, listen and marvel at the words of Stuart Jenkins, currently defiling the academic standing of my alma mater. The most brilliantly circular argument ever.
GH gasses in the stratosphere cause cooling, and that much aerosol material is going to cause clouds, and that causes cooling. Perhaps there is some weird short term warming mechanism, but the long term forecast has to be cooling.
This whole warming/Hunga Tonga thing is pretty interesting because the Rim of Fire (the ring of volcanoes around the Pacific) – the volcanoes seem to erupt in batches as opposed to randomly.
If one, admittedly large, volcano really caused this effect – what would 3 or 5 or 10 do? Because that’s the kind of activity that occurs during an active Rim of Fire decade.
‘<i>Water vapor is by far the strongest greenhouse gas according to NASA, and it stands to reason that the dramatic increase in stratospheric water vapor is having an effect on global temperature.</i>’
I thought that when alarmists claim that a rise in CO2 levels would cause a rise in temps, it was safe to ignore as the absorption bands are pretty much saturated and little more warming is possible. Is this not true of water vapour too, and if so, how can this be responsible for the warming?
The bands for water vapor are nowhere near saturated. The saturation also varies wildly from place to place, because water vapor is a CONDENSING GHG. CO2 is not (at Earthly temperatures and pressure).
There is missing context for the supposed jra-55 warming via the Hunga-Tonga volcano, and Dr. Maue should have caught this himself. The recent 2023 jra-55 2m warming is a similar response to El Niño conditions that occurred in 2016:
Both happened after high solar activity drove up tropical and global ocean temperatures.
I see very little reason to beat this dead horse any more, the volcano didn’t cause any warming.
It was seawater that was injected into the stratosphere. Loaded with sodium chloride. What effects this will spawn is a crap-shoot, given the un-appreciation of this fact.
Since the IPCC models depend on the water vapor recirculation model, isn’t anyone denying the current effect on global temperatures of the Hunga eruption also denying the validity of the IPCC models?
The Tongan eruption has caused a small temporary blip in global temperature but it caused a great deal of rainfall in New Zealand which caused a massive flood in Hawkes Bay and destruction in many other locations .
It took a year from the eruption but our rainfall has now exceeded our yearly total in most districts in New Zealand.
New Zealand is in the path of many tropical cyclones that transport water vapour and heat to Antarctica and for the record Hawkes Bay had more rainfall in 1938 than 2023.
A private weather forecaster (Phill Duncan ) who is a very good weatherman ,stated recently that there was not enough water from the eruption , to make a difference .
I think he got this wrong this time.
187 billion tonnes of extra water must ,and did make a a big difference to New Zealands weather .
.
Who supports this statement?
“Water vapor is Earth’s most abundant greenhouse gas. It’s responsible for about half of Earth’s greenhouse effect — the process that occurs when gases in Earth’s atmosphere trap the Sun’s heat.”
And “traps heat”, that’s cute.
So Hunga Tonga erupted in Jan 2022, and all that water vapor did very little until magically in March 2023 it decides to become active and warm up the earth? Doesn’t seem like a good argument. What happened in March 2023 to cause water vapor from the eruption to decide to become active?
It takes awhile for the plume to disperse globally. It would be nice if we had the data analyzed to track local and regional temperature changes that would show the dispersion.
It doesn’t just stick around in one spot, then disperse globally 14 months later. The effect of the eruption is estimated to be 0.03 C for 5 years or so. So it’s worth discussing, but it’s not rational to imagine that this eruption caused an abrupt change 14 months later.
It started in the Southern Hemisphere last year, Antarctic sea ice set a record low. It is in the process of setting a record low again this year.
Antarctic sea ice set record lows in 2022 and again in 2023; that didn’t cause a sudden increase in temperatures in March 2023.
scottjsimmons
I have done an analysis of all El Ninos between 1950 and 2020, and found that EVERY one was due to a decrease in global atmospheric SO2 aerosol levels, primarily in the aftermath of a volcanic eruption, and on average, 16 months after the date of the eruption, when the volcanic SO2 aerosols begin settling out of the atmosphere, usually causing an El Nino because of the less polluted air.
I would therefore expect that our 2023 El Nino would also be due to a decrease in atmospheric SO2 aerosol levels, this time because the moisture from the Hunga-Tonga began to settle out, in Feb-March of this year (14-15 months after the eruption), flushing out SO2 aerosol pollution in the atmosphere, and causing temperatures to rise.
Fortunately, they will eventually be replenished by Chinese industrial SO2 aerosol emissions, so we can expect the El Nino to end, probably later this year.
Forgive me for not believing you. Do your analysis and publish it in a respectable journal, and I promise I’ll take it seriously. The fact remains that we’ve had large El Ninos before, but none of them followed 14-16 months after an eruption like Hunga Tonga. That eruption was unique in that it was just the right depth to put large quantities of water vapor into the stratosphere. And people think this water vapor did nothing and then magically decided to rapidly warm the planet.
Most volcanic eruptions cause cooling for a couple years. The uniqueness of this eruption bucks that trend by causing a little warming – kind of a nail in the coffin of your observations, if you ask me. Still it’s about 0.03 C and certainly not responsible for a huge chunk of the record breaking heat the globe has seen this year.
scottjsimmons
“We’ve had large El Ninos before”
Both the large 1997-8 and 2014-16 El Ninos were caused by large decreases in atmospheric SO2 aerosol levels, due to “Clean Air” efforts (i.e., man-made).
Not something that you can compare Hunga-Tonga to.
How do explain the sudden large increase in temperatures about 15 months after the eruption? If the Hunga-Tonga moisture did not cause temperatures to decrease for that period of time, why would it have any effect when the moisture rained out?
The only possible explanation is that, in raining out, it flushed out SO2 aerosol pollution from the troposphere, cleansing the air, and causing temperatures to rise.
(The July warming spike was about 0.36 deg. C.,not 0.03 deg C, as you say)
What I said is that Hunga-Tonga is likely responsible for 0.03 C, which means it doesn’t explain much of the July 2023 spike. New studies may come up with different estimates of the impact of Hunga-Tonga, but right now that’s what has been estimated.
And as you point out Hunga-Tonga is not comparable to previous eruptions, which was also my point. Please see what I wrote.
I have been pleasantly surprised at how little sunburn I experienced this summer, though I was out in bright sun for longer than I ought to have been on a couple of occasions. Perhaps the extra atmospheric water vapor provided added protection?
Now temperatures will not rise. Heat is escaping quickly from the Pacific Ocean.
http://www.bom.gov.au/archive/oceanography/ocean_anals/IDYOC006/IDYOC006.202308.gif
http://www.bom.gov.au/archive/oceanography/ocean_anals/IDYOC007/IDYOC007.202308.gif
Stronger solar wind accelerate the jet stream in the north, which becomes latitudinal.


The analogy happens in the southern Pacific.
Radiative transfer modelling shows that if we can get more water vapour into the atmoshere, the temperature will rise. CO2 is at its limit. https://www.youtube.com/watch?v=8-zaQWAaPAg
Most of the water in the atmosphere is now concentrated in the western Pacific. The typhoon sends water vapor into the stratosphere and lowers ocean temperatures.
https://earth.nullschool.net/#2023/08/08/0700Z/wind/surface/level/overlay=total_precipitable_water/orthographic=-186.61,14.83,372/loc=130.987,29.535
https://earth.nullschool.net/#2023/08/05/0000Z/ocean/primary/waves/overlay=sea_surface_temp_anomaly/orthographic=-240.33,21.46,1128
This shows that the water that reaches the tropopause cools the surface. The same thing happens in winter in high latitudes.
Water vapor that reaches the tropopause in the tropics cools to the average temperature in the tropics (about -80 C). The temperature in the stratosphere depends only on radiation below -242 nm, which triggers the photochemical Chapman reaction. Therefore, the temperature in the stratosphere rises from above and not from below. Invariably, the lowest temperature is detected in the tropopause. Changes may be local and do not affect the average.
http://www.cchem.berkeley.edu/molsim/teaching/fall2008/ozone/Ozone%20website_files/Page603.htm
Let’s look at typhoon temperatures in the Philippine Sea. You can see that the cloud tops are radiating at -80 C.

The problem is that the temperatures of the surface, troposphere and lower stratosphere are mixed in the satellite era. These temperatures vary according to the amount of water vapor and ozone which is evident during La Niña and El Niño, as well as in winter temperatures over the Arctic Circle.
If a satellite detects high infrared radiation in an area where there is a stationary high, is it troposphere or surface radiation?
“If a satellite detects high infrared radiation in an area where there is a stationary high, is it troposphere or surface radiation?”
Exactly.
The satellite measures O2. There is probably little O2 in the surface.
Can the average surface temperature increase without surface air pressure increasing (holding insolation constant) ? The idea that without CO2 the Earth would be significantly cooler makes no sense to me as CO2 is just . 06% of atmospheric mass. If insolation is held constant. A decrease of . 06% of atmospheric mass would have little impact on surface pressure. How do you get a big decrease in temperature?
pv = nrT. The volume of the atmosphere can go up, i.e. expansion, as well as pressure.
Of course, but holding insolation constant (v???) how does such a small change in mass lead to a change in P or V.
Insolation has to do with radiation from the sun, not volume. Typically, gravity is the only force restricting how far the atmosphere can expand.