by Javier Vinós & Andy May
“On the other hand, I think I can safely say that nobody understands climate change.”
J. Vinós, paraphrasing Richard Feynman’s words about quantum mechanics.
For those that prefer it, Christian Freuer has translated this post into German here.
6.1 Introduction
7.1 Introduction
This unplanned plain-language summary has been written at the request of some readers of our series of articles on the Winter Gatekeeper hypothesis:
- (I) The search for a solar signal
- (II) Solar activity unexplained/ignored effects on climate
- (III) Meridional transport
- (IV) The climate shift of 1997
- (V) A role for the sun in climate change
- (VI) Meridional transport as the main climate change driver
Climate is extremely complex, and people, including scientists, have a natural tendency to look for simple explanations. The Occam’s Razor principle is a good first approach, but climate change cannot have a simple answer. Over the past seven years, one of the authors of this series (JV) has been laboriously reading many thousands of scientific articles and analyzing hundreds of climate datasets trying to understand how Earth’s climate changes naturally. This is a first step to understanding the human impact on climate change. The outcome of this work is the book “Climate of the Past, Present and Future.” It is a graduate-student level academic book that discusses many controversial issues about natural climate change over the past 800,000 years. In this book, a new hypothesis on natural climate change is presented. It relates changes in the strength of the meridional (poleward) transport of energy with climatic changes that have taken place, both in the past and recently.
Since meridional transport is most variable during the winter of the Northern Hemisphere, and is modulated by solar activity, we named the concept the Winter Gatekeeper hypothesis. The other author of the series (AM) is a writer of several published climate books, they are: “Climate Catastrophe! Science or Science Fiction?,” “Politics and Climate Change: A History,” and “The Great Climate Change Debate: Karoly v Happer.” We joined forces to explain this new hypothesis through this series and a new book we are co-writing that will be tailored toward a more general audience. An audience interested in climate change but not in its complex scientific details. The hypothesis grew out of an investigation into the effect of solar variability on climate. But solar variability turned out to be only part of natural climate change. As the scientific evidence for the hypothesis was presented in the first six parts of the series, this summary will present only the conclusions, some additional supporting evidence, and answer a few interesting questions and comments from readers.
7.2 A synopsis of the Winter Gatekeeper hypothesis
The IPCC assessment reports published since 1990, reflect a scientific consensus that natural forces, including solar activity and ocean-atmosphere oscillations, like the Atlantic and Pacific multidecadal oscillations, had a net zero effect on the observed global average surface temperature changes since 1951. The IPCC consensus does not believe changes in the poleward (meridional) transport of energy have significantly affected this average temperature over the past 75 years.
The Winter Gatekeeper hypothesis proposes that changes in the meridional transport of energy and moisture are the main way the climate changes now and in the past. Meridional transport variability has many causes and forces that act simultaneously and in different time frames on the climate system. They integrate into a very complex poleward energy transportation system. Among these are multidecadal ocean-atmosphere oscillations, solar variability, ozone, stratospheric-reaching tropical volcanic eruptions, orbital changes, and changing luni-solar gravitational pull. Meridional transport is therefore an integrator of internal and external signals. It is not the only way the climate changes, but evidence suggests it is the main one.
The Winter Gatekeeper hypothesis does not disprove greenhouse gas effect induced climate change—manmade or otherwise—in fact, it acts through it. But it does not require changes in the atmospheric content of non-condensing greenhouse gases to cause significant climate change. Therefore, it does refute the hypothesis that CO2 is the main climate change control knob.
Meridional transport moves energy that is already in the climate system toward its exit point at the top of the atmosphere at a higher latitude. It is carried out mainly by the atmosphere, in both the stratosphere and troposphere, with an important oceanic contribution. The greenhouse effect is not homogeneous over the planet due to the unequal distribution of water vapor, and it is stronger in the wet tropics, weaker over deserts, and much weaker at the poles in winter. When meridional transport is stronger, more energy reaches the poles. There it can more efficiently exit the climate system, particularly during the winter, when there is no Sun in the sky. Most polar imported moisture in winter freezes, emitting its latent heat. Additional CO2 molecules increase outward radiation, as they are warmer than the surface. The net result is that all imported energy into the polar regions in winter exits the climate system at the top of the atmosphere (Peixoto & Oort, 1992, p. 363), and increasing the energy transported there at that time can only increase the loss.
When meridional transport is stronger, the planet loses more energy and cools down (or warms less) in a non-homogeneous way, because the net energy loss is greater in the polar regions. However, as more energy is directed toward the poles, the Arctic region warms, even as the rest of the world cools or warms more slowly. When meridional transport is weaker, less energy reaches the poles and exits the climate system. Then the planet loses less energy and warms, while the Arctic cools, because it receives less energy from the lower latitudes.
Most of the energy is transported through the lower troposphere and ocean track. As a result, changes in multidecadal ocean oscillations produce a greater effect on climate in the multidecadal timeframe than changes in solar activity. Solar changes have a stronger effect on stratospheric energy transport. Even so, there is a non-well defined link between changes in solar activity and changes in the multidecadal oscillations that result in major multidecadal climate shifts right after 11-year solar cycle minima (see Part IV). Nevertheless, modern global warming started c. 1850, when the Atlantic Multidecadal Oscillation increased its amplitude and period (Moore et al. 2017). The overall multidecadal oscillation (aka the stadium wave) currently has a period of c. 65 years, and the 20th century included two rising phases of the oscillation, explaining its two warming phases (1915-1945, and 1976-1997; Fig. 7.1).
Meridional transport was further reduced during the 20th century by the coincidence of the Modern Solar Maximum (Fig. 7.1): A long period of above average solar activity between 1935 and 2004. It is the longest such period in at least 600 years. Solar activity acts mainly on stratospheric energy transport, but since it affects the strength of the polar vortex and the El Niño/Southern Oscillation (see Part II), it also influences tropospheric transport.

In Fig. 7.1, the top panel shows solar activity. High solar activity weakens poleward energy transport causing warming. The bottom panel shows that the ascending half-period of the Atlantic Multidecadal Oscillation causes an even bigger reduction in energy transport and has a larger positive temperature effect. The middle panel is the temperature evolution for the past 120 years. It is consistent with the effect of these two factors on transport. The sunspot data is from SILSO, the temperature data shown is the HadCRUT4 deseasonalized temperature, and the AMO data, also deseasonalized, is from NOAA. It has been smoothed with a gaussian filter.
As can be seen in Fig. 7.1, most of the warming during the 20th century can be explained by the combined effect of the ocean multidecadal oscillations and the Modern Solar Maximum on meridional transport. No other proposed factor can satisfactorily explain the early 20th century warming period, the mid-20th century shallow cooling, and the late 20th century strong warming period, without resorting to ad-hoc explanations. In a single century two periods of reduced transport (warming), coincided with the ascent of the Atlantic Multidecadal Oscillation and the effect of the modern solar maximum. This resulted in 80 years of diminished transport that contributed to the greatest warming in 600 years, triggering political and scientific alarm.
7.3 Solar changes, transport changes, and climate shifts
The amount of energy transported poleward varies continuously, with major seasonal changes. However, at certain times the annual average atmospheric transport at high latitudes changes more rapidly over a period of a few years and settles into a different average strength. These abrupt changes in transport are mainly a winter phenomenon, and cause climate shifts on average every 25 years. Climate shifts were first identified in 1991 (Ebbesmeyer et al. 1991), yet they are not considered a cause for climate change in the IPCC reports, despite numerous studies suggesting they are. After each shift, the climate settles into a new regime.
It is known that one of these shifts took place in 1976 resulting in accelerated warming, and another one in 1997, resulting in decelerated warming (see Part IV). The four known shifts that took place in the 20th century happened soon after solar cycle minimums. The climate regimes, or meridional transport phases, disproportionally affect the Arctic climate in an opposite direction to the climate of the northern mid-latitudes. The accelerated warming from 1976-1997 was characterized by a quite stable Arctic climate, but the decelerated warming since 1997 has coincided with strong Arctic warming. Figure 7.2 shows how the sudden Arctic shift of 1997 was caused by an increase in meridional transport. The only energy that reaches the Arctic in winter is through transport, and the shift was accompanied by an abrupt increase in the amount of energy radiated to space.
According to IPCC theory, without a change in solar energy and/or a change in albedo (solar energy reflected by clouds and ice), a change in outgoing longwave energy could not happen, because energy out must match energy in. Yet without a significant change in either solar energy or albedo, a significant change in outgoing longwave energy occurred, as shown in Fig. 7.2.

Climate scientists contributing to the IPCC reports cannot blame the 1976 climate shift on changes in atmospheric greenhouse gases, so they suggested it was caused by a coincidental small reduction in anthropogenic sulfate aerosols. They set the sulphate cooling effect to a point that allowed increasing CO2 levels to overcome the previous cooling trend in 1976. As the 1997 shift cannot be explained in terms of anthropogenic factors, any data that shows that the shift occurred is ignored, and the focus is shifted to the increased Arctic warming.
Climate shifts undoubtedly represent changes in the meridional transport of energy. No theory can successfully explain climate change without accounting for abrupt or gradual changes in transport. The Winter Gatekeeper hypothesis has been developed to explain how climate has changed naturally for the past 50 million years and how it is changing now, integrating into a single interpretation tectonic, orbital, solar, oceanic, and atmospheric causes of climate change. It has tremendous explaining power, and many apparently unconnected phenomena can be linked through it. As an example, changes in wind speed and evaporation are discussed below. Many climate scientists will be able to reinterpret their results guided by this new energy transport view of climate change.
Particularly challenging was to find an explanation for all the previously unconnected evidence of a strong effect on climate from small changes in solar activity. This 220-year-old problem constituted the genesis of the hypothesis. The evidence that small changes in solar activity affect the meridional transport of energy is very solid. Two pieces of evidence are mentioned here.
The first is the repeated observation during the past six decades that changes in solar activity have affected the Earth’s speed of rotation (see Part II). This can only be accomplished by solar-induced changes to atmospheric angular momentum that affect the global atmospheric circulation. This is not a small feat for such small changes in incoming energy, and it derives from the dynamical changes caused by UV (ultraviolet radiation) absorption by ozone in the stratosphere.
The second piece of evidence is that Arctic temperatures display a negative correlation with solar activity. This is not a recent development, as shown in Fig. 5.5. This negative correlation was demonstrated for the past two millennia by Kobashi et al. in their 2015 article “Modern solar maximum forced late twentieth century Greenland cooling.” Part of their figure 3 is shown as Fig. 7.3.

In Fig. 7.3, panel (B) is the Greenland temperature anomaly combined with the average NH temperature from four Northern Hemisphere records. Periods of warm Greenland anomalies in Greenland are in red, periods of cold Greenland anomalies are in blue. Panel (C) shows two TSI reconstructions by Steinhilber et al., 2012 and Roth and Joos, 2013 in z score. The blue areas are the periods of stronger solar activity, and the red areas are periods of weaker solar activity. Generally, the colored areas in (C) correspond to those in (B) with possible multidecadal lags. Panel (E) is a decomposition of the Greenland temperatures into solar-induced changes (blue) and hemispheric influences (orange) with a regression constant (–31.2°C; dashed black line), constrained by the multiple linear regressions. The error bounds are 95% confidence intervals. The green shaded area is the period (the late 20th century) when the modern solar maximum had strong negative influence (red circle) on the Greenland temperature. Figure 7.3 is from Kobashi et al. 2015.
The most plausible explanation for Arctic temperature displaying a negative correlation to solar activity is that changes in the sun regulate meridional transport. An increase in solar activity reduces transport, cooling the Arctic, and a decrease in solar activity increases transport, warming the Arctic. The effect on the temperature in the mid-latitudes is the opposite.
More evidence is provided by the relationship between solar activity and the strength of the polar vortex (see Fig. 5.4). While this relationship provides an explanation for the Arctic temperature-solar correlation, the polar vortex data cannot be extended back in time as much as Greenland temperature data.
7.4 The explaining power of the Winter Gatekeeper hypothesis
Climate research has increased enormously over the past few decades, and frequently changes in climate phenomena are discovered. When these changes do not fit into the IPCC-sponsored CO2 hypothesis, and are not properly reproduced by models using greenhouse gas-related theory, they are considered climate oddities and ignored by the climate science community, who are focused almost exclusively on anthropogenic changes. There are many of these phenomena. We have already mentioned the expansion of the Hadley cells (see Fig. 4.5f). We mention another example here.
At the turn of the century, it was noticed that wind speed over land had been decreasing for over two decades. The phenomenon was termed “global terrestrial stilling” (McVicar & Roderick 2010). It was worrisome because power generation by wind turbines is related to the wind speed to the third power, so the 15% reduction in wind speed observed over the U.S. translated into an almost 40% reduction in available wind energy. The land wind stilling is puzzling as models do not show it. Moreover, it was accompanied by an increase in wind speed over the ocean, so the proposed explanation at the time was that land surface roughness increased due to increases in biomass and land-use changes (Vautard et al. 2010), in another example of an ad-hoc explanation.
Then, unexpectedly, the wind stilling trend started to reverse between 1997 and 2010, and since 2010 all land regions in the Northern Hemisphere are experiencing an increase in wind speed (Zeng et al. 2019). The explanation turned to internal decadal ocean–atmosphere oscillations, that seemed to correlate.
It is unknown to many people, but evaporation over the oceans depends a lot more on wind speed than it does on sea-surface temperature. It was demonstrated that global sea-surface evaporation has closely followed changes in wind speed (Yu 2007; Fig. 7.4).

Fig. 7.4 shows that at the 1976-97 period of low transport/high warming, global ocean wind speed (black continuous line) increased in parallel to ocean evaporation (blue dashed line), while land wind (red dotted) entered a period of stilling. At the 1997 climate shift the trends changed. The data for Fig. 7.4 is from Yu 2007 and Zeng et al. 2019. Europe has been chosen because it is downwind of the main transport route to the Arctic in the North Atlantic and responds earlier to its changes. Since 2010 the trend is shared by wind over all terrestrial Northern Hemisphere regions.
Lisan Yu shows that between the 1970s and the 1990s:
“… the enhancement of Evp [evaporation] occurred primarily over the hemispheric wintertime,” while “the westerlies associated with the [Aleutian and the Icelandic] low systems strengthened and expanded southward”
(Yu 2007)
The Winter Gatekeeper hypothesis can explain this evidence, which, in turn, supports the hypothesis. The 1976 shift reduced meridional transport due to atmospheric circulation becoming more zonal, this increased wind speed and evaporation over the oceans while decreasing wind speed over land, because most meridional transport takes place over the ocean basins. The changes were more intense during the winter season, when more energy must be transported poleward, and resulted in a low-transport, high-warming, global climate regime (Fig. 7.1). At the 1997 shift the increase in meridional transport was caused by a more meridional atmospheric circulation, decreasing wind speed and evaporation over the oceans while increasing wind speed over land. The climate regime shifted into a high-transport, low-warming one.
It is obvious that changes in non-condensing greenhouse gases and anthropogenic aerosols could not have been the driving force behind these changes in meridional transport. This suggests they have been attributed too much climate sensitivity in climate change theory and models. However, the changes in transport and atmospheric circulation are clearly associated with changes in evaporation and air moisture that, without a doubt, must affect changes in cloud formation and transport, not forgetting changes in seawater salinity. Hypotheses that explain recent climate change in terms of water vapor and cloud changes might be subservient to the Winter Gatekeeper hypothesis. The integration of solar, astronomical, and atmospheric-ocean oscillation changes makes this hypothesis an all-encompassing one. It is more likely to be correct than partial hypotheses.
7.5 Some questions and comments about the hypothesis
Given the complexity of the climate system we do not have answers to every question, nor it is required that we do for the essence of the hypothesis to be correct. Some interesting comments came up in the discussions and it is worthwhile to bring them up, for those readers that missed them. Here we review a few of the more interesting questions and comments:
(1) Q: Is it necessary that there has been an increasing trend in solar activity since the Little Ice Age?
A: While an increasing trend in solar activity since 1700 is defensible, it is not required for the solar part of the hypothesis to be correct. As Fig. 7.1 shows, it is enough that an above average activity has reduced meridional transport contributing to the warming. The displayed Modern Solar Maximum had that effect. Fig. 7.3 provides strong support for the solar-transport link over the past two millennia.
(2) Q: Is the greenhouse effect required for the Winter Gatekeeper hypothesis?
A: Yes. In a thought experiment, it was proposed that a reader imagine that the polar regions are another planet (B) that is connected to a planet A made of the tropics and mid-latitudes. The connection allows the transfer of heat. The greenhouse effect in planet B is weaker since its atmosphere has a low water vapor content. During 6 months of a year planet B is in the dark. If more energy is allowed to pass to that planet, it is radiated more efficiently to space and the binary system average temperature decreases, despite planet B warming. The opposite happens if less energy is allowed to pass.
(3) Q: Why is there no correlation between surface temperature and solar activity if the hypothesis is true?
A: Because there shouldn’t be a correlation. At the multidecadal scale, meridional transport responds primarily to the multidecadal ocean-atmosphere oscillation. At the inter-annual scale, the Quasi-Biennial Oscillation and El Niño/Southern Oscillation have a strong effect. The Sun is not dominant at these time-scales. The role of the Sun increases as the time scale lengthens due to its longer-term secular cycles and their longer-term cumulative effect.
(4) Q: How important is the role of ocean transport in climate change in your hypothesis?
A: Oceans store most of the energy in the climate system, and most of the solar energy flows through the ocean before reaching the atmosphere. It therefore has a crucial role in climate. However, the role of the ocean in meridional transport is secondary to the role of the atmosphere and so is its role in climate change. Ocean transport is currently considered to be mechanically driven, with winds and tides providing the required energy. The atmosphere transforms heat into mechanical energy, while the ocean does not. This does not diminish the effect of the heat the ocean transports, which is about one third of total meridional heat transported. It also carries all the heat transferred from the Southern to the Northern Hemisphere. But the importance of ocean transport decreases with the increase in latitude, and so the Winter Gatekeeper hypothesis cannot rely on ocean transport except in a supporting role.
(5) Q: Do changes in solar activity affect ocean currents?
A: Changes in solar output should not affect ocean currents directly because that requires mechanical energy. Changes in solar output must necessarily affect the atmosphere first. This is important because it essentially rules out solar hypotheses that propose an initial solar effect over the ocean.
(6) Q: Does your hypothesis rule out warming from anthropogenic forcing like greenhouse gas emissions, industrial aerosols, and land use changes?
A: No. It just leaves a lot less room for them. If the hypothesis is correct, it is unlikely that the anthropogenic effect on climate can account for more than half of the observed warming, and probably much less.
(7) Q: What about Svensmark’s cosmic rays-cloud hypothesis?
A: We have not found any evidence for that hypothesis.
(8) Q: Isn’t the change in irradiance during the solar cycle too small to affect climate?
A: The change in irradiance with the solar cycle is only 0.1%, too small to change the system energy budget significantly and drive climate change. The ultraviolet radiation part 200-320nm of the spectrum is only 1% of total solar irradiance energy, and it varies by 1% with the solar cycle (10 times the variation in total energy). So, the ultraviolet radiation change responsible for the solar cycle effect on climate is only 0.01% of the total energy delivered by the Sun. The other 0.09% of the energy change is irrelevant in terms of climate change and has no detectable effect. The solar effect on climate is not about the amount of ultraviolet solar energy, but its dynamical effects in the Earth’s atmosphere. 99.99% of the energy responsible for the solar effect is already in the climate system. An increase in meridional transport reduces its transit time through the system, while a decrease in transport increases its residence time causing the temperature changes.
(9) Q: Your hypothesis cannot be correct because the top of the atmosphere should be in radiative equilibrium and return the same amount of energy it receives.
A: That statement is incorrect. The radiative flux at the top of the atmosphere is never in equilibrium and the planet is warming or cooling all the time at any time frame considered. Nobody has ever identified a period when the amount of energy entering the climate system was the same as the amount of energy exiting the climate system. The Earth has no way of returning the same amount of energy it receives. Many not well constrained feedback mechanisms are responsible for what thermal homeostasis the planet is capable of.
(10) Q: Stratospheric temperature also shows a shift in 1997 from a declining trend to a flat trend.
A: Yes, that is evidence of the 1997 climate shift and the ongoing pause despite the 2016 El Niño. The stratospheric temperature trend has the reverse profile to surface temperature trend. Models believe this is due to changes in stratospheric CO2 and ozone, but models and observations disagree significantly (Thompson et al. 2012). The stratosphere temperature trend is consistent with what is expected if the Winter Gatekeeper hypothesis is correct.
(11) Q: Scientists are already aware that changes in meridional transport are a possible cause for warming. See Herweijer et al. 2005.
A: The IPCC does not believe changes in transport have significantly contributed to the observed warming since 1951. If they did it would be included in the natural (internal) variability that they have assigned a net zero effect (see Fig. 5.1). Models do not reproduce transport correctly, and Herweijer et al. 2005 is an example. Models assume that the sum of ocean and atmospheric transport is nearly constant. This is called the Bjerknes compensation hypothesis (see Part IV). In their model experiment they increase ocean transport by 50% and observe warming from water vapor redistribution changes (greenhouse effect changes) and a reduction in low cloud albedo and sea-ice albedo. The problem is they fail to mention that their model-based proposed mechanism should work as negative feedback to warming. In a warming planet with polar amplification and a reducing latitudinal temperature gradient, a reduction in ocean transport is both implied and observed (they acknowledge it, referring to McPhaden & Zhang 2002). According to their model experiment this should drive cooling from transport changes, not warming. Their failure to mention this is misleading, to say the least. In a serious challenge to the model-based Bjerknes compensation hypothesis, researchers have found a strengthening of the North Atlantic Current since 1997 (Oziel et al. 2020) simultaneous with the strengthening of the atmospheric transport shown—and referenced in our articles—and in agreement with the Winter Gatekeeper hypothesis.
(12) Q: Shouldn’t the tropical convection zones be the main radiators of the planet, responsible for cooling? Directing heat away from the wet tropics should warm the planet.
A: That is incorrect. More energy is lost at the tropics than at the poles, but the energy loss at the tropics is essentially capped by deep convection. There is a point when additional downward energy does not increase surface temperature because it is used to increase convection. The proposal that deep convection acts as a thermostat in the tropics is over 20 years old (Sud et al. 1999). Deep convection transfers excess energy to the atmosphere but reduces outgoing longwave radiation through cloud formation. Most of the energy remains within the climate system. The negative correlation between sea surface temperature and outgoing longwave radiation, once temperature exceeds 27°C, is a well-known feature of tropical climate (Lau et al. 1997). The standard view is that transporting more energy toward the poles warms the planet. Our hypothesis and the evidence we have presented supports the opposite view.
(13) Q: The essence of Arctic amplification in winter is not what you say, but the impact of increasing sea temperatures, the decline in sea-ice and the increase in winter clouds, that are changing the Arctic to a warmer regime.
A: That is the position of most climate scientists. We disagree. That is the effect. The cause is a change in the amount of heat transported by the atmosphere to the Arctic that took place quite abruptly in a few years after the 1997 climate regime as shown in Fig. 7.2. This increase in heat and moisture transport produced the rapid decline in sea-ice and increase in cloudiness that are features of the new Arctic regime. All consensus Arctic predictions are failing because the situation stabilized in the new transport regime instead of causing positive feedback—the logical conclusion if the consensus position were correct.
(14) Q: Your view of El Niño/Southern Oscillation is incorrect. La Niña and El Niño are the alternating states of an oscillator.
A: That is not supported by a frequency analysis of the El Niño/Southern Oscillation. El Niño and La Niña are opposite deviations from the neutral state. Our analysis shows the frequency of La Niña years displays a strong negative correlation with the frequency of neutral years (see Fig. 2.4), not El Niño years. And the frequency of neutral years follows the solar cycle. There is only one way to interpret this evidence. La Niña and neutral are the alternating states of an oscillator that responds to solar activity. As neutral conditions are not opposite La Niña conditions, the oscillator tends to accumulate too much subsurface ocean heat. El Niño resets the oscillator. El Niño frequency depends upon how much extra heat the oscillator collects, which, in turn, depends upon whether the planet, overall, is warming or cooling. This is a very unorthodox view but it is supported by the evidence.
(15) Q: You show in Fig. 6.9 that over 85% of the surface warming shown in HadCRUT5 for the period 1997-2014 is the product of changes made to the temperature datasets since HadCRUT3. Is this correct?
A: Yes. Global annual average surface warming is not only a poor measure of climate change but, since it is calculated as an anomaly to an average, it is also a very small number relative to the accuracy of the measurements, and to the much larger seasonal temperature changes from which it is subtracted. The planet is warming but the numbers used to show it are not as meaningful as we are led to believe. A significant part of the warming claimed is due to the way it is calculated, as shown in the figure.
(16) Q: Do you really believe that you are correct and the IPCC is wrong?
A: Paraphrasing Einstein, if the IPCC is wrong it should not be necessary that one hundred authors show it. One is sufficient.
(17) Q: According to your theory, what should we expect from climate change in the next years and the rest of the century?
A: The current below average solar activity and an expected cooling phase in the Atlantic Multidecadal Oscillation indicate a probable continuation, or even accentuation, of the reduced rate of warming during the first third of the 21st century. A modest cooling during this period is possible. Unlike the 20th century, this century should contain two cooling phases of the Atlantic Multidecadal Oscillation. Even if another extended solar maximum takes place for most of the century, the 21st century should see significantly less warming than the previous one, regardless of CO2 emissions. A grand solar minimum is highly improbable according to our interpretation of solar cycles, which is a relief. Based on past evidence, a grand solar minimum sets the planet into a severe cooling trend.
(18) Q: What would be a good test of your hypothesis?
A: The expected climate change for the next 30 years, as described above is consistent with several alternative theories to the IPCC’s, based on the effect of the multidecadal oscillations. The Winter Gatekeeper explains better why the shift took place in 1997, and predicts the next shift for c. 2032, i.e., three solar cycles. The best test will be when a very active solar cycle takes place, if Arctic amplification turns into cooling and Arctic sea-ice grows it will support our hypothesis. If this happens, proposed alternatives to our hypothesis will be entertaining.
Sadly, this isn’t even close to a “plain-language summary”.
Most of the unscientific public have no idea what “meridional transport”, “troposphere” and numerous other terms used here mean.
Few people can even read a graph or understand what a scientific reference is far less understand the study itself.
Probably more than 90% of the worlds population doesn’t have a higher scientific qualification, the vast majority of that barely has a high school education.
These are all voters folks (assuming a democratic system) and they are the people that need convincing.
Climate Change is similar to the Schleswig Holstein question. Most people know too little about it to be entitled to form or hold an opinion.
However, this contribution is at least scientific. It makes falsifiable predictions whose results most people now living will see. I hope I’m around to witness the outcome.
The hypothesis is complex and difficult to explain. We are continuing to work on a digestible explanation, hopefully our new book will be out sometime next year.
Will it be vanity published? The Vinos book you link was published by Critical Science Press, which seems to be such a publisher. If not, feel free to set me straight.
Not a diss (here) on VP’ing, but please show us the $ trail (including provenance) for publishing both that book and yours upcoming.
I did not pay to have my book published and I was not paid to write it. There is no $ trail here. Just disinterested science for anybody that wants to learn. I am getting tens of requests from climate scientists for a copy of the book. Anybody that wants one can go over to Judy’s blog to get their own copy. Anthony was asked to offer a free download but he was uninterested.
“There is no $ trail here.”
Publishing isn’t free, Even e publishing. So, there is a $ trail, and you know it. Please expand on terms and conditions, since you are not denying that CSP is a vanity publishing enterprise.
You seem to know very little about publishing. Have you published anything?
I absolutely deny that CSP is a vanity publishing enterprise. Show any evidence you have that it is since you are the one making unfounded accusations.
Bob is desperate to discredit anyone who disagrees with the alarmist agenda. His problem is that he can’t actually refute any of the arguments being given, so he’s forced to once again attack the messenger.
bigoilblob,
Get off it. I helped Javier go through the publish-on-demand process, and I’ve been through it myself. While it isn’t free, the costs are minimal. Nothing to see here and Javier is correct, you don’t know a thing about publishing books. You’re just making a fool of yourself.
“You’re just making a fool of yourself.” Not the first time probably won’t be the last it seems to be his natural state
You got this right!
Why does anybody bother responding to Bigoilyboob? Has he ever raised a valid point on any topic?
Was it so hard to admit? And apparently there’s lots of daylight between “the costs are minimal” and Javiers “I absolutely deny that CSP is a vanity publishing enterprise.”. You guys need to get your stories straight in advance.
Review my posts, That’s all I aksed for.
BOB,
I have published an e book on Amazon at no cost to me. I even got paid royalties on purchases. Amazon takes a % of those sales and that’s how they make their money for that. Now, they also try to trap you into buying a program to promote your book but it is not required.
A vanity publisher is one that will publish anything for a fee paid by the author. It’s called vanity publishing because they rely on the vanity of the author, who almost always think they have written a hit. These authors find out quickly that they have wasted their money.
Congrats, but irrelevant. Read Andy’s post. It cost him.
It came late to me that you might think that the referenced link was published by Amazon. It was, in fact, published by Critical Science Press. They are a ghost online, with the closest thing to an identity being a hit for subsidy publishing. If Andy and/or Javier can link us to their website, I’d be grateful.
Any criticism of what was published?
No I’d rather shoot the messenger.
What’s relevant is that you stated:
Publishing isn’t free, Even e publishing.”
I just showed you to be wrong.
Thanks for the link and the book! This might be one of the most important advancements in our understanding of climate change. Your efforts are highly appreciated!
Gyan1,
Thanks from both Javier and me.
As if that made a difference. Once again attacking the messenger.
What “attack”? I just want to know the $ flow.
But IMO, it sure does. For me, it channels my employment with Bechtel. On my first day, I was given a copy of their vanity published company history. Soon after, I found the conventionally published “Friends In High Places”, and learned “The Rest Of The Story”….
You have been told. You just don’t want to believe it. But that is your problem.
‘Bechtel’ did a lot of work in Saudi. For someone who was on the receiving end of the petrodollar conveyor, you seem to have a lot of animosity towards oil and gas.
No “animosity” at all. To steal a phrase, oil and gas have “Ben, bery, bery, gud tu mi”. But a real friend tells the truth to that friend.
And there you go again. You claim that you aren’t attacking the messenger, then you imply that anything printed by someone other than one of the big publishers is trash and can’t be believed.
Your desperation is making you look bad.
Big, small, no diff. But if you have something legit and technically supported to write about, then you don’t need to shell cash to get it published.
That has got to be one of the dumbest things you have ever written.
Since when? We’re not talking about John Grisham at Enron here (no offense JV and AM).
It seems as though your point is very insubstantial.
Take care,
JBP
“Not a diss (here) on VP’ing, but please show us the $ trail (including provenance) for publishing both that book and yours upcoming.”
And that would matter…why? My guess is that if ExxonMobil or Peabody Coal had paid for the work, you could dismiss it out of hand – thus saving yourself the mental effort of evaluating the arguments objectively to determine their merits.
If that’s the case, I am sorry you experienced whatever circumstances led you to believe that everyone else is an intellectual prostitute, too.
Not “everyone else”. Not even those who pay or allow their invested sponsors to pay. It’s like dark $ in politics. They can do whatever they want, but we should know. Andy et. al. seem to disagree, judging by their deflections and incomplete responses.
What makes you think it’s any business of yours?
They are all mass consumers of MSM and therefore already convinced. You can’t unbrainwash people.
I guess I can’t reach those people. They will likely read their trusted MSM and believe whatever they are told. Hopefully, they’ll have a friend or family member that can tell them about alternative scientific views, like ours.
It has been my experience that in their zeal to dumb down science news, most science editors and journalists mislead their readers with their over-simplifications.
If someone wants to travel to a foreign country, it is prudent to try to learn something about the culture and language. If an intelligent layman wants to learn about the climate controversy, is it necessary to master some of the basic vocabulary.
I live in Texas where people still read something besides newspapers. I’m always surprised at how many well-informed people I meet. Certainly, many people are ignorant of science and engineering, but a surprising number are quite well informed. We are targeting that group.
More pictures would help. ……
Although I’m being mostly sarcastic, well-done graphics do help, but your subject matter is very complicated.
Thanks to both of you for this series. I’m going to go buy some really good hockey skates now.
A simple book on climate is impossible. The biosphere of plant earth is the most complex artifact in the known universe.
If that’s the case, how come the alarmists managed to convince people climate change will be catastrophic?
How many are in the group?
Don’t give up. The essence of the criticism is that there are words and phrases in your essay that haven’t been defined and aren’t common knowledge.
The simple resolution is to define those terms. It would add a little length to the text but not too much. For example, “wind patterns flowing from the tropics toward the poles called meridional transport”, or “the lowest part of the atmosphere called the troposphere”.
We use these specialized words to speed up communication. It doesn’t take special intelligence to learn their meaning, but the communication fails if any of the words used are unfamiliar to the reader/listener.
There’s a deeper problem with the terminology. As the trade winds, which are main part of the “meridional transport”, do blow towards the tropical convection zones, i.e., mostly away from the poles. Thus with more meridional mass transfer you usually get *less* meridional heat transfer (towards the poles).
Trade winds are the lower part of the Hadley cell. The higher part blows poleward. At the Hadley cell latitudes, most poleward transport is carried out by the ocean.
That’s exactly what I am addressing, Javier.
The higher part of the Hadley cell radiates most of its energy off before it can sink along the Horse latitudes.
And the ocean heat transport depends on how much of that heat is eliminated in the tropical convection zones.
Any evidence for that? Or it is just what you think happens.
Don’t know what kind of evidence that could be. It is basic physics. The air cannot sink before losing most of its heat (potential temperature needs to be equal or lower than that of the lower layers). That’s pretty straight forward.
Here’s a graph depicting how an air parcel at the upper layer of the troposphere cooles when it travels from its peak potential temperature (~390 K) in the tropics to the Horse Latitudes (~290K) before it can sink (along the isothermal potential temp).
So the Hadley Circulation does not transport much energy polwards, if you look at it from the surface, but mostly towards the tropical convections zones along its lower layer, i.e., the trade winds.
I am not aware of any specific measurements that quantify this meridional energy transport relating to surface. Which seems to be part of the reason why this hasn’t been analyzed correctly so far. Measurements of energy transport, however, that do not distinguish between upper and lower tropospheric layer are pretty meaningless for this question.
That’s rather my point.
If, say, you convinced every scientist in the world that catastrophic climate change is nonsense you reach 10% of the population.
When it comes to voting for the politicians who spread propaganda about CC just to get elected, 90% of people fall for their Al Gore smoke and mirrors because the alternative is too complicated for them.
In other words, you can never make any difference to the outcome, all you’ve done is convinced a few scientists.
Politicians’ interest in science issues eventually wanes, as seen with the ozone hole or acid rain. When the CO2 hypothesis falls very short of explaining climate change and there are no political issues, scientists will have to look for alternative hypotheses. If it turns out mine is more correct than others, the Swedish Academy knows where to find me.
From Part VI
“At the largest time scale, it is plate tectonics that governs climate change by facilitating or restricting tropical heat access to the two polar radiators.”
Another factor in the creation of the equable climates of ancient times could have been the baseline temperature of the deep ocean.
Below a salinity of 27.4 %’a, the maximum density of seawater lies above the freezing point, and it behaves like fresh water in that the coldest water will float. This means that the polar regions, which usually have lower than average salinities, become excluded as major sites of deep water formation even if they are very cold. In our preliminary Campanian ocean simulation, all of the Arctic is excluded as a potential site of deep water formation for this reason. It is easy to envision that all of the cooler areas of- the planet might be covered by lower salinity water and excluded from deep water formation.
Another peculiarity arises when salinities are significantly higher than at present. Note that between salinities of 30-35 the density curve be– comes almost vertical at temperatures of 0 °C and below. The cause for this is easy to see in the left part of Fig. 1. The density lines become vertical at the point of maximum density. In seawater, the maximum density lies below the freezing point. Becasue at S = 30-35, the maximum density is just below the freezing point, the temperature change as sea– water cools from 0 °C to the freezing point (about -2 °C) has almost no effect on its density.· Today, density changes in seawater below 0 °C are dominantly a function of salinity, and consequently high-latitude bottom water formation takes place where the water is saltiest. However, Fig. 1 shows that when the salinity reaches 40 %’a, the density curve never ap- proaches the vertical, but slopes down to the freezing point. The densest water in the ocean will be the coldest water. This has profound implica- tions for formation of high-latitude bottom waters in the past.
Conclusions
There have been significant changes in the mean salinity of the ocean during the Mesozoic and Cenozoic. Reconstruction of paleosalinities indi- cates that during most of the Cenozoic mean ocean salinities have been higher than at present. Late Cretaceous paleosalinities were similar to those of the Late Cenozoic, but Early Cretaceous mean ocean salinities were much higher, ranging between 38 and 42 %’o. The major salt extrac- tions of the S outh Atlantic (Early Cretaceous) and Red Sea and Medi- terranean (Late Miocene) caused rapid decreases of oceanic salinity by a few per mille. Because of the non-linearity of the equation of state for seawater, the ocean may behave differently when the mean oceanic sali– nities are significantly different. At salinities of 40 %’o or higher, the most energy-efficient way to form deep water is by cooling saline water at high latitudes. Sea ice formation expells salt into the surrounding waters and is the most important means of deep water formation today. However, it is an efficient mechanism for deep water formation only at salinities of 35 %’o or lower. Evaporation also increases the salinity of sur- face waters and can lead to deep water formation, as in the modern Mediterranean, but it is the least energy-efficient mechanism.
https://core.ac.uk/download/pdf/33671934.pdf
The temperature of the ocean is the result of the heat flux at the ocean-atmosphere boundary. When the planet is warming the ocean absorbs heat, and when it is cooling the ocean cedes heat. Salinity changes are no doubt important, but to say, as your reference says, that:
“Today the thermohaline circulation is driven by minute density differences”
is most likely wrong.
The influence is also in the other direction. If, for example, the oceans produce more upwelling in the tropics, you’ll have less clouds there, and thus a) more incoming energy, b) lesse convection and heat loss to space, and c) more meridional heat transport that warms the mid to higher latitudes. An important part of the Eocene cooling might be less tropical ocean upwelling, and instead intensified AMOC.
Thank you . I was also hoping for a short summary article . Now you have provided it . Looks good .
“Changes in solar output must necessarily affect the atmosphere first. This is important because it essentially rules out solar hypotheses that propose an initial solar effect over the ocean.”
This is fundamentally wrong and backwards.
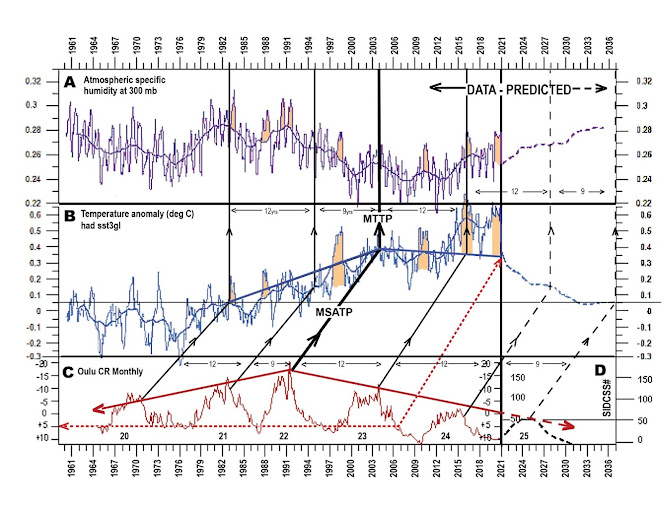
The fact that the climate, represented below in the first image by the 30y HadSST3, lags the 109y SN by 11 years, indicates it is the ocean that stores the absorbed solar energy, not the atmosphere, which has no similar heat storage capacity.
The second image below shows the lower troposphere lags SST by 2 months, confirming the oceanic control of the atmosphere. The sun’s TSI controls the ocean, and thereafter the ocean controls the atmosphere with a 2-month lag:
This rules out the premise that the climate is controlled by the atmosphere first.
“However, the role of the ocean in meridional transport is secondary to the role of the atmosphere and so is its role in climate change.“
Likewise, this view is overturned by direct evidence given below for ocean transport being a very significant driver of polar air temperature, making it primary, not secondary.
You are right Javier has got everything backwards. .On the Curry site he says
” The negative correlation between long-term solar activity and Arctic winter temperature is clear (Fig. 5.5).”
The correlation as shown in his Fig 5.5 is simply wrong a – Figment of his imagination.He ignores the delay. Because of the thermal inertia of the oceans there is a 12/13 year delay ( you say 11) between the solar activity driver changes and the correlative temperature change- see my Fig.2 and the quotations from my Blog
http://www.blogger.com/blog/post/edit/820570527003668244/3260744859689736991
“Short term deviations from the Millennial trends are driven by ENSO events and volcanic activity.
“Fig 2 The correlation of the last 5 Oulu neutron cycles and trends with the Hadsst3 temperature trends and the 300 mb Specific Humidity. (28,29)
The Oulu Cosmic Ray count shows the decrease in solar activity since the 1991/92 Millennial Solar Activity Turning Point and peak There is a significant secular drop to a lower solar activity base level post 2007+/- and a new solar activity minimum late in 2009.The MSATP at 1991/2 correlates with the MTTP at 2003/4 with a 12/13 +/- year delay. In Figure 2(5) short term temperature spikes are colored orange and are closely correlated to El Ninos. The hadsst3gl temperature anomaly at 2037 is forecast to be + 0.05. ”
Understanding climate is very simple and obvious except to the current ,post modern, climate “consensus” politically correct academic scientists, the BBC,MSM etc who make their living by claiming it is complicated. When solar activity is high it is warmer and wetter. Crops and civilization flourish see The Roman and Mediaeval and Modern warm periods. When solar activity is low we get the Dark ages and the Little ice age.
These trends are often obscured by short term fluctuations caused by ENSO events and volcanic activity and variations in space caused by the distribution of mountains and river basins..
Bob and Norman,
Obviously, we disagree with you and are unconvinced by your plots. You need to make a much better case.
With regard to Figure 5.5 (see below) this is just a plot of the data from the Royal Observatory of Belgium STAFF viewer in black. The red curve is the winter (December-February) mean temperature anomaly calculated from the operational atmosphere model at the European Center for Medium-range Weather Forecast for the +80 °N region. It is not from Javier’s imagination, look it up.
What is the basis on which you concluded 2/3 meridional transport is atmospheric and 1/3 oceanic? Didn’t find a source for this it in the book.
Trenberth, K.E. and Caron, J.M., 2001. Estimates of meridional atmosphere and ocean heat transports. Journal of Climate, 14(16), pp.3433-3443.
It has been studied many times since, and it is even in textbooks. We showed it in figure 3.4. You may have missed it.
Notice how it changes with latitude. The higher the latitude the lesser the oceanic role.
Ok, thanks.
The atmospheric transport is integrated over the full height, seemingly. But it is crucial, whether the transport takes place in the lower troposphere layer, influencing the surface temperatures, or in the upper troposphere layer, from where most of the energy is radiated to space and does not get back to the surface.
I am pretty annoyed with myself. I put together an (incredibly) simple model to predict the Atlantic Hurricane Season and came up with numbers that were quite low so decided to wait out the season and post my prediction for NEXT year depending on what happens this year.
This is what my model said (09 May 2022 prediction date):
Tropical storms: 14 (11-17)
Hurricanes: 7 (5-9)
Major Hurricanes: 3 (2-4)
How am I looking? If I gave the details of my model it would also prove I could have run this a full year ago and gotten the same results – there’s no cherry picking here. I think my model is too naive, but I’m looking pretty good so far!
If I come out really good I’ll post more next season….
Oops – hurricanes should say 7 (5-9). Can’t figure out how to edit it.
Fixed it.
As has been said many times, predictions of low tropical activity are meaningless because it only takes one to hit you to ruin your life. Currently, TD #9 is forecast to be at my door step next Wednesday as a Cat 2 hurricane. IF, and it is too early to tell, but IF the models are correct, this storm could possibly wipe out my 21 years of safe living in my home. It only takes one. So we prepare for the worst and hope for the best. Activity predictions are not necessary.
Activity forecasts help disaster responders know how much stuff they need to stock up on before the season.
I don’t think a yearly forecast has any effect on the state and local agencies in their preparation. The ones in areas with years of hurricane experience have plans for worse case scenarios that don’t change on an annual basis.
Anyone can be right once. The question is, can you do it again, and again? You might want to see how well your model would have predicted past hurricane seasons. Does your model also work for the Pacific?
Good summary. I also downloaded the book from Judith Curry’s site, for reading as time permits. Thank you.
The ‘Winter Gatekeeper Hypothesis’ appears to be quite plausible in explaining the data presented.
For completeness, are there data that the hypothesis can’t explain or that contradict the hypothesis?
There are lots of things in climate that nobody can properly explain, even though explanations are offered. An example: Nobody knows why the albedo of the Southern Hemisphere is the same as that of the Northern Hemisphere when it has so much difference in land surface and ice surface. Models can’t help because models don’t know what hasn’t been programmed into them.
Thank you for that example, but I don’t think the hypothesis set out to explain albedo.
I thought it would be clear that I was alluding to data directly relevant to illuminating the hypothesis, particularly data that might potentially falsify the hypothesis.
I’m asking this with the hope that the hypothesis will survive scrutiny …
After 7 years of reading papers, I haven’t found anything that falsifies the hypothesis, and I have tried because that is the first duty of a scientist. But that doesn’t mean others will not succeed where I failed.
I’ve looked as well, especially since Javier asked me to join with him in these posts and the book we are working on, but so far everything I could find is consistent with the hypothesis. The nice thing about the hypothesis is its predictive power. You can use it to make many predictions that can be checked in the future, so it could still be falsified, but I don’t think it can be right now.
All the extant simple hypotheses are clearly nonsensical.
Your hypothesis is comprehensive enough to potentially be THE starting point (if not also the end point) in understanding the big picture mechanisms that create the global ‘climate’.
Bravo for both your work!
Thanks.
It would be great if you would enumerate the most important predictions and what would disprove them here.
Net albedo is dominated by cloud cover?
Yes, absolutely. Atmospheric albedo dominates over surface albedo except at very high latitudes.
Wouldn’t a “plain language summary” of climate change issues be:
Climate variables (temp. etc.) have changed very little.
Science activists have been zooming in on graphs of data to make slight variations look like catastrophic changes.
On top of that the data is highly suspect because of various issues – monitor placement and number of stations, infilling, ‘corrections’, etc.
And finally, what’s wrong if the world warmed up by 2, 3, 4 even 5°C even 10 if it only means the Earth goes back to the paradise it was during the Cretaceous (minus the huge carnivorous dinosaurs!). Most of the temperature increases would be towards the poles, as the tropics have the benefit of clouds to limit temp changes.
PCman999,
You have a point. The PETM, contrary to what you may have read, was a paradise. Our primate ancestors evolved then and spread rapidly around the world in the great “mammalian dispersal event.” More here:
The Paleocene-Eocene Thermal Maximum or PETM – Andy May Petrophysicist
A paradise? AS long as you were not eaten by something bigger or faster?
Accepting that it is ok would negate the basis of the politics that is at the base of virtually everything going on today. I can’t offer the exact quote since I don’t know how to find it. It was published by one of those organizations, such as the Club of Rome.
“It does not matter whether the theory of CO2 is right or wrong. It is our last, best chance for a socialist world governance. We have to push it as hard as we can, as long as we can.”
I still have a problem with detrending of the AMO cycle with such long periods. This is where data quality and process need to be re-examined. Oversimplification of ocean cycle differences could be more important than the full effects of some of those other, smaller vectors.
It is not intuitive that energy better escapes the planet from the top of the atmosphere in winter from the colder Arctic region than from the TOA in warmer climates. The energy radiated to space presumably is a function of temperature at the TOA unless CO2 is present in quantity. Is the lack of CO2 at the poles the primary driver of the Winter Gatekeeper hypothesis? If so would this effect become less important should CO2 concentration increase substantially?
Don,
Don’t confuse the amount of energy radiated with the net energy radiated. The tropics radiate more energy than the poles, it is just that they have more coming in. The winter poles have no sunlight, all the energy they radiate away is carried there by the atmosphere or created by freezing water vapor or liquid meltwater from the summer. A little makes it through the ice from the oceans, but not much.
Thanks for the reply, Andy.
Then if I understand it correctly the Winter Gatekeeper provides an additional path for radiated energy to leave the planet. Had the energy not moved North it would have radiated less and cooled the planet less.
Don,
Yes, that is true, but not the main point of the hypothesis.
Looking deeper the hypothesis says that energy transport to the poles varies all the time. When transport is high, as it was going into the Little Ice Age, the world is stormier and it cools, although the poles warm due to the extra transported energy.
When energy transport is low, the world warms, there are fewer storms, and the poles cool. Look at Figure 7.1. That temperature curve is for the whole world. Compare Figure 7.1 to Figure 5.5 (below), which is just for the Arctic. Look closely at Figure 7.3(B), there are two curves one for Greenland and one for the entire Northern Hemisphere, red shading is when Greenland is warm, but the rest of the Northern Hemisphere is cool.
Varying meridional transport is the mechanism, but not the cause. There are a number of forces that work on the rate of meridional transport, the Sun, the Earth and Lunar orbits, and internal oscillations like the AMO (Figure 7.1, bottom panel). That is why meridional transport is so key, it is the way the forces affect the climate.
“When energy transport is low, the world warms, there are fewer storms, and the poles cool.”
The higher latitudes will warm if they get more energy from the tropics, i.e., more meridional energy transport. How can the poles cool then?
There seem to be several contradictions (at least in the wording).
Under low energy transport, energy stays in the mid-latitudes warming them, while high latitudes cool due to less energy being transported. No contradiction.
The tropics always keep the same temperature, and therefore the same energy. The most variable part of transport is in energy reaching the high latitudes. In winter, when more energy needs to be transported, high-latitude transport is regulated by vortex strength, which depends on zonal wind strength.
I think this is incomplete.
If the energy moves along the surface to the poles instead of upwards by convection, it primarily warms and increases the avg temp (before it is radiated off).
Avg surface temp does not only depend on energy balance but also on heat distribution (more towards surface versus more towards upper troposphere).
I am sure it is. Nobody understands climate change. It is too complex, and our knowledge too poor.
Javier, this is a severe gap in your basic approach. This needs to be addressed to get further.
JV & AM,
Excellent work on an extremely complex subject! I probably missed it, but does your work explain under what conditions Rossby waves are most likely to influence the climate?
Planetary waves are most active in the winter months and they influence the climate mostly by altering the polar vortex strength and at the so-called surf zone where they break and transmit energy to the stratosphere (see figure 6.4). The strength of the polar vortex determines the high latitudes winter climate regime. A weak vortex promotes a warm Arctic/ cold continents winter regime, where more energy enters the Arctic exchanged by cold air masses moving out.
Thanks Andy. So when TV meteorologists chatter excitedly about the ‘polar vortex’ freezing orange crops, the reality is that it is actually in its ‘weak’ phase and the planet is cooling more than usual?
Yes, when the vortex is weak, is when the cold air comes down to the mid-latitudes in Europe and the U.S. That is also when meridional transport is strongest and the poles warm.
Clearly in winter, when atmospheric circulation is most perturbed and most variable.
Thank Javier.
Wouldn’t a “plain language summary” of climate change issues be:
Climate variables (temp. etc.) have changed very little.
Science activists have been zooming in on graphs of data to make slight variations look like catastrophic changes.
On top of that the data is highly suspect because of various issues – monitor placement and number of stations, infilling, ‘corrections’, etc.
And finally, what’s wrong with if the world does warm up by 2, 3, 4 even 5°C even 10 if it only means the Earth goes back to the paradise it was during the Cretaceous (minus the huge carnivorous dinosaurs!). Most of the temperature increases would be towards the poles, as the tropics have the benefit of clouds to limit temp changes, and the poles would still be frozen waste lands during their respective winters.
We have to communicate that the climate disaster senario that activists are trying to scare us with are actually much better than the current climate.
Climate Witch Trials continue:
https://www.politico.com/news/2022/09/23/world-bank-president-not-resigning-apologizes-for-climate-science-remarks-00058612
Never apologise if you’ve done nothing wrong. Not that the World Bank are good guys in any sense, but apologising to the woke (post-modern Neo-Marxists) mob is just falling into a kafka trap in a worse way than sticking to your guns.
Excellent hypothesis!
There are at least a dozen papers documenting a reduction in clouds during the modern warm period so albedo changes contributed.The average increase in energy reaching the surface studies found was more than twice the human forcing. This paper was close to the average finding and concluded “According to the energy balance described by Trenberth et al. (2009) [34] , the reduction in total cloud cover accounts for the increase in temperature since 1987, leaving little, if any, of the temperature change to be attributed to other forcings.”
https://file.scirp.org/Html/22-4700327_50837.htm
The solar part of the hypothesis suffer from several problems, e.g.
1) The ‘modern solar maximum’ is not particularly strong. The maximum in the 18th century was probably stronger
2) Solar activity has not had the proposed secular trend the past 300 years. In particular, there has not been a significant trend in the UV.
3) No mechanism has been put forward [at least I could not find it in the verbal flood of details] to explain how the sun modulates the meridional transport. Correlation [poor as it is] does not qualify as causation or ‘evidence’
4) With so many processes that may influence the climate it is easy to pick a collection that seemingly has explanatory power. As von Neuman has quipped: “with four parameters I can fit an elephant; with five, I can make him wiggle his trunk.” The hypothesis that is peddled by JV looks like trunk-wiggling to me.
Leif,
Javier may want to add to this, but my thoughts:
I was expecting better from you than some vague claims.
1) Probably? Science is not about opinion.
Looking at the gaussian smoothed yearly sunspot data there are three periods above the average:
I) 1762-1793 (32 years) 24.9 sunspots/year above average. 796 sunspots above average total.
II) 1831-1874 (44 years) 18.4 sunspots/year above average. 811 sunspots above average total.
III) 1933-2003 (71 years) 24.9 sunspots/year above average. 1766 sunspots above average total.
The Modern Solar Maximum has been twice the size of the late 18th-century maximum.
You didn’t read. A secular trend is not required, even if it is defensible.
The mechanism has been put forward, through text, figures, and references. You didn’t pay attention. A higher level of UV sets a stronger latitudinal temperature gradient in the stratosphere. Through thermal wind balance, it causes stronger stratospheric zonal winds that are less affected by planetary waves. As a result, the potential vorticity at the polar vortex is higher and the vortex is more stable, reducing winter energy transport to the Arctic. It works in models, and reanalysis (references were given), and it is strongly supported by the very solid effect of solar activity on the Earth’s rate of rotation. This may be above your level, but that is not my fault.
What it looks like to you is of no consequence. It was never my goal to convince you. As Max Planck said science advances a funeral at a time because old scientists are never convinced by new ideas that show them wrong.
Great Gaia, an imaginably huge analog computer, now with the revolutionary new transmission, the Meridional Transport!
Not just bells and whistles, chrome, and modern new design, rather a model begging for the right of way and the right driver.
This could be you.
Step up, kick the tires, roll the windows up and down and just imagine: beats the flattop Ford but not the bright eyed blonde.
=============
Well, I will say one thing, I understand your hypothesis better now than I did the last time. Keep going. I like the idea that the energy losses occur mostly at the poles. That makes sense given those locations have very little insulation (water vapor). As for solar activity, the influence of solar activity on the polar vortex it is pretty much accepted, but I would think the further down the jet stream reaches the more transport would take place. That occurs during low activity, but you seem to think high solar activity increases the transport and leads to cooling?
The opposite, unless you are talking about the Arctic. Look at figure 7.1. High solar activity leads to less transport and more warming at lower and middle latitudes, and more cooling at high latitudes.
Javier, great work! But as I already addressed in another comment, I think the main heat dissipation works differently. I agree so far, that earth average temp is mainly influenced by how the warmth is distributed and how effectively it radiates off to space and that CO2 plays only a minor role.
The main radiation to space however does not come from the poles, but from the upper troposphere, particularly the upper layer of the Hadley Cell. It is heated by the tropical convection zones. and greatly depends on how much evaporation takes place there.
So if the warmth is more directed towards the tropical convection zones, the evaporation increases drastically. This transports the energy to the upper troposphere, and overall increases the radiation to space, and earth becomes cooler.
To analyse this precisely and connect it to meridional transport and earth rotation speed, one has to differentiate between mass transport and heat transport, and what meridional transport actually means and to which atmospheric layer this is related. As the meridional mass transport within the lower layer of the Hadley Cell is directed towards the tropical convection zone, more meridional mass transport usually means *less* meridional heat transport (towards the poles). But this can get complex in its details.
This is true, but the WGK hypothesis emphasizes net energy emissions. More energy is emitted at the top of the Hadley cells, it is just that more is coming in there than going out. In the winter, at the winter pole, no sunlight is coming in, so when meridional transport is high, the winter pole warms, emits more, and the rest of the planet cools. Meridional energy transport, whether it is warm, humid air mass or energy or both, is the key to climate change. Climate change here is defined as global average surface temperature and storminess in the mid and upper latitudes.
Exactly. What matters is not where emissions are higher, but where they change the most. Figure 6.3 showed that.
Part a (top) shows that the tropics emit more but their emission is almost constant over the year, and clearly capped during July and August by deep convection. The Northern Hemisphere is the most variable in emissions over the year.
Part b (bottom) shows that inter-annually the tropics change their emissions very little, and show no significant trend. Again the Northern Hemisphere extra-tropics show the largest variation, and that variation comes mainly from the Arctic, as figure 7.2 in this post shows.
Peter, your belief that the tropics are in control does not find support in the evidence.
Javier, these graphs do not contradict to what I am saying. The temperatures in the tropical convection zones are stabilized by by various thermostat effects (see Willis Eschenbach). What changes is how the incoming energy surplus is transferred off the surface. Either vertically, by evaporation/convection/cloud shadowing or by meridional transport (which is typically opposed to meridional mass transport).
If the energy is transferred off vertically, it is lost and can’t add to the surface temp. If it is transferred merionally however, it does add to surface temp (this seems to contradict you hypothesis, but I think you just weren’t precise in differencing meridional mass transport versus meridional heat transport at the surface towards the poles).
It is also possible, that the average surface temp changes without changing TOA energy balance, but by different distribution of heat among surface and upper troposphere, i.e., a change in temperature gradient. The global temperature gradient is mainly influenced by the amount of evaporation within the tropical convection zones.
Clearly these processes in the tropical convection zones vary a lot, probably also along the critical climate shift, that would require specific measurements (Fig 6.3 doesn’t cover that. Maybe if it would include outgoing short wave?).
One has to investigate this more sorrowly.
Willis hasn’t discovered anything. That thermostat effect is in papers 20+ years old. He is just telling it to people that don’t know.
The graphics do contradict what you are saying. Energy exits the climate system as outgoing long-range radiation at the top of the atmosphere. Most of the variability in OLR takes place at the Northern Hemisphere extra-tropical latitudes. The variability is very significant in terms of energy. That’s it. Climate change is not determined by what happens in the tropics. And this makes sense as there is very little climate change in the tropics.
I wasn’t saying that Willis has discovered it, and I am also well aware of that literature. But Willis did a great job in presenting and explaining the mechanisms here in the community (so everyone will know his “Thermostat Hypothesis”), with lots of very interesting CERES data.
The tropics have stable surface temp (stabilized by various thermostat effects) but still influence the climate by high variability in energy transport – by cumulating the energy in the convergence zones and then diverting it vertically or meridionally.
Clearly, more vertical transport, away from the surface, does reduce the surface temp. While more meridional transport along the surface keeps the energy there and increases the surface temp.
If you look at OLR, you see the change in meridional transport only at the higher latitudes (mainly from the “atmospheric rivers” getting lifted in the extratropical cyclones).
You can’t expect to see this variability as a change in tropical OLR. And also measurements of meridional transport that don’t differentiate between upper and lower tropospheric layers do not help here.
Probably this fits well with your Gatekeeper Hypothesis, it only differently explains the effects in the tropics and suggest slightly different wording to grasp it better.
Andy, thanks. But as Javier states, it matters where it changes the most (which is exactly my point).
AMO is just a linearly detrended North Atlantic SSTA, there’s nothing special about it. If you detrend global temperature anomalies, you get the same shape/oscillation. The oscillation is global.
https://woodfortrees.org/plot/esrl-amo/mean:12/plot/hadcrut4gl/detrend:0.92/trend/plot/hadcrut4gl/detrend:0.92/mean:12
Otherwise, I agree with the prediction for the next few decades, reduced warming and then some cooling.
Yes, it is. It was called the “stadium wave” by Marcia Wyatt.
Andy,
Javier,
It’s been great watching and reading your thesis about how energy is transported and emitted on the globe.
I really appreciated this answer.
One only has to examine temperature trends at the station level around the globe to see that there are many, many places where there has been little warming to even cooling and few if any places where enough warming exists to offset the non-warming and create the large “global” temperature anomaly. That is in addition to the problems with creating numbers with a resolution that far exceeds the actual measurements. Not very scientific and someday in the future will bite them in the arse.
This statement:
needs some additional explanation for most people. Although an oscillation has opposite deviations from a “baseline”, they are continuous and periodic in time. What you are describing is probably a confluence of periodic phenomena generating a pulse type response. Various periods and phases of various phenomena can be combined to observe this condition. This is basically what UAH shows in their temperature graph also, i.e., non-periodic variations up and down, but always returning to a baseline.
Again, nice work and should provide a new concept for analyzing the climate in a with a different paradigm.
I would offer a mechanistic explanation for ENSO as follows:
ENSO is in oscillation between two unstable states of the energy balance in the tropical Pacific.
As for the tropical Pacific energy balance –
There are three principle inputs:
The outputs are:
When the water temperature is low and wind speeds are low, the rate of evaporative cooling is low and there is not enough cooling to balance the energy outputs under most conditions. The ocean will begin to heat.
When the water temperature is warm and the winds increase (a result of increased moisture content in the air), the rate of water evaporation can increase by orders of magnitude (particularly with waves with broken surface). In this case there is never enough energy inputs to offset the evaporative cooling, and the ocean cools.
Because of system momentum, it takes months to wind up the winds, or slow them down, the system will always overshoot in either direction, thus ensuring the oscillation, the time constant of which is related to the system momentum.
Edim September 24, 2022 5:19 am: AMO – the oscillation is global.
Yes, it is driven by the advection from ENSO.
I think this figure is crucial to understand what ENSO is.
ENSO is part of the global energy transport system. It oscillates between La Niña and Neutral state following the solar cycle. It extracts heat from the tropics and distributes it at higher latitudes. When too much heat accumulates an El Niño resets the oscillation.
Figure 4.5c (black line) shows that the frequency of Las Niñas versus Los Niños depends on the meridional transport regime.
Less Niñas characterized the 1976-1997 phase and more Niñas since 1997.
We have to rethink ENSO in different terms.
15) Q: You show in Fig. 6.9 that over 85% of the surface warming shown in HadCRUT5 for the period 1997-2014 is the product of changes made to the temperature datasets since HadCRUT3. Is this correct?
the changes are additions . more arctic stations.
Of course. High latitude anomalies are huge disproportionately affecting the global average. Yet, as I have shown, more Arctic warming means less global warming.
It is shameful that I must come from molecular biology to teach climate scientists what they are doing wrong. It appears the scientific method is no longer being properly taught at certain disciplines.
Climate scientists even cancel renowned physicists who have in depth knowledge about radiative physics, example, Dr. Happer. It is a shame, and at some point, the climate scientist’s names who perpetuate incorrect and catastrophic doom will themselves be canceled when historians analyze how climate science was corrupted through the search for money.
The Piltdown Mann & his Crook’t Hockey Stick, straight shaft straitened with deceit, will take longer to resolve than did the controversy over the 19 th Century Piltdown Man.
================
Very nice, thank you. We are headed in the right direction, big progress.
I am trying to understand your proposed mechanism by which changes in solar activity regulate meridonal transport. Is it solely via solar-induced changes to atmospheric angular momentum due to UV (ultraviolet radiation) absorption by ozone in the stratosphere, thereby affecting the global atmospheric circulation?
If so, have the IPCC et al been focussing on the wrong part of the spectrum i.e. IR? And if IR absorption/emission is largely irrelevant, then surely so to is the Greenhouse Effect (notwithstanding that the presumed greenhouse effects in the IR spectrum have been incorrectly calculated anyway).
Essentially yes, All solar activity effect on climate is initiated by ozone absorption of UV radiation at the stratosphere. A chain of effects results in important changes to the global atmospheric circulation, particularly during winter and more strongly in the Northern Hemisphere.
IR emissions are important for energy exit from the climate system. In the end, the solar effect affects the amount of IR that exits the system, so it works through the greenhouse effect by directing variable amounts of energy to the parts of the planet where the greenhouse effect is weakest, the poles in winter.
So does this run counter to meridional transport?
https://phys.org/news/2022-09-arctic-sea-ice-loss-frequent.html
From an MT perspective it seems to be a cart before the horse thing.
JBP, It’s model study using, “a global climate model that provides state-of-the-art computer simulations.” What they don’t mention is that the state-of-the-art of climate models is dismal.
The almost shocking revelation in reading the Vinos-May theory is realizing the absolute obviousness of the fact that meridional or polewards transport of heat leads to that heat being lost to space at an accelerated rate due to the lack of the primary GHG, water vapor, in the cold polar air.
This simple ineluctable physical fact completely blows up the CO2-driven global warming alarm and should have ended it before it ever got off the ground.
Take a look at Richard Lindzen’s reminisce on this website last Thursday, starting at the 18 minute mark of his interview with Tom Nelson. Lindzen looks back at how alarmists in the mid-1990s were proposing to make a big deal about the tiny amounts of observed warming that could possibly be attributed to human increments to CO2. Their answer was “polar amplification.”
In the absence of water vapor, CO2 does a much larger proportion of the heat-trapping work that gets done at the poles than of the heat-trapping work at lower latitudes, causing its small warming effect to mostly show up at the poles, but it’s still a tiny warming effect.
I remember reading Patrick Michaels book “Satanic Gases” in 2000 where he scoffed at the idea that a rise in arctic temperatures from far below freezing to slightly less far below freezing was going to cause the ice caps to melt. Having the coldest places on earth get a tiny bit warmer was not a catastrophe.
But the perversity of this alarm is actually even more profound. Warming at the poles is the last thing we need to worry about because thermal energy at the poles is quickly lost to space.
Suppose the ice caps did shrink. The extra energy absorbed there instead of reflected away by snow and ice would quickly be lost to space as longwave radiation, thanks to the lack of water vapor.
Then of course there is the fact that if the planet as a whole does warm up then the increased thermal energy gets pushed even harder to where it can get out. There is even a proposed “fourth law of thermodynamics” (the “law of steepest entropy ascent”) which says that energy transport, be it from hotter to cooler or water flowing downhill, will always find the most efficient way out, and the greater the flow of energy transport, the more quickly the efficient path will be cleared or created.
Thus the mere fact that the poles are an escape hatch for thermal energy immediately implies that global temperature increase will be strongly self-limiting. Maybe the significance of a polar escape hatch for global heat has been appreciated prior to Vinos and May, but I haven’t seen it singled out before and I’ve been paying attention for 30 years.
How did any of us I miss that? So it really is shocking that a whole field full of actual Ph.D. physicial scientists seem to have missed it too.
This is all separate from Vinos’ and May’s theory of the particular mechanism by which energy transport reaches the escape hatch, which also sounds very interesting. I look forward to examining what they have come up with, but just upfront I think it is worth breaking out the fundamental importance of the fact that the climate system includes as one of its basic features a natural escape hatch for heat.
Alec,
Very nice comment. I guess you have read Eric Schneider’s “Into the Cool.” A most excellent book.
You wrote, “In the absence of water vapor, CO2 does a much larger proportion of the heat-trapping work that gets done at the poles than of the heat-trapping work at lower latitudes, causing its small warming effect to mostly show up at the poles, but it’s still a tiny warming effect.”
But I think that this theory says CO2 *causes* cooling at the poles, because it is in warmer upper air that was transported from the equator by MT. CO2 in the Arctic helps to radiate heat to space. The Arctic warming was cause by MT, but when the Arctic warms the earth is cooling.
El Niños have a similar effect. During an El Niño, heat that had been trapped in the Pacific warm pool is vented to the atmosphere, where it can then radiate to space. The atmosphere warms, but the ocean/atmosphere system has cooled.
It’s sort of like sticking a finger in a hot cup of coffee. The finger gets painfully hot, but the coffee cools faster than it otherwise would have.
This points out the absurdity of using global atmospheric temperature as a proxy for warming. Sometimes the atmosphere gets hotter when the overall system is cooling.
Temperature is just a proxy for heat content of the atmosphere, enthalpy (BTU/lb of dry air and associated moisture) is the real measure of heat content. The moisture in air cooled the air when it evaporated and will warm it when it condenses. A 110 °F day in Phoenix can have the same total heat content (i.e. enthalpy) as 85 °F air in Miami, but the temperature is 25 °F higher in Phoenix.
It occurred to me today that the dangerous warming theory is almost childish is its simplicity. The real world is much more complex than that.
The solar-driver theory is interesting, but I don’t see the linkage between increased solar IR causing the stratosphere to warm, which then causes MT increases. How does a warmer stratosphere affects MT? But fluxtuations in MT don’t actually need a cause. Complex systems can just wander around for no reason at all. If you graph a series of 1000 random numbers from 1 to 10, you will almost always get an overall trend line that is not flat; because it is very unlikely that the first half of the numbers will exactly sum to same number as the last half. You will also see the graph line rising and falling in a quasi-cyclic way. But there is no cause for the overall trend, and no cause for the cycles. They’re just random.
The atmosphere of earth is affected by the oceans, ice, life, the sun, the moon and probably the stars (cosmic radiation). The earth’s biosphere is the most complex artifact in the know universe. Far, far more complex than a simple graph of pseudo-random numbers. The average temperature of the atmosphere can wander around, go up and down, and the primary “cause” is just the fact that the universe is random. It would be a very boring place if it were not.
“This points out the absurdity of using global atmospheric temperature as a proxy for warming. Sometimes the atmosphere gets hotter when the overall system is cooling.”
+100
Actually it doesn’t. As the effect greatly depends on tropospheric temperature gradient. And that gradient is pretty steep in the polar region, and can get inverted. In the high plateau of Antarctica the CO2 warming effect is even negative – the more CO2 in the atmosphere, the lower the 2m above surface temps (according to line-by-line spectral absorption calculation) .
https://agupubs.onlinelibrary.wiley.com/doi/full/10.1002/2015GL066749
Thanks Peter.
Follow the science they say.
But they don’t follow the science.
“According to IPCC theory, without a change in solar energy and/or a change in albedo (solar energy reflected by clouds and ice), a change in outgoing longwave energy could not happen, because energy out must match energy in.”
There must be a caveat here, because such a claim is as stupid as claiming this lava ball of ours never built a crust.
How much energy has been lost building a crust, please?
Oddgeir
It is a claim made based upon a grammar school use of arithmetic averaging. The land, oceans, and even atmosphere store energy as heat for varying lengths of time. The oceans the longest, then land, and last the atmosphere. Even albedo is an averaged number. All of these really have gradients based on time. Try to find a time variable in any of them, let alone a trig based calculation or an integral.
Try to find a variance quoted with any temperature average. Again, climate scientist folks use grammar school averages that have no variance calculations. I never see a calculation of propagating variances from daily averages all the way through to a final global average temperature! Have you?