Reposted from the Cliff Mass Weather Blog
By Cliff Mass
There are few environmental issues with more unsupported claims than the effects of global warming on sea-level rise.
And such incorrect information is particularly egregious here in the Pacific Northwest.
One of the worst offenders is the Seattle Times, which published a problematic story this week. A story that was internally inconsistent, full of obvious errors, and making claims that are hyperbolic at best.

The Seattle Times claims include (all direct quotes):
- The Washington coast could see as much sea-level rise — 4 to 6 inches — in the next three decades as it did in the previous century.
- By the end of the century, the state could see nearly 3 feet in average sea-level rise, according to the new projections, a jump from 2 feet in past studies.
- King County is expecting 2 to 3 feet of sea-level rise — and up to 5 feet — by 2100.
- Seattle has seen more than 9 inches in sea level rise since 1899 based on measurements by a NOAA tide gauge located at Colman Dock, according to King County. The new report estimates it will see about that much rise by 2050.
None of these claims is remotely true.
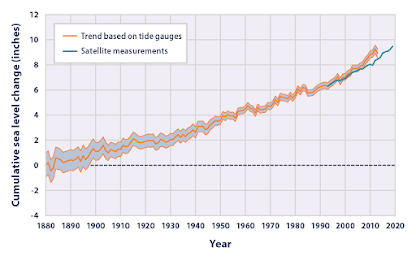
Important note: The Seattle Times article, the referenced NOAA report, and this blog talks about Relative Sea Level, sea level relative to the land. That level is what counts for impacts. Global sea level or absolute sea level is another thing entirely, and that is rising everywhere as the Earth warms. The absolute sea-level rise, as shown by the U.S. EPA, has been about 8 inches over the last century (see plot below).
Observed Sea Level Changes in the Pacific Northwest
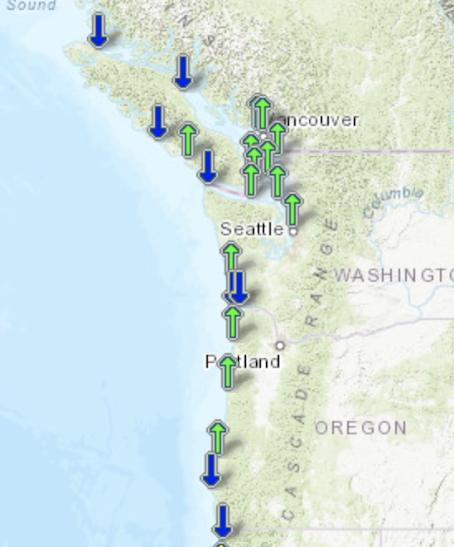
NOAA has an excellent site that provides access to sea-level observations. Below is a map from their website, which shows that sea-level trends are not uniform over the region, with SEVERAL LOCATIONS SHOWING SEA LEVEL DROPPING, NOT RISING. (blue arrows indicate sea level is falling)
I repeat dropping. And for the remainder of the region, many of the sea level increases are very modest (the size of the arrows are the same for a wide range of trends).
Why are so many areas showing sea levels falling?
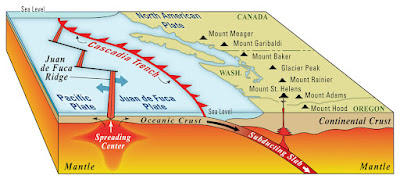
Because the land is rising, for two geological reasons. One is called isostatic rebound; the land had been pushed down by the last glaciation and is still rebounding, causing sea level to drop. And the movement of the San de Fuca Plate under the North American Plate is causing portions the Pacific Northwest to rise (see USFS figure below), resulting in sea level either falling or rising to a lesser extent.
So we have some geological protection here in the Pacific Northwest. You don’t hear about that in the Seattle Times or by certain climate activists.
Now consider one of the few locations on the Washington Coast with rising sea levels: Toke Point. Here is the plot of sea level over its record starting in the mid-70s.
Barely rising at all. At this site, there is no acceleration in sea level rise during the past decades as the Earth has warmed. None. Zip. Nada.
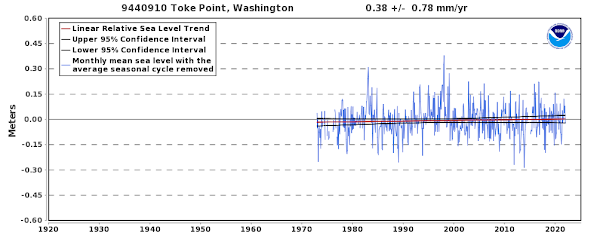
With sea level DECLINING at most coastal locations in the Northwest and a tepid rise at places like Toke Point, this claim by the Seattle Times is obviously incorrect:
“The Washington coast could see as much sea-level rise — 4 to 6 inches — in the next three decades as it did in the previous century.

A Longer-Term Look at Historical Sea Level Rise in Puget Sound (and King County)
The largest sea-level increase in the region is at Seattle, so let’s examine its observations next (see below). The record at Seattle is a very long one…going back to 1900!
Sea level in Seattle has risen at a very steady rate over the past 120 years: by approximately 2.06 mm a year or 8.1 inches per century. There is no hint of acceleration of the upward trend, even with global warming.
And importantly, the steady upward trend over the past 120 years suggests that human-forced global warming is NOT the cause, since the impacts of human emissions have only been appreciable for roughly the past 50 years.
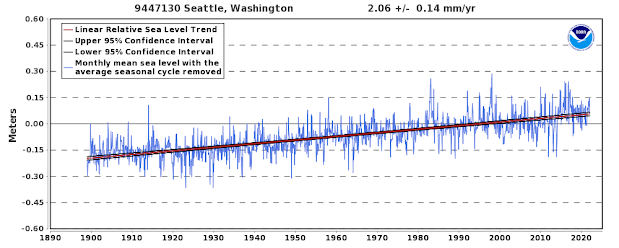
If the current rate of increase holds, sea level will rise by 2.4 inches in Seattle by the year 2050, a far cry from the 9 inches claimed by the Seattle Times.
And Seattle is the great outlier for the western interior. The sea-level rise at Victoria is ONE-THIRD as large, so the increase in sea level will be less than an inch by 2050.

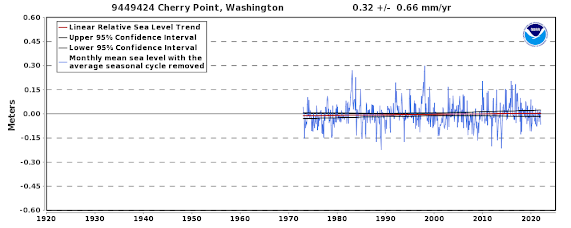
Bellingham is rising even more slowly: by about .32 mm a year (1.16 inches per century)
I can show you more, but you get the point. Sea level in the Northwest is either nearly steady or falling on the coast, and rising very slowly in the interior. Based on past and current trends, and the absence of any acceleration of the sea level rise, the sea level rise over the next few decades should be modest at best.
A very minor problem at worst. You would think that the energetic, inquisitive reporters at the Seattle Times would check what has happened to sea level before they wrote the article, and provide readers the needed perspective. They did not.
The NOAA Report
So where did the Seattle Times come up with all those excessive sea level rise projections?
They quote a new NOAA report. This report has a number of technical issues and problems. For example, a key Table (2.2) of the report claims that in the Northwest, extrapolation of observed sea-level rise trends would bring a 0.16-meter rise between 2000 and 2050. That would be 6.3 inches. As demonstrated above, that number is wildly in excess of the actual trends, which would result in zero rise on the coast and perhaps 0.5 to 2.5 inches in the western interior.
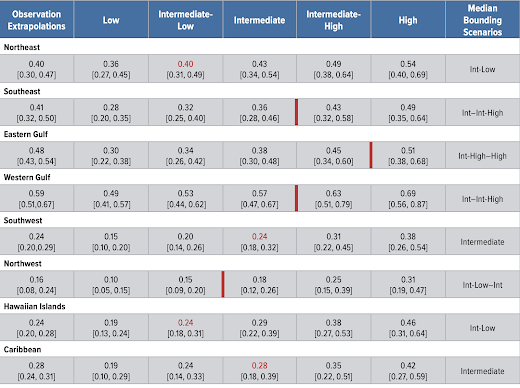
And somehow the Seattle Times increased that problematic 6.3 inches to 9 inches. I should note that this NOAA report uses unrealistic global warming predictions based on unphysical increases in fossil fuel use to get the real big estimates of sea-level rise that some folks like to talk about. Some of the numbers quoted in the Seattle Times article–as much as a 5 ft rise in King County by the end of the century–are pure fantasy.
The Bottom Line
The Northwest, like in so many ways, is highly favored to experience far lesser impacts of anthropogenic global warming than many locations. Our rising land is one reason. The slow warming of the eastern Pacific and favorable ocean current is another.
The Seattle Times article had substantial and obvious errors and attempted to make a very benign situation appear dangerous and threatening. This is not responsible journalism.
A Plea
Please don’t leave comments calling me names (e.g., skeptic, denier, Trumpite, or worse). If you don’t like my analysis tell me where I got the numbers wrong. Global warming is a serious issue that requires that all of you are well informed so that you can elect representatives that will take practical, realistic actions (such as restoring forests and encouraging more nuclear energy). I have spent some time noting the frequent exaggerations and misinformation of the Seattle Times because the flagship regional newspaper should be doing far, far better.
Maybe they mean the relative rise of feet (likely) when the Cascadia Fault gives way? Sorry, best I could think of….
They mean the dooming is seattled and no further correspondence will be entertained.
I asked a science profesor at Waikato University to send me the sea level rises around New Zealand .
They showed that some tide gauges showed a very modest rise and some showed falls because of the coast being pushed upwards by the Pacific plate.
He said that his estimate of sea rise around the New Zealand coast was 1,5 mm per year with no acceleration that he could see.
That is around 6 inchas per century nothing to get alarmed about and some thing for our great grand children to maybe erect some dykes or lift costal housed a foot or so to take care for the next 200 years.
Iam surprised that a science professor would say that He must be near retirement or wishing for a career change. Antipodean unis give short shrift to truth telling in climate matters
I won’t say his name over the internet but there are still some honest people in some of our Universities .One of our members of our Rotary club met one of his colleagues and he came and gave a very good address as he saw the world and the hyperbole enimating from some universities around the world .
I had the pleasure of thanking him on behalf of our members and I mentioned Peter Rid name who he new very well and he then gave the club a short summary of what had taken place in Australia .
There are also a lot of crooks pushing globull warming and unfortunately they have the ear of our politicians .
They PAY to have the ear of the politicians. The politicians PAY with your money through crony capitalism through regulations and subsidies.
read shukla’s gold, it is quite a profitable racket
you know I read Anathem a long while back, but until these past few years I never imagined actually living in a world where burning down all the universities seemed like a reasonable and necessary response to the circumstances
the Terrible Events have begun
FYI – You can download some sea level data for NZ yourself here…
https://www.linz.govt.nz/sea/tides/sea-level-data/sea-level-data-downloads
Seems to me, the ‘rising’ sea level is concentrated adjacent to the big cities. Certainly subsidence beneath the weight of the cities should be a first hypothesis investigated. This is well known near many large Asian cities built on river deltas. But I know there is no incentive to investigate this in designer-brained gov.
SLR is worse than a fairy tale.
https://twitter.com/AndyLSemple/status/1499238232378142722?s=20&t=IQkGgIfNGl1luCfjeWv4KA
It is quite likely that the Seattle Times got verification for their alarming sea level rise projections from Ian Miller, Coastal Hazard Specialist, Washington Sea Grant, who’s January 11th webinar was co-sponsored by NOAA’s Olympic Coast National Marine Sanctuary and Feiro Marine Life Center. He advises coastal communities in Washington State to prepare for exceptionally high sea level rise based on RCP8.5 projections. This is the dishonesty of our government at work.
Acceleration?
https://tidesandcurrents.noaa.gov/sltrends/sltrends_station.shtml?plot=50yr&id=9447130
No!
As can be shown there is a periodicity with no connection to CO2.
The rate of sea level rise has been higher during the 50 year period centred to 1945.
I wonder how much the tide gauge there varies over the course of the day. Would a century’s rise even be noticed?
Variation 3 march from -0,8 to +12,2 ft on 6 hours.
4 meters or 0,65 m/hour.
So no!
https://tidesandcurrents.noaa.gov/waterlevels.html?id=9447130
Tides do vary. On the west dike of Richmond BC tides are higher in winter. And there are King tides, publicized recently.
Cliff , you are unlikely to be trolled on this site but I am surprised that you still have a job. Writing objective truth these days is surely a dangerous occupation . Keep fighting the good fight
Climate Science™, so easy a middle school drop-out can do it!
Ooooh, that was good (-:
Cliff,
You never fail to provide objective evidence based on authentic science in every discussion. Thanks!
NOAA’s 2013 list, excluding stations with less than 60 years of data
http://www.sealevel.info/MSL_NOAA2013_60yr_thumbs.html
Another way to visualize it:
Well done Cliff Mass.
This is the right way to do climate skepticism.
Hi.
should the below say 4 to 6 inches?
”A far cry from the 9 inches claimed by the Seattle Times.”
the 9 inches is what they claim has happened but you are talking about what will happen.
Quoting the Seattle Times; “Seattle has seen more than 9 inches in sea level rise since 1899 based on measurements by a NOAA tide gauge located at Colman Dock, according to King County. The new report estimates it will see about that much rise by 2050.”
The quote does clearly state that the report estimates that there will be about 9 inches of rise in the next 28 years. One distinct possibility is that the Times is being fed disinformation by a climate alarmist group and their writers and editors are too lazy to fact check the dishonest disinformation spreaders.
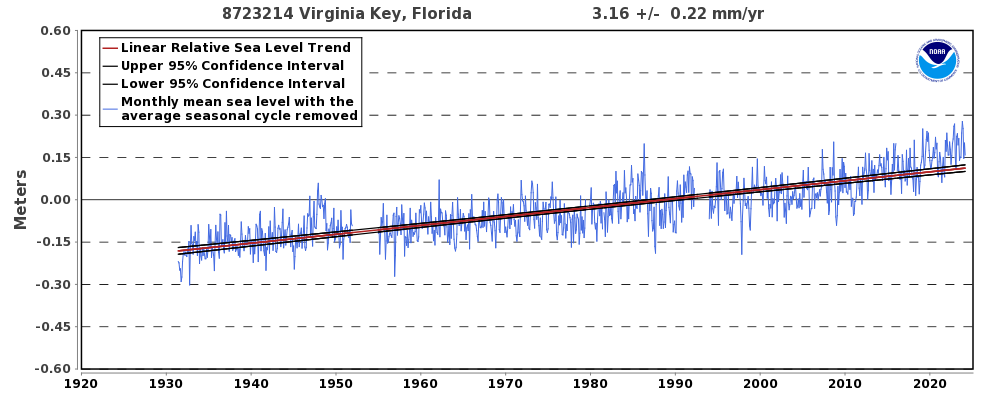
Nice data with an alternative hypothesis for sea-level changes in the Seattle area. Now if you can extend that over the globe, then you’d have something convincing to “warmers”. Sea level in Miami and other east coast locales seems to have been accelerating.
Ralph…that’s total bull crap…they started their lie in 2010…after sea level had been falling since 1988…. cherry picked the low starting point https://tidesandcurrents.noaa.gov/sltrends/sltrends_station.shtml?id=8729840
1) Tidal records in Pensacola should not be expected to reflect those in Miami because Miami levels are affected by the Gulf stream.
2) Simply eye-balling the Pensacola data, I see a sudden drop in 1950 followed by a steady increase until about 2005, then an accelerating increase to the present time.
3) Miami data intervals were increased backwards in time by 5-year intervals except for the last interval (which may be due to a data gap).
4) How do you interpret the clear rise apparent over the last 15 years in Pensacola?
Here are thee records for Miami:
I see what you mean about 1988. In context to the overall graph, I view both the peak and drop as anomalous departures from the general linear trend in the data. There was a strong peak followed by a sudden drop. However, the author’s data starts eight years later in 1996, which was not a ‘low’ year and the point of the curve is to examine rise (and show acceleration) in sea level over the 20 years prior to 2015. Picking the anomalous peak or trough around 1988 as your starting point would obviously be cherrypicking. 1996 appears to be a reasonable starting point (not cherrypicked) after a gap in the data record.
Regardless of how far back one examines the data there clearly is a departure from the linear trend in this 90-year record over the last few decades, and sea-level rise appears to be accelerating over the past 15-20 years. A curve of best fit would certainly show this acceleration. Adding the data around 1988 would 1) actually accentuate the degree of acceleration in these charts if the peak was added, or 2) limit the period of accelerating sea-level rise to the last 15 years or so if the trough was picked as a starting point. Either way, sea-level rise appears to be accelerating.
Words of the day:
Understand the difference.
Misinformation – is information that is in error by accident or from being misinformed.
Disinformation – is that fabricated with the intent to deceive as in a coordinated propaganda campaign.
I believe the examples you are giving are the later not the former. IOW I believe they KNOW they’re lying. They KNOW they’re a part of a coordinated propaganda campaign.
In my book, Hanlon’s Razor always rules:
“never attribute to malice that which is adequately explained by stupidity”
When I read the line “This is not responsible journalism.” in the Cliff report, I thought the actual comment should be something like “This is straight-out lying, done to advance a (leftist/socialist) agenda.” Then reading ThinkingScientist comment one realizes there is a mixture of lying and stupid.
Only the stupid lie because they don’t realize that they can and will be exposed, and their credibility will suffer. Thus, the very thing that they were trying to support will be undermined. Long-term, their actions will be counter-productive.
My definition of an unethical act is when someone trades a short-term gain (such as theft or lying), for a real or even potential long-term loss (such as jail time or loss of reputation).
Actually, Clyde, lying is a smart strategy if you can get people to believe that it is immoral to call you on the lies. Consider transgenderism. No sane person could actually believe that Bruce Jenner is now a woman, but many, many people will pretend to believe it because they believe it is wrong to question it.
Belief in anthropogenic climate change is like religious belief, in that the very act of asking, is this true? is a sin. If you’ve ever tried arguing with a devout Christian, you just run into a wall. Devout Christians know perfectly well that their beliefs are wildly irrational, which is why they are so proud of holding them. Faith is the capacity (and God values it about all other capacities) to believe in something that is clearly irrational. The possession and cultivation of faith is an achievement, and a signifier of moral superiority.
I find Christianity very rational having spent too much time in secular thought. There are may great men through history that agree with me. I pick one, Dietrich Bonhoeffer “Letters and Papers from Prison” This quote is long but I believe fits what you wrote above;”Stupidity is a more dangerous enemy of the good than malice. One may protest against evil; it can be exposed and, if need be, prevented by use of force. Evil always carries within itself the germ of its own subversion in that it leaves behind in human beings at least a sense of unease. Against stupidity we are defenseless. Neither protests nor the use of force accomplish anything here; reasons fall on deaf ears; facts that contradict one’s prejudgment simply need not be believed – in such moments the stupid person even becomes critical – and when facts are irrefutable they are just pushed aside as inconsequential, as incidental. In all this the stupid person, in contrast to the malicious one, is utterly self satisfied and, being easily irritated, becomes dangerous by going on the attack. For that reason, greater caution is called for when dealing with a stupid person than with a malicious one. Never again will we try to persuade the stupid person with reasons, for it is senseless and dangerous.”
George ==>. + 10
ACG is not a “religious belief” because there are several inconvenient facts (e.g., CO2 = GHG, GHG emissions and levels in atmosphere rising) and lines of evidence to support it.
What’s happening in the atmosphere with the major GHG gas– H2O?
Water vapor is the principal GH gas. It’s also a dependent variable driven by temperature, which itself is driven by CO2. Atmospheric CO2 is the independent variable in this situation. Generally, water vapor will increase with temperature if water is readily available.
In the past, factors that boosted solar irradiance and retaining energy on earth become the independent variables driving temperature, which drives increased release of CO2 and uptake of water vapor. That’s why CO2 often lags behind temperature in the geological record. Pointing to a lack of correlation over geological time periods as evidence that CO2 atmospheric concentrations don’t drive our CURRENT climate situation is a failure to recognize the unique situation we’ve been seeing the last 60 years.
I’ve been reading the literature searching for another variable that might explain the temperature increases we’re seeing for decades. That’s why I visit WUWT and other AGW skeptical sites. Unfortunately, IMO, none seem to fit our situation now except rising atmospheric GHG levels driven by the augmentation of the natural carbon cycle by burning long-buried fossil fuels.
Great, Hanlon’s Razor.
Now explain this:
1) NOAA, the largest research organization in the US govt.
2) Some of the nations top scientists get billions and billions in taxpayer money from congress every year.
3) In spite of all their formal scientific training in the physical sciences, and with all the lavishly funded resources at their disposal, they are incapable of properly interpreting tide gauge data. Something most of us would consider an undergraduate science problem.
You say:
“In my book, Hanlon’s Razor always rules:”
What do you mean by this Do you mean that you always atribute these sorts of things to stupidity?
If so, explain how items 1, 2, 3 above are the product of stupidity.
Hanlon said:
“that which is adequately explained by stupidity”
What then are to do when stupidity comes nowhere close to adequately explaining a situation.
“attribute to malice” works for me.
There are different kinds of intelligence and stupidity. Someone may be very good at manipulating mathematical symbols, but poor at comprehending the bigger picture. An idiot savant might be an extreme example. I find that many of today’s graduates have the ability to be good technicians, but don’t rise to the level of a scientist. But, society has to do something with all the graduates being pumped out of the diploma mills, so they give them money and call them scientists.
And then of course there are the statements from various “experts” that they must lie because they believe the emergency is such that it is justified.
The School of Mannkind??
So you actually think that the majority of those pumping the BS out BELIEVE IT? That they have good intentions even when they ignore the fact that NONE of the previous claims of disaster have proven correct? That their failure to revisit and question the sources that make those claims of disaster after their dire predictions fail to materialize is just an honest oversight? That the fact they go back to those same sources and continue to call them “experts” and broadcast their new claims even though their prior predictions have failed to appear is just accidental?
I think your razor needs sharpened.
Hi, rah,
No need to explain if your answer is “No,” but, are you taking part in the wonderful national truckers/others convoy (part, “The People’s Convoy,” started in Adelanto, CA in Feb.) to D.C., arriving ~ 3/5/22? They are coming from ALL over! Washington, Montana, Utah, California, Arizona, Texas, Oklahoma, Missouri, Indiana, Maine…. and, well, ALL OVER 🙂 .
The videos documenting the participants and those cheering them on on overpasses across the United States are SO HEARTWARMING.
America IS! 😀
Keep on truckin’. 😊
Janice
(still praying for you daily in my “professional drivers and pilots” list)
I drive a company owned truck. They determine the locations to where I drive that truck. There is an extreme shortage of drivers and so I have been kept very busy for many months now.
Last Tuesday I was headed to my home terminal in Anderson, IN from a three stop milk run in Marion, IL carrying parts for Toyota.
On the way back I saw a wonderful sight. There is one of those huge crosses in Effingham, IL right next to a Becks seed facility on the west side of town.
As I junctioned onto I-70 East from I-57 North I noticed a big American flag flying from a crane at the Becks facility. Then at the cross there were 100’s of people with flags and signs waving to all the trucks as they went by.
Nearly every overpass had people on it with flags and showing signs and waving. Those closest to Effingham had so many people that they were on the ramps also.
This went on right into Indiana.
The signs ran from “Lets Go Brandon” to “We The People” with many others. I waved as I went under every one of them and at the ones where someone was pumping their arm hit the big horn.
They are there of course to show support for the Freedom convoy but were waving at every truck as we went under.
I suspect some people got an education about just how many big trucks there are on the road.
How cool!
Thank you for coming back with that. Glad you got to experience that America IS!
*HONK!*
*HONK!*
😀
Come August I turn 67 y/o but I’m still trucking and have been doing a gig that most younger drivers will not or cannot do.
I get paid a salary to be on call to take the loads that don’t get covered or for which drivers call off. That means the loads that are less desirable for some reason, or this time of year, loads the regular driver called off of because of poor road conditions due to weather.
One good thing is that since I refused the jabs, I don’t have to go to Canada anymore.
: )
BTW Janice,
Thank you for your prayers. Yours and others have gotten me some pretty bad road conditions this winter. Road conditions where I could not drive faster than 25 mph because the road surface was a sheet of ice.
Twice this winter I have had to pull over and take an unplanned 10 hour break due to road conditions. There would have been a third time except an Indiana State Trooper pissed me off so badly by running me off from where I was parked on a ramp when conditions were terrible and I had run out of legal drive time.
I do my best to avoid taking a 10 hour break on a ramp but that time I was out of hours and the truck stops and rest areas were full. So I pulled off and parked on the wide shoulder of an entrance ramp at the 215 mm on I-65 S in Indiana.
State trooper ran me off. No use arguing with a bone head with a badge and a gun. But I was so pissed that I drove the 128 miles to the terminal even though it took me 3 1/2 hours to do so. I wasn’t going to sleep anyway after that BS.
You’re welcome (glad to).
And, WHAT — A — JERK!! You should be proud of yourself for your EXCELLENT self-control. I would probably have gotten a ticket for whatever infraction he or she could dig up that would cover my telling him or her exactly what I thought about that.
Sigh. MOST police officers are WONDERFUL human beings. About 10% are just common, playground, bullies. His or her co-workers probably get a lot of joy when they look at the schedule and see, “Oh, joy. I get to work with ‘By the Book Bully,’ today.”
It is illegal to park on ramps in Indiana but plenty do it as a common practice. I selected the ramp I did because I knew it has a wide shoulder and in snow cover one needs that knowledge to know they are off the normal travel lane.
After I departed I noted that every exit with a truck stop I passed had trucks lined up on the shoulders of the on and off ramps.
🙄
These are not stupid people; they are highly trained government, NGO and crony capitalist employees pushing socialist political and collectivist economic narratives. There can be no excuse for people working in the climate arena to not know basic facts. The fact that official UN and U.S. government reports are allowed to continue to attempt to influence peoples’ opinions, much less ought right lie, is a travesty of science and democratic rule.
Sure – for a one time error. Hanlon’s Razor does not apply to behavior repeated over decades.
Here, the mal-information, given the knowledge and intelligence and education of the authors of that report, is not adequately explained by mere stupidity.
rah is highly likely to be correct.
“coordinated propaganda campaign”
Here is a quote from a letter published on The Guardian’s letters page 2nd March amongst several letters about the latest IPCC report.
“And to those leaders still intent on murderous land and profit grabs, there is no need to waste money on tanks and missiles; the climate will snatch away your land and will kill your children anyway.”
As it turns out, SLR is a perfect topic for the “amateur Climate Science” person. Surf on over to the NOAA tide gauge website and grab the tide gauge data of your choice. Now you can graph it up. After all, who does not like a pretty picture. Then comes a bunch of statistical analysis.
First a linear best fit to the data. An ordinary least squares, if you like.
Y = a + bX
Now you have the rate of SLR, go for both mm/yr and in./century.
Next on the agenda, an X^2 polynomial least squares.
Y = a + bX + cX^2
Your c term is the acceleration, watch it fluttering hard by 0.00.
As a bonus, calculate and plot the 95% confidence level boundaries. Marvel at the noise level in the data, yet over the limits of the record, the boundaries are as tight as the nylon stockings on the legs of a June Taylor dancer.
Finally do a test for significance by calculating the “wee p-values”. {With a H/T to Matt Briggs}
Yes, one and all, you can do this at home. No adult supervision required. No, you will not blow yourself up.
From time to time, we have heard the wonders of the R programming language for statistics, data plotting, and data analysis of every stripe. This would be a great project for somebody relatively new to the R language.
Surf over to CRAN, grab the R language and then R-Studio.
Have at it.
Now, where is the fun in that? I remember an experiment to test for oxygen in my college freshman chemistry class. We were instructed to melt and boil 5 gm of potassium chlorate in a test tube, and then slowly lower a glowing splint into the test tube to observe it being re-ignited.
I used 10 gm in a slightly larger test tube, dropped a flaming splint into the boiling liquid, and observed the splint being consumed at the same rate as gravity was causing the splint to fall — all the while a purple flame shot out the top like a small rocket engine. I probably learned more than the other students did. However, today, if they still use the same ‘dangerous’ chemicals, I’d probably be expelled for my reckless, and insubordinate behavior.
Remember, safety above all else!
Not everywhere, not everywhere, as this photo of the stranded Italian mermaids confirms. s/c
 ?
?
Oh my Gawd. This is horrible. How can people be so callous, uncaring, and just plain mean.
Why, oh why did nobody drag these mermaids back into the water? The proper way to handle this rescue is to get them into water over their heads, perhaps ~2 meters deep. And then keep them out there until they revive and get their senses and proper orientation back about them. Then, with luck, they will just swim off, little the worse for wear.
Pro tip:
When you first get them in, there is bound to be hell breaking loose with kicking, yelling and screaming, and general vigorous thrashing. Ignore it all, all that fuss is the disorientation which caused them to strand in the first place. All that fuss will fade as the ocean therapy has it’s good effect on them. Then they will become very docile. They may even appear to be half drowned. Do not be concerned, they are mermaids.
Really, do not worry about it, they will be fine.
{did somebody say “give them what they ask for”?}
No need for concern, the Extinction Rebellion is attending to it.
Problem is mermaids were swimming backstroke, they need to try the breaststroke (i’m in a bit of trouble here).
No, I think the Extinction Rebellion mermaids need Help.
We should Help them. I also think we know how to Help XR protestors.
What would be fun is to show up a as good sized bunch carrying a GREENPEACE banner and signs proclaiming you are from the “Sea Mammal Rescue Foundation, the signs also bearing the Greenpeace logo.
Have the SMRF people drag their mermaids into the water while the Greenpeace people run interference with the XR crowd.
At the end of the day XR will be furious at Greenpeace.for trying to drown their mermaids. They will retaliate. Greenpeace, having no idea what is going on will reciprocate in kind. Before you know it, we have a Huge Civil War between the two preeminent radical European environmental organizations.
What could be more fun than that??
{What. Who, me? Did I start something?}
If they are asking for sex, where does a guy start? Geoff S
With a little wine for the stomach.
Its worse than we thought. This proves that mermaids have been driven to extinction.T We will get the Unicorns next.
Those look like Disney Mermaids with the bikini tops.
Since they are a non-native species its perfectly acceptable to permit them to expire.
The rate of sea level rise appears to be consistent over the 140 years of measurement, not that 140 years is long term data. The doomsayers claim rates of increase that are inexplicably over 10 times the recorded rate. Just where is the data to support this?
It certainly is not scientific to make claims of an increase in the rate of something you are measuring when the data do not support the claim. Even if the claim is made by someone not directly involved, it is the responsibility of those involved in the collection and collation of the data to call out those that misrepresent that data, even at the risk of their careers. Those that turn a blind eye to the pseudoscience and misrepresentation of real science will eventually bring discredit to science in general and eventually catastrophic discredit to themselves.
Those that blow the whistle on the scientific fraud will eventually be seen as heroes. Those that go along with the fraud or willingly partake in the fraud, bribed by Fame, Fortune and Funding will eventually be caught out. The more they squeal and lie to cover their backsides, the greater the public anger will be when the SHTF eventually. The truth eventually prevails.
Lysenko is a classic case. While he had the support of Stalin, he lived high on the hog, but once his protector was no longer there, he was exposed and his name permanently associated with such gross scientific fraud. Mind you, Anthony Fauci is set to topple Lysenko in the tyrannical pseudoscience list of mass murderers. If you look at the modus operandi of Lysenko, Fauci and a certain litigious “climate scientist” who does have a face that resembles a pig , you will notice a similarity. They all engage in sabotaging the careers of those that oppose their far-fetched hypotheses. They all ride high on the hog from taxpayer funds. They all use fear and repression of anyone that opposes them.
An essential read is Robert F Kennedy-the Real Anthony Fauci. You will notice a distinct similarity in MO with the global warming/ “climate change” narrative. The comparison with Lysenko should also be plainly obvious.
They are not using data; they are using models of their choice driven by assumptions of their choice. What they get furthers their careers and pushes the Leftist agenda.
For predicting the future the Simpsons are the experts.
Another ‘expert’ failed prediction came from Cliff Stanford a dotcom multimillionaire who sadly died the other day.
“Don’t waste too much time on the internet. It’ll be gone in another year.”
The graphic with the green and blue up/down arrows is simply epic and shows with crystal clarity what is is going on with ‘Observed Sea Level Rise‘ (SLR)
Start with 2 basic observations:
What got me going was/is am endless fascination with water and the long-remembered factoid (which I may have remembered wrong but the general idea applies just the same)..
i.e. The centre of The Indian Ocean is about one metre shallower than it ought to be
Primarily reason always given for that is because of Evaporation – the water near the centre is being picked up by the wind and blown away – to fall as rain somewhere
BUT but but, is not an equally valid way of saying that is that the (rain) water that fell on the land all around the ocean cannot flow back into the centre fast enough to fill the hole created by El Sol evaporating the water there
Now, brown flood water tells us that the rain falling on the land is rushing downhill off the land with much greater vigour than it previously did used to.
(This being where we need records of what colour flood water used to be centuries ago – but nobody bothered and why should they?)
But simply think about the amount of soil material contemporary ‘floods’ are carrying and run that backwards for a few million years – would there *any* land left by now?
Another factoid concerned large tidal estuaries, of which the UK has plenty.
It is that as water exits a river and goes out into the open ocean, for every 2 metres it moves out, the tide brings it back one metre.
Put that lot together and you have the graphic with the green blue arrows.
especially near Vancouver where geography means the water now racing down the rivers in epic blasts (we now call Floods) cannot get away from the land fast enough to level itself out – a combination of water’s viscosity and geography.
Thus, observers on Vancouver’s shorelines will see higher tides than if the water had drained out of the rivers, as it used to, much more slowly and could thus escape before the next deluge occurred.
A ‘deluge’ being caused not by more rain, but by more rapid draining of the watersheds
Geography would also include, apart from the obvious shape of the coastline near Vancouver (and other places around the globe) but also by the depth and outward extent of the Continental Shelf.
Hence why some places have lots of SLR = shallow shelf that extends a long way out.
And why others have low SLR, a deep shelf that falls away quickly as you move offshore.
(Same reason ‘surfers’ go to certain places/beaches/locations/countries and not others)
Mix that all together with what the farmers, de-foresters and city-builders are doing up on the watershed and ta-dah – there you have it.
i.e. Global Sea Level Rise that is different, often negative, everywhere you look
So very simple innit – when you start to get your head around water.
Wonder if water has any other effects on the observed world around us, it really is amazing stuff and Totally Perfectly Unique
(I could have nicely introduced that big word I learned, the word invented by The Good People of The Netherlands, as it really does apply here. Maybe next time eh)
missed the edit but this is gorgeous in so many ways.
You have to look at the picture AND read the words, especially the words of the ‘Local Authority’
The Denialism I raved about previously is palpable.
Because, The Council claim not to know why what happened in the pictures.
Yet, look at the background in the picture
A place called Lyneham Banks and if the word ‘bank’ doesn’t give you or anybody a clue. sigh.
What happened on the ‘bank’ in the background can ONLY have occurred via The Council having given their full approval and blessing.
(It’s called Planning Permission here in the UK)
And what happened on the bank caused what happened in the Main Story and – you saw it coming didn’t ya – is what causes Sea Level Rise
Yet The Authority responsible for creating that mess is in absolute denial.
While blaming Storm Eunice, itself a child of climate change and thus they blame everybody else.
While they sit in their chambers deciding by how much to ramp up taxation to pay for Climate Change remediation and ‘Social Care’
The ‘care’ bit is lovely because the ‘caring’ is mostly required for people who have lost their marbles.
no laughing this time. cry.
https://www.wiltshirelive.co.uk/news/wiltshire-news/road-damaged-storm-eunice-could-6717735
(Also a story that ran here recently about a road leading to Vancouver being closed due to landslides in turn due to Climate Change – they couldn’t get the lumber out because of it)
A Longer-Term Look at Historical Sea Level Rise in Puget Sound (and King County)
…
There is no hint of acceleration of the upward trend, even with global warming.
________________________________________________________________
Here’s the link to the Permanent Service for Mean Sea Level for Seattle:
https://www.psmsl.org/data/obtaining/rlr.annual.data/127.rlrdata
Down load that into Excel and plot out the graph with a 2nd order polynomial trend and click on [Display Equation on chart] and it delivers:
(y=0.0047x²+1.4796x+6945.8)
where two times the x² value equals 0.0094mm/yr²
An acceleration of 0.01 mm/yr² is typical of long term tide gauges around the world. A far cry from the 0.98 mm/yr claimed by Colorado University’s Sea Level Research Group LINK
Saying that there’s no hint of acceleration isn’t exactly true. However claiming that there will be nine inches of sea level rise by 2050 (requires a rate of 8.2 mm/yr) is bullshit.
>> Saying that there’s no hint of acceleration isn’t exactly true.
The fact that you can fit a model to some short, noisy data series (I did not plot your data set, but I guess it still falls under that), by itself does not proof much.
Using your numbers indicates that about 70mm of the 250mm rise there comes from a quadratic term.
You model is certainly incomplete as most sea level data shows a longer oscillation.
Like many climate modelers you do not seem to believe in uncertainty, otherwise you would need to discuss them as part of your fitting parameters or systematic model shortcomings and then show how your model provides a significant better fit than let´s say a linear trend with a long term oscillation.
One fit alone only hints that this is an incomplete observation.
Laws of Nature’s post is an example of what people skeptical of the Climate Crusade should avoid. Lashing out and assuming a whole lot of stuff with out verification should be avoided.
Temperatures since 1850 have risen about a degree some of which is due to CO2. Human activity is no doubt a significant cause or maybe the only cause of the increase of atmospheric CO2. Most every thing else the Climate Crusaders claim is bullshit.
“Lashing out and assuming a whole lot of stuff with out verification should be avoided.”
Very Good! Verify first, good. Sounds like a plan.
“Down load that into Excel and plot out the graph” – Check, Done.
If you do not mind I will use my R-Studio, after all, I sis make a comment above, advocating the use of R.
“2nd order polynomial trend” – Check, lets see what I got in R.
“(y=0.0047x²+1.4796x+6945.8)” – What you got, copied
Me:
y = 0.004697x² + 1.489x + 6947
OK, agreement is excellent, the situation is most satisfactory.
Finally, test for significance, calculate our great “wee p-values”.
For significance, we must have a p-value *less than* 0.05. this is the standard value for significance at the 95% confidence level.
Lets see how we did:
Intercept: 6947 p-value < 2e-16 {that’s a wee p-value}
slope: 1.489 p-value = 1.67e-05 {again, very wee}
acceleration: 0.004697 p-value = 0.0769 —- EEKKK!! NOT BELOW 0.05!!!!!!
Claim:
“An acceleration of 0.01 mm/yr² is typical of long term tide gauges around the world.”
FALSE! BUSTED!!! Your own data shows 0.0 acceleration. What you see come out of the calculation is *not* significant at the 95% confidence level. Acceleration is indistinguishable from 0.000. Any number you do see there is just the results of random fluctuations in the noise in the data.
This is another long data set, have some fun. Knock off 10 years at the end, and recalculate. Take off another 10 years, recalculate again. Do it a few more times. Watch the acceleration term dance around like a circus clown.
*Not Significant*
Thanks for the reply. It’s nice that you checked my example. I said and you quoted:
“An acceleration of 0.01 mm/yr² is typical of long term tide gauges around the world.”
In 2020 I downloaded 61 annual records with ~100 years of reasonable data from the Permanent Service for Mean Sea Level PSMSL:
And these 53:
Aarhus, Astoria, Baltimore, Boston, Brest, Charelston I, Cuxhaven 2, Delfzijl, Den Helder, Esbjerg, Fernandia, Frederica, Fremantle, Galveston, Galveston, Gedser, Harlingen, Helsinki, Hirtshals, Hoek Van Holland, Honolulu, Hornbaek, Ijmuiden, Key West, Kobenhavn, Korsor, Kungsholmsfort, La Jolla, Los Angeles, Maassluis, Marseille, New York, Newlyn, Olands Norra Udde, Pensacola, Philadelphia, Portland ME, Poti, Ratan, San Diego, SanFrancisco, Seattle, Sewells Pt, Slipshavn, Stockholm, Sydney, Travemunde, Trieste, Tuapse, Victoria, Visby, Warnemunde 2, and Wismar 2,
Had acceleration values of between
0 mm/yr² and 0.03mm/yr²
derived by doubling the x² value from the Excel chart.
And 22 of those 53 stations had acceleration values of
0.01 mm/yr²
So a claim that an acceleration of 0.01 mm/yr² is typical
of long term tide gauges isn’t out of order.
Dave Burtons Sea Level page for Seattle shows:
acceleration = 0.00931 ±0.00891 mm/yr²
You could look up those 53 stations on his site to see that acceleration ~0.01 mm/yr² is not far off the mark.
A short Google search on “sample size of over 30” finds the following quote:
Sample sizes* equal to or greater than 30 are
often considered sufficient for the CLT (Central Limit Theorem) to hold. A key aspect of CLT is that the average of the sample means and standard deviations will equal the population mean and standard deviation.
*I add samples of “variable data”
So I stand by my claim that:
“An acceleration of 0.01 mm/yr² is typical of long term tide gauges around the world.”
Steve,
The central limit theorem applies strictly to numbers that are collected in the same way, like pixel voltages going into a TV set. Once you go to different sea level sites, you introduce extra variables like different makers of instruments, different local subsidence rates and many others. Some consider that these variables can be overlooked, but this is an expedient approach that can carry errors of accuracy in particular. Geoff S
Human activity is no doubt a significant cause or maybe the only cause of the increase of atmospheric CO2.
Prove it.
Or, at the very least, provide data that makes your assertion “more likely than not.”
Hi Jan, I ran the numbers once by googling world wide coal oil and gas production and estimating how much was combusted and figuring out the atmospheric pressure component of CO2 etc. and it came out pretty close.
I’m not going to run through the details more than that just for you, but I do invite you to do the same.
You have no data which proves your assertion (of March 4, 2022, 7:14 am).
I already knew that.
Just commenting here to prevent you from misleading those who may be unsure.
The formula — or model — used for making tide tables uses many factors that have different phases, which results in constructive and destructive interference. Short of analysis of the formula, or Fourier analysis of the raw data, it is difficult to know just what the length of the longer “oscillation” is.
Curve fitting is a wonderful toy… Reminds me of when, for a stats class some dozen years ago, I analyzed the temperature series from Tombstone, one of the very few long record stations around here without UAH or site change biases.
A linear trend line showed no change whatsoever. For the class, I ran polynomial fits – with a fourth order one, I managed to get a decline – of (IIRC) 0.03 degrees Fahrenheit. (Not Celsius, this was a business class and would have been confused).
I would swear that some were disappointed when I hit them with the lesson of the exercise – that you can manipulate anything out of a data set, but your result, unless you know exactly what you are doing, is completely meaningless. I don’t know, maybe some of them were hoping for a ski slope on “A” mountain? (A largish hill just west of downtown Tucson.)
Steve ==> That idea that one could “find” “some hint” of acceleration in Seattle’s 120 year tide gauge record is fallacious. Using enough maths and stats methods could find an elephant in an anthill.
The 120 year record stands on its own and needs no “verification” and will stand no “refutation” by Exel. If there had been ANY acceleration in RSLR at Seattle, the graph would SHOW it — if it doesn’t show, it ain’t there.
Tide Gauge records are too variable on too many time scales to throw stats at them. Waiting another ten years will change the “stats” — moving the time window will change not only the numerical result but the sign — this fact alone will prove that the method is not valid to find real world results. Ya get numbers, ya get “facts” but ya don’t get the Truth.
The Truth is that relative sea level at Seattle (and Vancouver) is rising linearly with no acceleration or deceleration (which, technically, isn’t a thing.)
Kip
Did you read my response HERE and did you follow the link to Dave Burton’s web page? Did you give it much more thought than looking at some graphics that “look” straight? Did you consider that 53 of 61 tide gauge records come out to ~0.01 mm/yr²?
Backing an opinion that isn’t true is foolhardy. If the other side is right about something, the best course of action is to beat them to the fact and point out that it doesn’t mean what they claim it does.
Maybe I should put together a distribution chart showing that 0.01mm/yr² is the central value for PSMSL tide gauges with 100+ years of data.
0.01mm/yr² isn’t much and IF it were to continue for 100 years the rate of sea level would increase by ONE millimeter per year.
Thanks for your reply.
Steve
“0.01mm/yr² isn’t much and IF it were to continue for 100 years the rate of sea level would increase by ONE millimeter per year.”
*sigh*
total rise would be increased by 5 cm, actually, or 50 mm. That would actually show up. It does not seem to.
What did you say, an Excel type of guy?
I posted above about getting on with R, visit CRAN get R and R-Studio.
Run with the Big Boys. You should listen.
Thanks for all of that.
Steve ==>. Never fear – you know we agree on the important stuff. The data is simply too variable on too many scales and too many level’s to be subjected to analysis which finds such a tiny effect,. Basically meaningless even if real. Real means one has to have had considered the original measurement uncertainty,. All the confounders.. the uncertainties from mixing apples-and-orange’s – pretending that Relatives Sea Level’s from disparate location’s can be compared legitimately.
There is simply no significance in a number the takes no difference.
There are literally hundreds of RSLR graphs with long record’s that are linear over their entire length –. With a lot of variations at all scales.
The error of applying the general to the specific. Just as bad as applying the specific to the general.
“Please don’t leave comments calling me names (e.g., skeptic”
What is wrong with skeptic? I try to be a slave to reason and proof and would be delighted to have it publicly acknowledged.
I like “dismissive” that was in a post here at WUWT the other day. Might actually result in more debate in the media.
Due to over-use the word “skeptic” has taken on extremist connotations in the climate field, that are a long ways from its roots in scientific study. “Dismissive” has a connotation that there are reasons to dismiss the claims as highly exaggerated…admittedly a subtle use of English language terminology…
And for those who think this was cherry picking, it doesn’t matter. Go anywhere and you find no or insignificant acceleration. This long term tidal gauge graph shows what you will find over and over
. https://tidesandcurrents.noaa.gov/sltrends/sltrends_station.shtml?id=120-012
If you have time to review the literature there is also confirmation of lack of significant acceleration like this paper which found 0.0042+-0.0092 mm/yr for global SLR.
The error bars, more than the actual numbers, says all you need to know about how much certainty anyone should have about the general state of our knowledge about sea level rise.
https://agupubs.onlinelibrary.wiley.com/doi/full/10.1002/2014JC009900
People don’t seem to realise this planet is a “contained world” !!! No water comes from “outside” our globe but is sucked up from the seas and falls back into the sea. Most of what we measure as sea level drop or rise is the land rising and falling. New islands rise from the sea and therefore the sea level may appear to rise or fall – but nothing has actually changed !
There are periods of extreme glaciation and those do effect sea level rise. There are ancient cites that are now underwater, and some places that are now hundreds of meters away from the sea. I am not worried about any severe melting of the Antarctic or even the Arctic right now however.
This may have had no impact on tidal gauge readings for Seattle, but between 1897 and 1930, five separate regrade projects were carried out to essentially remove Denny Hill and wash it into Elliot Bay. See here.
The first four used giant hydraulic cannons to wash the mud slurry down the hill. The last one in 1929-1930 used steam shovels, giant conveyor belts and self-dumping barges as the surrounding area had been too much developed to use the prior method.
Between all five projects, a total of 11,112,025 cubic yards (8,495,753 m3) of dirt was removed from Denny Hill and dumped into Elliot Bay.
The project was made easier by the local geology, which left Denny Hill as a large pile of soil and very little rock:
I recall being told that some of the soil from the regrades was used to raise the streets at the waterfront, which regularly flooded at high tide. You can take a tour of “Underground Seattle” and see the remains of some buildings at their original elevations.
In other words, some of the apparent sea level rise in Seattle may indeed be man-made.
Good and timely post Cliff, this very discussion came up here in the North Bay region of San Francisco. I provided the NOAA sea level graph for Alameda Ca. for the discussion and people almost couldn’t believe what they saw. Some of the more indoctrinated readers claimed that, yes, the observed sea level record is a linear graph with little slope but to extrapolate that linear behavior out into the future was a “model” itself so no better than the failed computer models.
In the lengthy discussion I did see signs of hope. Not everyone is following in lock step to this catastrophe narrative. About 4 out of 20 main posters on the thread were pretty well informed and could cite the failings of the climate models and the IPCC shenanigans. Thanks again Cliff for a good post.
Really not surprising, given how much faith has been placed in “models” (that are not based on actual measurements) for the past 25 years.
There’s really a place near Seattle called Toke Point?
Coffee and cannabis. That’s Washington.
Cliff, could you please explain this, “ Global warming is a serious issue…”?
Yes. Inquiring minds want to know… 🤨
since, as of today, there is no data backing up this statement.
The clue for me was the fact that all the usual suspects in supporting the globull warmin’ thing, and every other crackpot scheme to fleece money out of the workers, seem to live on the coasts. Or at the least, own expensive retreats right on the beaches which the AGW crowd are predicting to be under water soon.
Yeah, right. They know their data is BS and, by their behavior everyone else should as well.
Having lived in the PacNorwest for a long time, I’d expect a major quake is what will change the sea level on the coast.
Cliff ==> What you say about Seattle is true (almost) everywhere. Nearly ALL long term relative sea level rise graphs look like the one for Seattle — despite a lot of variation month to month and year to year, the long term trend is near-perfectly level — meaning linear — no acceleration (late correction — kh)
If there is any sea level rise acceleration, it is not arriving at the ports and harbors where sea level is being directly measured. This begs the question, if not at the ports and harbors? then where is it?
The Shadow knows! It is the evil that lurks in the heart of men whose egos know no bounds.
APPLAUSE! 👏 🙂
(one qualification: I would edit it to “…in the heart of [people]…”)
“The Seattle Times article had substantial and obvious errors and attempted to make a very benign situation appear dangerous and threatening. This is not responsible journalism.”
***********
That isn’t journalism at all…period. If there is any adherence to journalistic standards and ethics out there — anywhere — anymore, I am finding it increasingly difficult to detect.
I have always thought that journalists are supposed to be neutral and uninterested third parties when it comes to reporting on most anything. Coupled with the lack of scientific literacy at organizations like the Seattle Times (among many others) today, journalists have morphed into activists for the climate alarmist and energy issues, just to name a few.
War and activism have one thing in common: the truth is the first casualty of both — unless the truth serves the activist’s and war mongerer’s purpose and goals. The problem is that all too often it does not.
As I have said before, a real-world Orwellian Big Brother is out there, and it has numerous components to it including the so-called “news” organizations. They have their own thought police who waste little time in attacking thought-criminals who do not toe the proper party line. With the war in Ukraine, where else do we see that happening today?
And in spite of all this bluster and laughable cherry-picking on the part of Mr. Mass, the reality remains that global sea levels are rising.
By a steady 2.5mm per year, thats the sea level. The land level in most areas is also rising or sinking by different amounts just due to natural causes or if you want to give it a name …Geology
Barry ==> Are you trolling or being serious? You are objecting to something Cliff Mass hasn’t said or intended to say. Of course global sea level is rising! and of course the sun will rise on yet another day tomorrow ….. Everyone (as far as I know) knows that “global sea level is rising” and that it has been rising for the last 250 years. Cliff Mass says nothing counter to that trivial (meaning obvious) truth. Since I write about Sea Level and its rise and fall here a lot, and follow all essays on sea levels closely, I can assure you that you won’t find any disagreement on your point here.
If you meant to make some other point — let me know, I’ll see if I can answer your questions.
Time of Emergence of detectable SLR-
Present-day sea-level rise can be traced back to 1800s (witn.com)
Charles ==> And what do you think that paper means?
Barry,
Did someone say it isn’t rising?
Swim for your lives.
These are obvious huge exaggerations. The Times should be held accountable. I would like to see them on the witness stand explaining why they are deceiving their readers. Have you sent your article to them?