From the universities of Kyoto & San Diego comes this old tired catchphrase, along with a polar bear picture to go with the press release.
Is a warmer Arctic a canary of global warming?

CREDIT Kyoto University
Since the 1970s the northern polar region has warmed faster than global averages by a factor or two or more, in a process of ‘Arctic amplification’ which is linked to a drastic reduction in sea ice.
But then how to explain a similar rapid warming that occurred during the early 20th century, when the effects of greenhouse gases were considerably weaker than today? And what can we prove about the period, given the scarcity of usable data and observations prior to the 1950s?
Now scientists from Kyoto University and UC San Diego have discovered that this phenomenon occurred when the warming phase — ‘interdecadal variability mode’ — of both the Pacific and Atlantic Oceans coincided. The team’s findings appeared recently in the journal PNAS.
“We found that early 20th century sea surface temperatures in the tropical Pacific and North Atlantic had warmed much more than previously thought,” explains lead author Hiroki Tokinaga of Kyoto.
“Using observations and model simulations, we’ve demonstrated that rising Pacific-Atlantic temperatures were the major driver of rapid Arctic warming in the early 20th century.”
Previous explanations for early Arctic warming have including decreased volcanic aerosols and increased solar radiation, but none of these have been able to simulate observed conditions from the period.
Tokinaga’s team found that when the interdecadal rise in sea surface temperatures was included in simulation calculations, the results properly reflected early Arctic conditions.
“Coupled ocean-atmosphere simulations also support the intensification of Arctic warming,” continues Shang-Ping Xie of UCSD, “which was caused by a concurrent, cold-to-warm phase shift of Pacific and Atlantic interdecadal modes.”
The researchers explain that these new findings can help constrain model climate projections over the Arctic region.
“It is likely that temperatures in the Arctic will continue to rise due to anthropogenic global warming,” concludes Tokinaga. “Our study does not deny this. We are rather suggesting that Arctic warming could accelerate or decelerate due to internal variability of the Pacific and the Atlantic.”
“It is a challenge to accurately predict when the next big swing of multidecadal variability will occur. Careful monitoring is essential, given the enormous impact on the Arctic climate.”
###
The paper “Early 20th-century Arctic warming intensified by Pacific and Atlantic multidecadal variability” appeared 30 May 2017 in the Proceedings of the National Academy of Sciences of the United States of America, with doi: 10.1073/pnas.1615880114
Pacific North American circulation pattern links external forcing and North American hydroclimatic change over the past millennium
Significance
We have developed a new reconstruction of changes in the wintertime atmospheric circulation over North America based on data distributed across the region. The record spans almost 1,000 years and shows how variation in ocean temperatures, solar energy, volcanic eruptions, and greenhouse gases has affected circulation over this period. We show that the circulation pattern is strongly correlated with fluctuating drought conditions in the western United States. Climate models do a poor job of simulating the reconstructed record of circulation change, and thus may have difficulty predicting future patterns of drought influenced by changing winter storm tracks across this region.
Abstract
Land and sea surface temperatures, precipitation, and storm tracks in North America and the North Pacific are controlled to a large degree by atmospheric variability associated with the Pacific North American (PNA) pattern. The modern instrumental record indicates a trend toward a positive PNA phase in recent decades, which has led to accelerated warming and snowpack decline in northwestern North America. The brevity of the instrumental record, however, limits our understanding of long-term PNA variability and its directional or cyclic patterns. Here we develop a 937-y-long reconstruction of the winter PNA based on a network of annually resolved tree-ring proxy records across North America. The reconstruction is consistent with previous regional records in suggesting that the recent persistent positive PNA pattern is unprecedented over the past millennium, but documents patterns of decadal-scale variability that contrast with previous reconstructions. Our reconstruction shows that PNA has been strongly and consistently correlated with sea surface temperature variation, solar irradiance, and volcanic forcing over the period of record, and played a significant role in translating these forcings into decadal-to-multidecadal hydroclimate variability over North America. Climate model ensembles show limited power to predict multidecadal variation in PNA over the period of our record, raising questions about their potential to project future hydroclimatic change modulated by this circulation pattern.
The paper is paywalled, so I can’t comment on the merits of it, but a couple of things come to mind from what is presented so far in the press release and abstract.
- Do you really need to use a polar bear photo? Won’t the science stand on it’s own merit without the need for something that tugs at peoples heartstrings?
- By the same token, why push the overused “canary in the coal mine” meme? Same argument.
- If the early 20th century Arctic warming was caused by ” this phenomenon occurred when the warming phase — ‘interdecadal variability mode’ — of both the Pacific and Atlantic Oceans coincided” but in the present you claim “It is likely that temperatures in the Arctic will continue to rise due to anthropogenic global warming,” concludes Tokinaga. “Our study does not deny this. We are rather suggesting that Arctic warming could accelerate or decelerate due to internal variability of the Pacific and the Atlantic.”, is this just throwing a bone to the financing gods? Why couldn’t “‘interdecadal variability mode’ — of both the Pacific and Atlantic Oceans” be the cause now?
lts noticeable at the moment that there is a cold blob in the North Atlantic west of the Azores.
The cause of that blob has in a large part been due to the weather. Over the last month or so there has been a interesting trend of area of low pressure sitting in and around the Azores area of the Atlantic.
Which has decreased amount of Azores highs from forming. So there been decrease of warm air over this area where the cold blob has formed and a increase in colder air been drawn down from eastern Canada/Greenland. Which shows the weather can and does effect the Oceans/Climate rather then just only the other way round. This is important to understand when it comes to climate change.
Can someone give me an email address to send “stay out of paris” req to the WH or Pres. Trump?
Anthony, there are two separate papers mentioned in the Article. I don’t think you meant to copy the abstract of the 2nd paper which is itself an interesting paper.
“Early 20th-century Arctic warming intensified by Pacific and Atlantic multidecadal variability”
“Pacific North American circulation pattern links external forcing and North American hydroclimatic change over the past millennium”
“similar rapid warming that occurred during the early 20th century”
Similar? Nothing like it.
You actually believe NOAA?
Sad.
That graph appears to be a prime example of lying with numbers, something you warmunists are both good at, and comfortable doing. Congratulations.
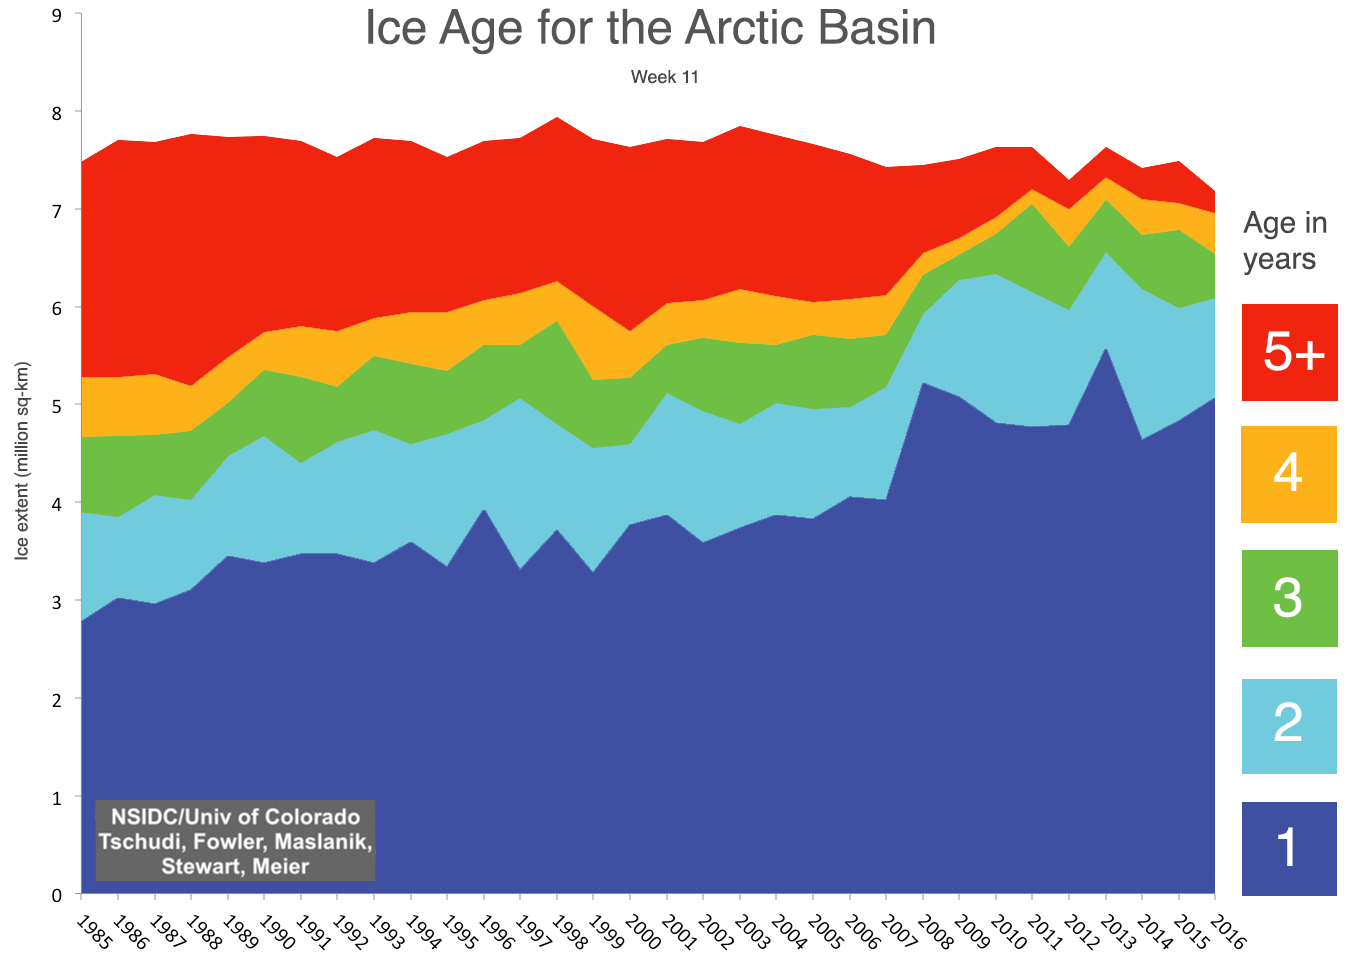
Tony, I believe this graph is a little more accurate/comprehensive
Puts a different point of view on it, eh.
TM, you have three problems with your fake news graphic. 1. What month? 2. Has NEVER been as low as depicted even 3rd week September per DMI and NSIDC (red). 3. IPCC projectiions (blue) had zero as soon as 2015 (Wadhams). Never going to happen.
Children in kindergarten can color as they wish with crayons. As you have here. Meaningless.
Wadham’s “ice free” wasn’t zero ice, it was 1,000,000 square kilometres. Minor point, and doesn’t change the thrust of your comment.
On track for a major melt-out this summer with thin, fragile ice over the whole basin except for a tiny bit of multi-year ice north of Greenland and CAA.
1. Graph is labelled September
2. 2012 had 3.2 million q km
http://greatwhitecon.info/wp-content/uploads/2014/04/NSIDC-MinMax-2017.png
3 Volume is the better indicator:
1 Month is labelled on the graph – September minimum.
2. Certainly has been under 4million km
http://blogs.egu.eu/divisions/cr/files/2017/04/Arctic_graph_both.jpg
3 Volume give a better view of the state of the ice – thin and fragile. The chance of a melt out of all but the thicker bits north of Greenland and the CAA are high.
tony mcleod
And so what? Under today’s conditions, less sea ice = MORE cooling and MORE heat LOSS from the newly-exposed arctic ocean 7 months of the year. And, what heat is gained during those few weeks of April-August, is made up by the increased losses the remaining months of the year.
By the time Arctic sea ice minimums are reached in mid September, there are less than 20 watts/m^2 (average) of solar energy hitting the Arctic surface of that “ice-free arctic” you so greatly fear!
Yet, on that same day, because the sun so low in the sky, there are only 200 watt-hours absorbed difference after 24 hours exposure of an ice-covered sea and an open ocean.
(Specifically, on a clear day at the edge of the sea ice at 78 degrees north, 414 watts-hours of direct radiation from sunlight would hit the surface over the entire day. 208 would be absorbed by the open ocean and 79 would be reflected. If that same solar energy hit sea ice on that same day-of-year, 71 watt-hours would be absorbed bu the sea ice, and 344 would be reflected. The difference is 208 watt-hours. Over the entire day.
But just increased longwave losses radiating into space from a 2 degree C sea surface, rather than from a -20 degree ice surface, are more than 150 watts. Every hour of the 24 hours that same day.
Less sea ice? More cooling.
Hey McClod,
MASIE has 2017 extent above that of 2006, 2007, 2008, 2009, 2010, 2011, 2015, 2016
NSIDC has 29017 extent above that of 2006, 2010, 2011, 2015, 2016.
Both MASIE and NSIDC have the SLOWEST May melt this century.
Facts, always the enema of the AGW clown cultist.
typo fix
NSIDC has 2017 extent above that of 2006, 2010, 2011, 2015, 2016.
Temperatures in Iceland, McClod.

No wonder the Arctic sea ice scam starts in 1979
And you do know that late 1970’s was a time of EXTREME Arctic sea ice, up there with the extremes of the LIA.
And look what happens when we add the early sat data from 1973 to the DOE chart
Half a warm summer away from a flash melt-out.
Hey Tony, how’s it going,
From the graph, 1980: why is “projection” at 1,000,000 square kilometers (about 10%) above “actual”?
Couldn’t they at least calibrate the model to resemble reality at some point in time? Do you think this specific model, that you reference, is a good indication of the type/caliber of work product that the IPPC has compiled?
Looks like a pretty shoddy model to me.
So how did we have so much sea ice when temperatures were just as warm 80 years ago?
http://notrickszone.com/wp-content/uploads/2017/04/Arctic-Temperatures-1920-2017-HadCRUT4.jpg
Uh, Tony. Why aren’t we seeing data through September 2016? Why does your graph end at 2007?
It is my understanding that the 2007 values you present at the end of your graph set a floor at which we remain ten years later.
Tell me it ain’t so. Tell me that ice has dropped below 2007 values.
Prove to me you have any credibility, Tony.
Oh, by the way; the IPCC climate models obviously cannot predict (project) annual ice extent, can they? If they are so far off on a fundamental climate parameter as Arctic ice extent, why would I believe their predictions (projections) of temperature, humidity, floods, drought, hurricanes, etc.?
“If they are so far off”

…as in way too conervative?
Not sure where you’re getting 2007 from. The first one goes to 2012. Does this answer your question?
This is one of the causes of the current thin, fragile, mobile ice:
Tony,
You have labelled the graph “as much as 30C warmer” yet the data on the graph indicates the artic temperature anomaly is, on average, +4.8C. Using your logic, couldn’t we also proclaim “catastrophic global cooling” by pointing out that much of the northern hemisphere experienced “as much as 10C cooling”??
This is “me too” science. The relationship between Arctic sea ice and AMO was established by:
A signal of persistent Atlantic multidecadal variability in Arctic sea ice
M.W. Miles et al. 2014. Geophys. Res. Lett., 41, 463–469.
http://folk.uib.no/ngftf/CV/PDF_Furevik/miles_et_al_grl_2014.pdf
“We establish a signal of pervasive and persistent multidecadal (~60–90 year) fluctuations… Covariability between sea ice and Atlantic multidecadal variability as represented by the Atlantic Multidecadal Oscillation (AMO) index is evident during the instrumental record. This observational evidence supports recent modeling studies that have suggested that Arctic sea ice is intrinsically linked to Atlantic multidecadal variability.
Given the demonstrated covariability between sea ice and the AMO, it follows that a change to a negative AMO phase in the coming decade(s) could —to some degree— temporarily ameliorate the strongly negative recent sea-ice trends.”
They tune the CO2-driven models to match the late 20thC warming, so the models’ only possible conclusion is that the late 20thC warming was caused by CO2. It’s standard circular logic. The models then fail to match the earlier warming, because there was less CO2 growth then. ?w=720
The modellers, to protect their models, then need to find an excuse for the earlier warming. The “culprit” they chose was the combination of AMO and PDO, neither of which is represented in the climate models. They used “a network of annually resolved tree-ring proxy records across North America”. Well, here is how North American temperatures stack up against the AMO and PDO:
[full article: https://wattsupwiththat.com/2010/09/30/amopdo-temperature-variation-one-graph-says-it-all/%5D
No CO2 is needed!
This is a very telling graph and be the key to why we see the ~1000 year cycles. Note the PDO+AMO shows warming influence for about 2/3 of the 60+ year cycle and a cooling influence for only 1/3 of the cycle. It is possible the PDO and AMO are on slightly different cycles.
If they’re cycles only differ by 3-5 years then over 1000 years they might go through some periods where they were in sync, some periods out of sync and some periods with some overlap.
Are these two different papers? The first part of the article seems to refer to this paper by Tokinaga, is http://www.pnas.org/content/early/2017/05/23/1615880114.short?rss=1 titled Early 20th-century Arctic warming intensified by Pacific and Atlantic multidecadal variability
However, the link is to a paper written by Zhongfang Liu, et al http://www.pnas.org/content/114/13/3340.abstract Th is is the paper titled, Pacific North American circulation pattern links external forcing and North American hydroclimatic change over the past millennium
In other words, the article which is discussed in the first have of the post is not related to the PNAS report which is cited in the 2nd half of the post. If you are interested in reading the second one in its entirety, it is available in Researchgate for free (no paywall). You merely have to have an account on researchgate.
https://www.researchgate.net/publication/314434770_Pacific_North_American_circulation_pattern_links_external_forcing_and_North_American_hydroclimatic_change_over_the_past_millennium
Preferred patterns of atmospheric circulation. That’s all we’re looking at. And all we veteran Meteorologist have know it for a long time. The “climate change” hoax!
It is interesting to look at Icelandic temperatures and the adjustments made to them.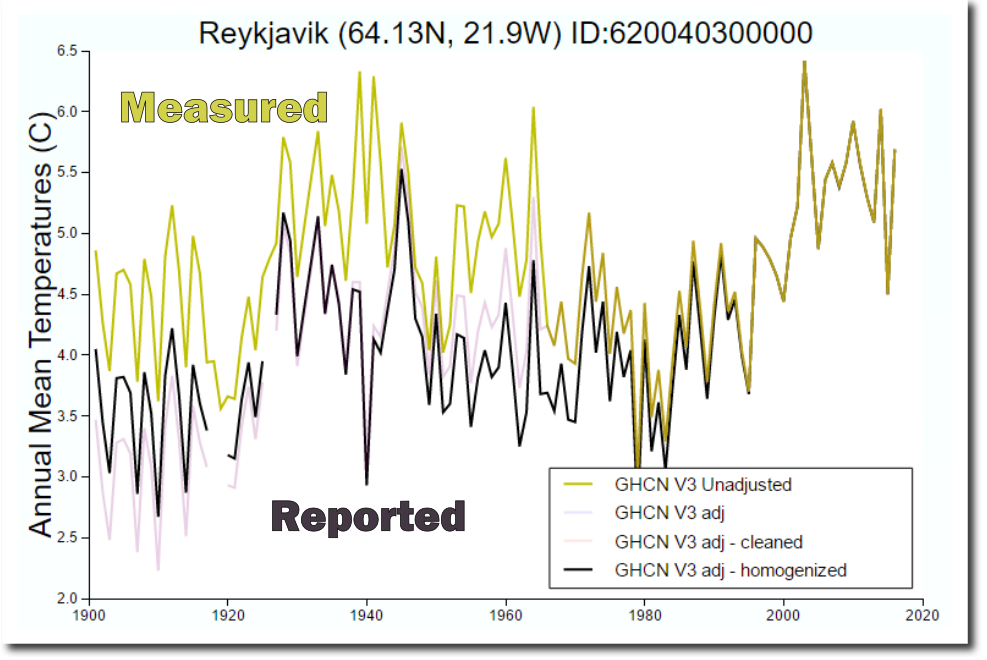
Here is GISS data, RAW and ADJUSTED. Look at the 1940 adjustment.
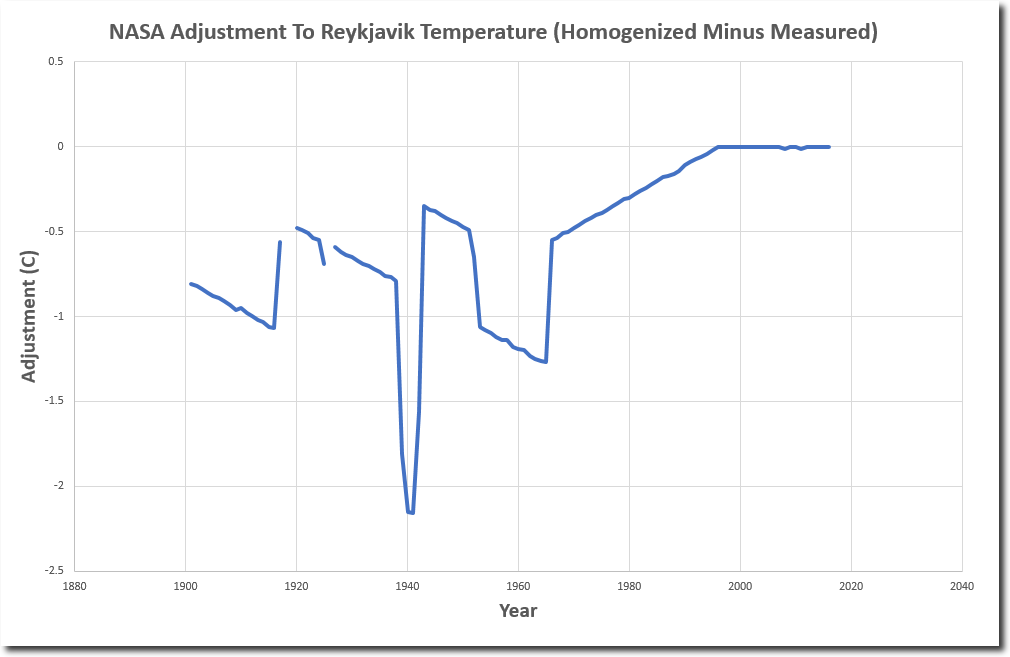
More starkly, the adjustments made are:
Why do they wish to rewrite the 1940 temps by so much?
8.5 degree difference in 1940 ?? Wow !
3.5…
The heating in Arctic region will make methane emissions greater. But..
http://www.pnas.org/content/114/21/5355.abstract#corresp-1
What did glaciers do during this time? If they were receding, what kind of additional atmospheric temperature change would that latent heat translate to had there been no ice to melt? What caused all that forcing?!
Arctic sea ice on 31 May 2017 was in the middle of the past 12 years for this date:
2013: 12.478 M sq km
2009: 12.447
2012: 12.437
2008: 12.311
2007: 12.263
2014: 12.219
2017: 12.108
2011: 12.054
2010: 12.041
2006: 11.966
2015: 11.795
2016: 11.203
http://nsidc.org/arcticseaicenews/charctic-interactive-sea-ice-graph/
The importance of late season weather on summer low ice extent is obvious from the relatively high ranking for 2012 and 2007, both record low years due to August cyclones, which also struck in the already lower than average years of 2015 and 2016.
This year would also probably have been higher than 2004, but ice essentially quit melting then for a few days at the end of May.
At its present low rate of melt, thanks to colder than usual SSTs, Arctic sea ice extent should soon enter the normal range for the 30-year reference interval, 1981-2010.
So, unless a storm or two hits the Arctic in August or September this year, piling up the floes and so distributing them that less area meets the 15% minimum to be counted as icy, Griff will lose his bet that this was “sure” to be a record low year, due to its slightly lower than last year’s winter maximum.
The summer and winter lows of 2015 and 2016 and the winter low of 2017 were all thanks to the super El Nino now past.
Next week is when the melt rate often accelerates. We’ll soon see whether this year’s extent will be above even more years in mid-melt.
Melt rate already picked up a bit on June 1.
Griff’s bet as I recall was that it would be possible to sail to the N pole through open water. Extent is higher than last year mainly because the ice is more fragmented (and thinner), as a result it is likely to melt faster so I expect a record minimum year this year.