All global temperature data sets confirm that global temperature has fallen rapidly in recent months as the recent El Nino ended.
Guest essay by Dr David Whitehouse, The GWPF Science Editor
Over the last couple of years there have been many articles about how they have been record-breakers in global temperature. It’s often sold as a simple ‘the planet is getting warmer only because of us’ story. As I have discussed before the concurrent El Nino was dismissed by some climate scientists as having an insignificant contribution to that record. However, there is a great deal of confusion and diversity in the assessment of its contribution. Some scientists maintain that it was the recent very strong El Nino that elevated the temperature to record levels.
Nevertheless some maintain that warm records would have been broken without the El Nino (although the significant contribution made by the highly unusual warm “Pacific Blob” is usually ignored).
As the 2015/16 El Nino started to wane wiser heads said the records would fade along with it, “No El Nino, no record,” they said, showing that the El Nino was responsible for edging the years to be records.
It is obvious that the world is cooling after the El Nino and nobody knows how much it will as global temperatures bottom out. So the time is right, one would have thought, to monitor that cooling process and see what can be deduced to set the recent record warm years into their proper context.
In doing so it seems that you can write a straightforward article, clearly one that can be revisited in the coming months with new data, present some current data, discuss the caveats surrounding it, and still get criticised, especially about what the article did not say. Cut and past comments and quotes blossomed in many blogs, sloppy statistics are banded about, along with not a little hubris wrapped up in ignorance and gratuitous use of the ‘denier’ label.
David Rose’s article in the Mail on Sunday simply reported what has happened recently to the Lower Tropospheric temperature over land. This data set responds more quickly to temperature changes that other sets which follow suite later. Land temperatures heat up and cool down quicker. They show the El Nino spike very clearly and the possible return to pre El Nino temperatures.
Some have said the article is flawed because it has cherry-picked the particular data used, some have even said “extreme cherry-picking,” implying it is the only data set that shows the global temperature drop. This is nonsense.
Firstly the graph is not an outlier as critics could have seen if some had bothered to look. Other temperature data sets show something similar – that the global temperature has fallen a lot in recent months as a result of the ending of the El Nino. Here are a selection of them showing that the lower tropospheric temperature is not unusual but typical. The same story could have been written using any of these graphs.


Hadcrut4 northern hemisphere data (mostly land)
As has been said, the temperature of the lower troposphere over land has the quickest response to such changes and should be looked at first to provide an indication of what might happen in the future. It has been done many times before without revolt. The graph used is an example of what is happening, and data that should not be ignored because some find it inconvenient.
Some have even dismissed the data because it’s land only, ignoring how useful land only data can be. After all, why would all the temperature data sets produce them? Obviously data should be used carefully and it is encouraging to see the other data sets in collaboration with the land-only tropospheric data.
Secondly, even if it had been unusual it would still have been worth talking about in a responsible manner. The thing we teach young scientists – because it is at the very heart of science – is to keep their eyes open for the unusual, the unexpected and the outlier. The most important words in science are, I contend, “that’s strange,” used when seeing something that attracts intention. Perhaps Alexander Fleming in 1928 should have ignored the single petri dish among many that showed a fungus growing on straphylococci as he would be cherry-picking his results!
Some argue that all the atmospheric land data should be displayed as it starts in 1979. This was one gist of one frequently quoted response to the Mail on Sunday article.
The anonymous analyst ignores what the article says, builds a straw man case and deliberately misses the point. He says the article wants…
“you to think that the worldwide heating we’ve seen for decades now has somehow, magically, come to an end … that it has shown some kind of “pause.”
He also maintains that one can draw a straight line through the 1979 -2016 lower tropospheric data that shows there is no pause or hiatus.
The blogger shows the lower tropospheric data back to the start of the data set in 1979 and says showing the post-1997 “hiatus” data on its own is misleading as there is a clear trend from 1979 upwards. Except that there isn’t.
There is no way to reproduce the trend observed either during the period 1979 – 1997 or 1979 – 2016 in the post 1997-data (ie half the data set) because a straight line does not represent the data over its entirety. It is obvious that a straight line doesn’t work when one examines the residuals (the difference between observed and predicted data) which are not randomly distributed.
Carbon Brief’s “Factcheck” commits all of the above sins. It gets itself into a muddle right from the start saying that without the El Nino we would have had recent record years when in fact they would probably have been what it was like before the El Nino in being all statistically identical to one another. Then it says that temperatures are dropping “modestly” to where they were before the El Nino started. To Carbon Brief the satellite data published by the Mail on Sunday is an “obscure” data set which disagrees with other data sets. See above.
The proof of the claim that the recent El Nino had a minimal effect on recent record temperatures will be found next year. If it is true 2017 would be another record warm year.
So let’s summarise. As the El Nino has faded global temperatures are dropping, not just in lower tropospheric land data (where it has been seen the strongest so far) but in the other data sets as well. Without the El Nino (probably the strongest on record) and the Pacific Warm Blob there will be no new record next year, or probably the year after if the la Nina sets in. Temperatures are more likely to return to pre-El Nino levels. If so, the 2015/16 El Nino would be shown to be a temporary blip in a continuous “hiatus” period which, nevertheless remains the warmest period of the instrumental temperature era. For all we know, at the end of next year we could see the global warming “hiatus” approach its third decade.
Source: http://www.thegwpf.com/despite-denial-global-temperatures-are-dropping-fast/
Commentary by Anthony Watts:
The anonymous blogger Dr. Whitehouse refers to in his article quoted in the NYT is known as “Tamino”, the self-described “Hansens Bulldog” who runs a laughably named blog called “Open Mind”. His real name is Grant Foster, and he lives in Maine. I always find it hilarious that even though Foster is well-known throughout the blogosphere for years since he was outed, and published a paper with Stephan Rhamstorf of RealClimate blog, he still hides behind a pseudonym. Perhaps he suffers from the same irrational fears that Dr. Peter Wadhams suffers from; “big oil hitmen“. Foster, along with some unscrupulous others touted the big run up of global temperature due to the large El Niño of 2015/2016. which has now dramatically faded, and even the warm “blob: is replaced with cold:

Now that the El Niño of 2015/2016 has faded, so have global temperatures. Their chickens have come home to roost.
Willis calls these people “Unscientific Americans“.
For those who were using the El Niño of 2015/2016 to push “hottest year ever” scenarios, the drop in temperatures now raise the question of whether 2016, if a record, will be statistically significant at all.
Meanwhile, in case you missed it, the “father of global warming”, Dr. James Hansen recently dialed back the alarm on global warming, saying:
“Contrary to the impression favored by governments, the corner has not been turned toward declining emissions and GHG amounts…. Negative CO2 emissions, i. e., extraction of CO2 from the air, is now required.”
– James Hansen, “Young People’s Burden.” October 4, 2016.
“The ponderous response of the climate system also means that we don’t need to instantaneously reduce GHG amounts.”
– James Hansen, “We Hold Truths to be Self-Evident“ December 2, 2016.
That must have been a real kick in the nuts to “Hansen’s Bulldog”, now oddly deleted but available at the Wayback machine via this link.
Note: within 10 minutes of publication, some grammatical and punctuation errors were corrected, along with adding a sentence pointing to the recent WUWT post on statistical significance of 2016 temperatures.
Discover more from Watts Up With That?
Subscribe to get the latest posts sent to your email.
Here are some suggested book titles for Hansen in his final reconciliation years.
– Young People’s Advocacy Burden
– The Data Truth Hurts
– I’m Sorry I Caused So Much Taxpayer Waste and Harmed Science
Better get started James or you may be visited by reporters in hospice care.
Since “Tamino”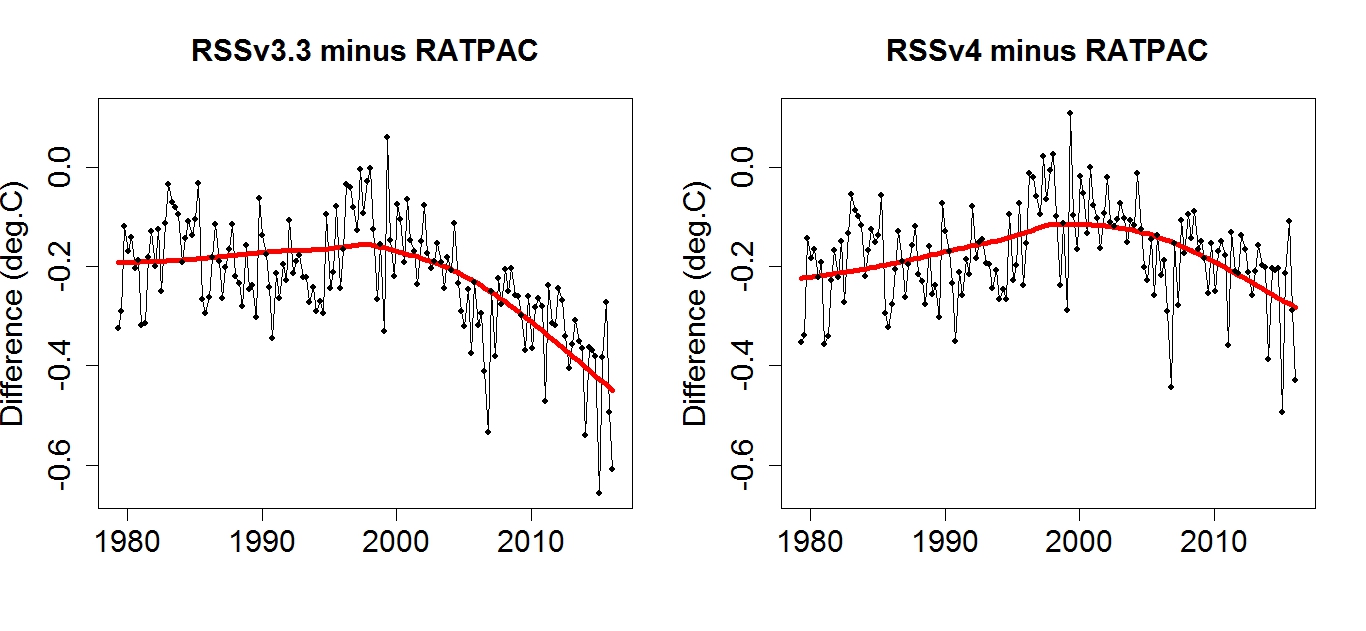
Has been mentioned, shall we see his examination of the accuracy of the satellite tropospheric temperature data products against radiosonde data.
Because the truth is that there are major problems with the tropospheric sat temp data.
In short they show a considerable cooling trend vs radiosonde since the time of the MSU to AMSU sensors as NOAA 15 took over from 14.
Both UAH and RSS know of this.
UAH prefers to go with the new AMSU as being correct merely because of a presumed “Cadillac quality”, whereas RSS has “split the difference” between them, so that the trend is wrong both before (V3.3) and after the change over (V4.0).
Comparing against radiosonde (RATPAC-A) here is the disconnect ….
And here we see the discrepancy among a series of data…
https://drive.google.com/file/d/0B_dL1shkWewaYUdhcjdFOFJ3ZTA/view
UAH TLT V6 (beta5) has a trend that is a quarter of the RATPAC-A radiosonde.
https://www.ncdc.noaa.gov/data-access/weather-balloon/radiosonde-atmospheric-temperature-products-accessing-climate
“RATPAC-A contains adjusted global, hemispheric, tropical, and extratropical mean temperature anomalies. From 1958 through 1995, the bases of the data are spatial averages of the Lanzante et al. (2003a,b; hereafter LKS) adjusted 87-station temperature data. After 1995, the Integrated Global Radiosonde Archive (IGRA) station data form the basis of the RATPAC-A data. NOAA scientists used the so-called “first difference method”; to combine the IGRA data. This method is intended to reduce the influence of inhomogeneities resulting from changes in instrumentation, observing practice, or station location. Use RATPAC-A for analyses of interannual and longer-term changes in global, hemispheric, and tropical means.”
To be quite honest Toneb, I don’t think anyone here gives a toss what the Bulldog says!
Well heck.
You do surprise me (sarc)
As it’s only observation of the large problem that all the satellite troposheric data products have.
And that at least RSS have tried to mitigate.
With the RSS TTT V4.0 product.
Oh, and your comment is precisely THE point.
Oh sure we do. Anthony even has a link to http://tamino.wordpress.com/ in the right hand nav bar.
Like most alarmists, Foster doesn’t have a link to WUWT.
RATPAC-A
“Radiosonde Atmospheric Temperature Products for Assessing Climate dataset A (RATPAC-A) contains adjusted global, hemispheric, tropical, and extratropical mean temperature anomalies. A collaborative effort by NOAA scientists collected observations at 85 stations …”
“Data removal occurred at times in 1996 and 1997 where LKS had made adjustments or had removed data due to homogeneity concerns. Despite recent efforts by NCEI to update the station histories, useful metadata after 1995 was available for just 38 of the 85 stations …”
“In another effort to reduce random errors, the LKS authors used linear interpolation between months of data to fill data gaps of less than four months before removing data at the times of metadata events. The use of interpolation is only at stations where data removal occurred due to metadata events. The mean number of months of data added by interpolation to these 38 stations was about six per station.”
It’s junk. Anyone quoting this nonsense deserves to be mocked and ridiculed.
Black Swan Theory, live and learn
IMO the point of discussing the rapid dropoff is to show how absurd was CACA jubilation over the rise in temperatures in 2015-16 from a super El Nino.
Now alarmists claim it’s only weather, whereas they had shouted that the El Nino weather event proved that we’re all going to die!
” follow suite” should be “follow suit”, like in card games.
The temperatures although down are still warm, we need them to drop off more before we can say AGW theory is wrong.
I think it is forthcoming but boy the global temperatures are still rather high. I am anxiously waiting for further declines.
“…to keep their eyes open for the unusual, the unexpected and the outlier. The most important words in science are, I contend, “that’s strange,” used when seeing something that attracts intention…”
Hmmm…that’s a bit strange.
Imagine these were your medical test results and your doctor was saying that.
Fascinating graph. This year, both Arctic and Antarctic ice are at, or near, a low at the same time, which has resulted in the global anomaly being 4 or 5 standard deviations below average.
For Dr. Whitehouse to try to mis-inform the public that global temperatures are dropping off while ignoring the fact that global sea ice falling to unprcedented lows for this time of the year is simply amazing. Talk about Mr. Watts willingly spreading fake news.
Certainly is, especially when you look at all the other graphs:
http://arctic.atmos.uiuc.edu/cryosphere/IMAGES/seaice.recent.arctic.png
http://arctic.atmos.uiuc.edu/cryosphere/IMAGES/seaice.area.arctic.png
http://arctic.atmos.uiuc.edu/cryosphere/IMAGES/seaice.anomaly.arctic.png
http://arctic.atmos.uiuc.edu/cryosphere/arctic.sea.ice.interactive.html
Have just noticed this on the Cryosphere Today website:
This what the current DMI chart looks like:
http://i255.photobucket.com/albums/hh154/crocko05/Screen%20Shot%2012-06-16%20at%2001.45%20PM_zpsrtwdea7r.png
So nothing strange BruceC?
Nothing strange at all Tony … except for the fact that the DMI chart looks nothing like yours and that Cryosphere Today has stated that there is a problem (since April) with a satellite that measures sea-ice at both poles.
Bruce,
Strange, as in Robert Strange McNamara?
How convenient, as it were, that at this critical juncture, government ice observing satellites should go on the fritz.
Sorry Tony, just noticed your graph says ‘GLOBAL’ not Arctic. My apologies.
However, there is still that Sat. problem that needs to be sorted. 😉
Ah, Houston …. we’ve had a problem here!
http://arctic.atmos.uiuc.edu/cryosphere/IMAGES/global.daily.ice.area.withtrend.jpg
Have a look at the end of the graph 😉
Nothing strange at all Tony.
http://arctic.atmos.uiuc.edu/cryosphere/IMAGES/seaice.recent.antarctic.png
http://arctic.atmos.uiuc.edu/cryosphere/IMAGES/seaice.area.antarctic.png
http://arctic.atmos.uiuc.edu/cryosphere/IMAGES/seaice.anomaly.antarctic.png
😉
Bruce it has been broken for over 6 months!!!
Indeed – the latest mass/volume figures including November are out and show record volume to go with the record low extent
Ice volume anomaly, for example:
https://forum.arctic-sea-ice.net/index.php?action=dlattach;topic=119.0;attach=38989;image
sea ice volume
http://psc.apl.uw.edu/wordpress/wp-content/uploads/schweiger/ice_volume/BPIOMASIceVolumeAnomalyCurrentV2.1_CY.png
“November 2016 sea ice volume was 7,800 km3 , about 2500 km3 below the 2015 value and the lowest for any November on record exceeding the prior record set in 2012 by about 400 km3 . This record is in part the result of anomalously high temperatures throughout the Arctic for November discussed here. 2016 November volume was 61% below the maximum November ice volume in 1979, 48% below the 1979-2015 mean, and about 1.1 standard deviations below the long term trend line.”
http://psc.apl.uw.edu/research/projects/arctic-sea-ice-volume-anomaly/
This story is all over the press, but has not had an article on this or similar websites…
Bruce – that is not the only satellite.
Measurements were switched to alternate satellite months ago, as everyone who follows the changes in the artic knows…
There is continued good satellite data, which shows record low extent, high arctic temps and record low arctic sea ice volume.
How are you explaining that?
Hello Griff, how they hangin’?
Care telling Tony to update his graph?
Griff;
Must be reading or watching the wrong press sites, heard nothing about it till today.
BTW Griff, do you realise that Australian’s are still snow skiing and snow-boarding here in Oz – in December fer …. sake – when we’re not punching kanga-walla-foxes in the face?
Do you have any evidence that this is caused by us (more CO2)? Or are you just quoting what is written in the MSM?
Are you dismissing the fact that this could be nothing more than a weather/ocean event?
I posted it Bruce to see if anyone might say to themselves: “that’s a bit unusual”. Which is not surprising around here given it’s the sort of evidence that isn’t supposed to be in the script. .
.
Nothing wrong with the satellite or the data the graph is here:
It’s a real situation, global sea ice area falling of a cliff. The amount of reduced albedo alone is going to bump up the energy imbalance another step: goodbye sea ice.
The cause? that starts with “that’s a bit unusual”. If you don’t think it’s unusual – then nothing to see….
“…I always find it hilarious that even though Foster is well-known throughout the blogosphere for years since he was outed…”
The fantasy of being a fictitious handsome prince and hero outweighs reality for him. If he didn’t exist, Stephen King might have to create him.
The personal attacks and insults hurt you otherwise sound arguments.
Can Toneb (and his mate the Hansen Bulldog) and Nick Stokes please explain this ‘anomaly’ that has appeared within the GISS data between November and December? Has there been a peer-reviewed paper released as to why the data has changed?
http://realclimatescience.com/wp-content/uploads/2016/12/Screen-Shot-2016-12-05-at-3.55.52-AM.png
Good question, BruceC.
Looks like Gavin has been busy messing with the temperature records again. He better hurry, he only has about 46 more days of data manipulation left.
I’m sure Nick will be able to supply us with a perfectly ‘above-board’ explanation. 😉
Simon says it is more accurate when it is adjusted (upward)
“Has there been a peer-reviewed paper released as to why the data has changed?”
Has there been a peer-reviewed paper as to why UAH was changed from V5.6 to V6.0, not forgetting the important (beta5) part?
Where’s the paper on why co2 levels were changed ? ( not at you Toneb) .. just in addition to. Once I started asserting that 1998 was the highest year for co2 levels until the present el nino, magically 2005 became 3.10 which surpassed the 2.93 in 1998. By changing the co2 numbers, at least for that year, they were able to close the gap on what can only be described as a massive amount of co2 that is unofficially missing from the account. 2005 for 10 years was 2.52 ppm .. oh yes, and temperatures changed as well. It just seems strange that they adjusted the record after something was said.
I do believe the UAH papers are going through peer-review as we speak. But unlike papers like Karl et al. which took little to no time to pass review, Dr Spencer’s are taking a little bit longer … you know how it works;
The current UAH paper is under going peer-review as we speak. Unlike ‘consensus’ papers which take only a matter of weeks to pass review, ‘Karl et al’ is a good example, Dr Spencer’s paper takes a bit longer.
To the best of my knowledge, there is currently a paper going through peer-review as we speak.
But since http://data.giss.nasa.gov/gistemp/you ask….
“The GISS Surface Temperature Analysis (GISTEMP) is an estimate of global surface temperature change. Graphs and tables are updated around the middle of every month using current data files from NOAA GHCN v3 (meteorological stations), ERSST v4 (ocean areas), and SCAR (Antarctic stations), combined as described in our December 2010 publication (Hansen et al. 2010). These updated files incorporate reports for the previous month and also late reports and corrections for earlier months.”
http://data.giss.nasa.gov/gistemp/
So according to your link above, GISTEMP is only an estimate/I>?
Can you please point me to a peer-reviewed study that tells me:
1) What is the global temp (not an estimate)?
and
2) What is our global temp supposed to be?
“GISTEMP is only an estimate”
Of course it is an estimate. Everything is.
I have responded to your plot below. I looked at my data and saw very little difference.
Anthony, I come back to your Hansen citation just below the head post:
“The ponderous response of the climate system also means that we don’t need to instantaneously reduce GHG amounts.”
It is formally correct, but more correct would have been not to keep it out of the somewhat crucial context immediately following:
BruceC on December 5, 2016 at 4:21 pm
It is easy to simply contact NASA GISSTEMP, emails are visible on the site.
But I guess you never would trust to their answers.
So feel free to keep in doubting about everything you don’t want to trust.
So none of you have any problems with figures (data) being adjusted? OK, do any of you own or run a business? If you do, I dare you to go to your accountant and tell him/her to adjust last month’s figures.
“So none of you have any problems with figures (data) being adjusted? OK, do any of you own or run a business? If you do, I dare you to go to your accountant and tell him/her to adjust last month’s figures.”
Of course that happens. If an expense is incorrectly coded when first entered into the expense mgt system, it will be changed later. Or if the amount was put in incorrectly, same thing. Happens all the time.
I run 2 small companies in Singapore, so yes, I am speaking from experience.
BruceC on December 5, 2016 at 4:21 pm [2]
TA on December 5, 2016 at 5:33 pm
… please explain this ‘anomaly’ that has appeared within the GISS data between November and December?
Well, BruceC and TA: do you have an idea about how ridiculous you – and of course, these people of “real(?) climate(??)science(???)” – all behave here ?
Look at the anomaly differences between the two green plots…
The scale interval is at 0.05 °C, and the biggest distance between these green plots is below 50% of the scale interval, what means that you all complain about discrepancies below 0.025 °C! Incredible.
And best of all is that at the same time you so ridiculously complain, there are many commenters here at WUWT who conversely complain about how meaningless it is to publish measurements below 0.1 °C !!!
And yet you people will jump on this and yell and scream that it has been the hottest year ever.
Bindidon,
Please show us a peer-reviewed study that states what the temperature of this ~4.5 billion year old planet should be?
Please show us a peer-reviewed study that states what the CO2 level of this ~4.5 billion year old planet should be?
If neither of the above questions can be answered, with confidence and/or proof, than how in the …. can we be assured the planet is too hot (or too cold)?
According to the research that I’ve done, we are currently in an interglacial period. This interglacial period appears to be coolest in the past 4 interglacials (~400,000 years), yet has the highest CO2 levels.
Can you please explain to us deplorables … “why is this so?” (to quote Professor Julius Sumner Miller).
“The scale interval is at 0.05 °C, and the biggest distance between these green plots is below 50% of the scale interval, what means that you all complain about discrepancies below 0.025 °C! Incredible.”
Bindidon, 2016 is estimated to be 0.03-0.04C hotter than 1998, and you guys make a big deal out of that. What’s the difference? And you know, if one keeps adding 0.025 to the record, it can add up to quite a bit over time. Enough to make it look like this “Hottest Year Evah!” is even hotter.
Bottom Line: 1998 and 2016 will have to share the title of Hottest Year in the Satellite Record.
You know that’s got to upset the alarmists. Nothing to see here. Same as 1998. Move on.
“Please show us a peer-reviewed study that states what the temperature of this ~4.5 billion year old planet should be?”
and
“Please show us a peer-reviewed study that states what the CO2 level of this ~4.5 billion year old planet should be?”
Pretty poor objections. In fact they are really just meaningless straw men. Answers to which you must know would also be meaningless.
Another is the idea that it is not possible to get an average global temperature, and if we can’t even do that how we going know much it’s changed. What rot.
TA on December 6, 2016 at 5:49 am
You know that’s got to upset the alarmists. Nothing to see here. Same as 1998. Move on.
Words lost in space: I’m neither a skeptic doubting about nearly everything, nor (luckily!) a warmist.
That’s for example the reason why I thoroughly trust in Roy Spencer’s integrity, even if the discrepancies between UAH5.6 and 6.0b5 are and remain incredible, because they are and remain incredibly higher than the GISS and NOAA adjustments.
Bruce,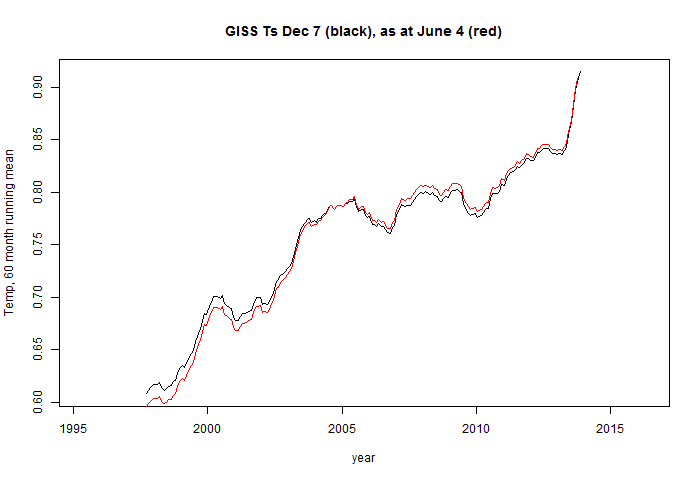
You could have explained more generously what you did. I take it you superimposed two plots of GISS Ts from WFT at two dates.
Well, I don’t know what went wrong there, but I have data files from June 4th 2016 and Dec 7th. And there is very little difference. A few thousandths. You always get some small differences, because new data turns up, or some has errors found. Here is my plot:
Also this recent strongest El Niño was not preceded by any climate altering, ash and sulfer spewing volcanoes like the 1982-83 when Mexico’s ElChichon erupted in April of 1982, cooling the globe for a few years and surprising what could have been record warm years in 1982 and 1983. This year as well as 1997-98 did not have climate altering volcanic eruptions in the months preceding the onset of these record strong El Ninos
The story is about seven hours old and nobody has used the word ‘plummet’.
Das ist wohl wahr, danke!
Also this recent strongest El Niño was not preceded by any climate altering, ash and sulfer spewing volcanoes like the 1982-83 when Mexico’s ElChichon erupted in April of 1982, cooling the globe for a few years and surprising what could have been record warm years in 1982 and 1983. This year as well as 1997-98 did not have climate altering volcanic eruptions in the months preceding the onset of these record strong El Ninos. 1991’s MtPinatubo’s ash and dust had already settled out of the atmosphere by 1997 as recovery warming from Pinatubo resumed by 1994.
It’s weather folks. If we claim it’s otherwise, we will be mobbed by the alarmist’s.
I think the point of this article is that we will be mobbed if we claim it’s weather . .
As an aside, Anthony, may I commend you on your notes for even the slightest revision after publication. It is a standard that many others should strive to meet. Thanks.
I find it odd to make a big deal about who “Tamino” is. It’s like “Steven Goddard” being “outed” as Tony whatsisname. Why should I care? There are plenty of Grant Fosters in the world, and I don’t know any of them. This one is easily identified by his pseudonym, and if I were another Grant Foster I’d appreciate him not using his “real” name. Otherwise, I might be inclined to use a pseudonym to avoid being confused with him.
I note that the newspaper article referenced states that “Last week, Mr Trump’s science adviser Bob Walker said he was likely to axe Nasa’s $1.9 billion (about £1.4 billion) climate research budget.”
Looks like there’s going to be a rush of violin sales.
Is there a warm blob forming in the NW Atlantic?
Jaime Jessop wrote a similar piece, Vilifying Rose – a Tale of Two Standards.
She showed, as David Whitehouse does, that there was no cherrypicking in the data Rose chose to show. She also pointed out the double standards of the many climate scientists who made a huge fuss over the El Nino upspike and have been very quiet about the subsequent fall-back.
Her article provoked a ranting ‘denier’-filled response from so-called “Tamino” in which he included one of his notorious bogus graphs.
As I have discussed before the concurrent El Nino was dismissed by some climate scientists as having an insignificant contribution to that record.
What Mann said to the Guardian was in reference to 2015 not 2016: “A number of folks have done this,” he said, “and come to the conclusion it was responsible for less than 0.1C of the anomalous warmth. In other words, we would have set an all-time global temperature record [in 2015] even without any help from El Niño.”
Anyone know what the overall temperature trend is?
For which period, and for which context?
At least one typo remains: “follow suite” instead of “follow suit”. The metaphor is a card player playing a card in the same suit as the previous player. It has nothing to do with suites.
I commented a lot about the David Rose article here and on other sites. Here is my conlusion:
Rose did not write something wrong. But as a skeptic I just ask for objectivity.
-He did not state which graph he is using.
-He took the one with the biggest drop, RSS land only.
-RSS itself warned not to use the data as real, but just for comparsion.
-As we have a special cold in Siberia, this helps to cool land only graphs – neglecting a warm arctic.
Maybe he didn’t know about this. And the other side clearly overrreacted.
But what could we do better?
Either using a number of different graphs for comparision or using an average of the main graphs. Woodfortrees.org Temp Grap possibly.
What would be an objective statement?
“After a steep rise of 0.6°C during El Nino, the average global dropped sharp with 0.5°C, comming close the 2014 level. Seems the El Nino warming is nearly over. Still it is unclear if a strong La NiNa is following, with further declining temperatures.”
He could also remark, that several land temperatures dropped even deeper, possibly bc of cold siberian land masses. And that the end of any graph is just weather and not a long time trend.
Okay, but that would not give such dramtic headlines. Possible the headline still could use the Land Temp, but in the article the rest from above should also be mentioned.
“Maybe he didn’t know about this. And the other side clearly overrreacted.
But what could we do better?”
Johannes:
For a start it was not “over-reaction”
Delingpole via Rose via the DM have a large reach in spreading the “*sceptical*”.
That they chose to do as you say is either ignorance or motivation.
Either is reprehensible.
Then we have the hypocritical outrage that the science side should protest about just how wrong they were.
These characters are in business of supposedly informing the general public, the vast majority of whom cannot be bothered to check the facts.
That they have been shown to be disingenuous matters not to them Rose et al.
Job done.
Even more of a hero in the *sceptic* world.
That IS fake-news. Post-truth.
The idea that a non-scientist motivated by ideology can gainsay the experts in anything, not just climate and the reality of AGW to me beggars belief.
Unless you resort to the bizarre idea that it’s all a scam.
I see Ball has another article pushing same ….
“Evidence is emerging mostly through the Internet that it is the wrong science deliberately created to push the wrong thing in terms of policy and environment is emerging.”
Anyone who thinks that science can be done on the internet and moaning on about “a scam”, makes it so and adds up to “science deliberately create to push the wrong thing ….”….
Well.
Those who are not inmates in the asylum can see anyway.
Lewis Carroll wrote a certain story that is an allegory to that.
The most sophisticated investor, people who have made a fortune in business can fall prey to a scam. Madoff proved that.
Toneb,
Gangs exist, mafias exist, crime syndicates exist . . basically put, criminally minded/inclined people exist, and they are naturally motivated to team up, and to corrupt whatever governments/institutions they can. I really don’t believe in any magical prohibition against “elite” gangs corrupting science related institutions/organizations in particular. I think that’s what happened in the case of the CAGW, and I think a whole lot of loot was acquired by the people at the top of the “gangs” who pulled it off.
Me thinks the coolistas at WUWT might have completely forgotten that there is a surface temperature record perfectly matching their needs: that of Japans Meteorology Agency (JMA), managed by the Tokyo Climate Center.
Thus a recall seems to be necessary 🙂
http://ds.data.jma.go.jp/tcc/tcc/products/gwp/temp/fig/oct_wld.png
As you can see, they give you the lowest century trend of all surface series: 0.65 °C.
In addition, here is a comparison for Jan 2015 till Oct 2016 between JMA, GISS, HadCRUT4, and… of course UAH6.0beta5:
http://fs5.directupload.net/images/161207/6kq3zkji.jpg
But, but… JMA’s data unfortunately has a major drawback.
There the coolistas won’t see any Steepest drop in global temperature on record. :-((
That’s crazy isn’t it.
The reason for JMA’s low data is quite simple: they have a very poor cover for the Arctic and the Antarctic regions.
And if you look at the OLS trends for the UAH6.0beta5 grid dataset, computed for successive time intervals (1979-2016; 1998-2016; 2000-2013)
http://fs5.directupload.net/images/161028/g25fmuo9.jpg
you see that careful reporting what happens there is an important task.
N.B. The interval 2000-2013 was selected to show trends not including the big ENSO events in 1997/98 and 2015/16.