Guest essay by Roger Graves
The subject of the extent of Arctic ice cover has been much in the news, with an apparently unending series of attempts to predict its future extent on the basis of a relatively few years’ worth of data. However, it is possible to make some general predictions, based on a much longer-term sequence of historical events. Obviously these will not be accurate predictions, since they are based on mere verifiable historical data, unlike, say, the highly accurate predictions of the IPCC based on computer models which no doubt will soon tell us of balmy tropical seas to be found in the Arctic in the near future. Nevertheless, they can still offer a general guide to what we are likely to see in the future.
First, a significant warming of the Arctic was noted in 1922. The U.S Monthly Weather Review of November 1922 contained a report from the US Consul in Bergen, Norway, saying “The Arctic seems to be warming up. Reports from fisherman, seal hunters and explorers who sail the seas about Spitzbergen and the eastern Arctic , all point to a radical change in climatic conditions, and hitherto unheard-of high temperatures in that part of the earth’s surface.”
The article goes on to say “Ice conditions were exceptional. In fact so little ice has never before been noted. … Many old landmarks are so changed as to be unrecognizable. … At many points where glaciers formerly extended far into the sea they have entirely disappeared.”
Second, the Arctic was navigable in the early 1940’s, although people might be forgiven for not noticing it at the time because World War II happened to be in progress then. The Royal Canadian Mounted Police schooner St Roch sailed across the Arctic ocean west to east during the period 1940-1942, and in 1944 made the east to west return trip. During the period 1944-1948 she again patrolled Arctic waters.
The St Roch was not a 30,000 ton purpose-built ice breaker, but was instead a 300 ton wooden schooner. Granted, she was a tough little boat designed for Arctic conditions, but she had no significant ice-breaking capability, so there must have been open water for her all the way.
We also know that when regular satellite coverage became available in 1979, Arctic ice had a much greater extent than it does today. According to NOAA’s data, ice coverage began noticeably decreasing in extent sometime in the mid 90’s. The chart shown below is fig 4.2 of this reference. Incidentally, the September data shown here is an excellent example of how not to apply linear regression. Yes, you can draw a straight line through any collection of quasi-random points and call it a least-squares linear regression. No, it does not magically make the data into a linear progression from larger to smaller, as they have attempted to show in this case. Although I don’t have access to the original data, I would say that the data seems to approximate to a section of a sine wave, which is what one would expect if Arctic ice cover followed a cyclic pattern.
 |
Noticeable melting in 1922, and noticeable melting again in the mid 90’s suggests a warm/cold temperature cycle in the Arctic some 70 years in extent or thereabouts. Further, the St Roch data indicates that a warm peak of this cycle probably occurred sometime in the 1940’s.
For the sake of argument, let us assume a 70-year cycle with a warm peak in 1945. This would place the next cold trough 35 years later, in 1980 (which is not inconsistent with the NOAA data shown above) and the next warm peak at 2015, which is reasonably close to the recent summer ice minimum.
Counting backwards from 1945, a previous warm peak would have occurred in 1875, and a cold trough would have occurred one half cycle earlier, in 1840.
We also know that the ill-fated Franklin expedition to discover the North-West Passage set out in 1845, a few years after this cold trough, when ice coverage would have been at or near a maximum. As we also know, the expedition failed disastrously, which is what one would expect under such conditions.
I will be the first to admit that my arithmetic is only approximate. However, historical data would seem to support a cyclic ebb and flow of Arctic ice cover. Based on the suggested cycle period of 70 years, we can expect Arctic ice cover to increase from the present day until about the year 2050. Anyone about to invest large sums of money in North-West Passage shipping might well be advised to take note.
Discover more from Watts Up With That?
Subscribe to get the latest posts sent to your email.
So the author feels that anecdotal information from a few locations over time contradict the temperature record from many known weather stations around the far northern latitudes? It also boggles the mind to think the the few anecdotal observations would not be backed up by others around the Arctic if it were a widespread phenomenon like it is today
Oh god another wacko WUWT article. Christ author do attempt to cite a peer reviewed article in a respected scientific journal won’t you? If there is no verifiable science behind your statements then you are just spouting off your ever so precious opinion. Grow up.
Peer review rant. Self-dealing academic incest is best, eh?
It’s not your blog, so go whine elsewhere, or STFU. Anthony can accept musings from whoever he chooses. We here all know how broken pal-review is (refer to climategate emails)
What’s going on in the Antarctic and what are you going to do about any of it? This entire ‘hypothesis’ is in shambles and you’ll have no affect on any of it. How does that make you feel. Warmer is better. I hope it keeps going this way.
@Bill Illis and those interested in the NW passage
I did not see in that video the trip made by Willem Barentz back in the 16th century. Both him and his crew got stuck in the ice going north from Holland but they tried to survive on Nova Zembla. Unfortunately they all died. Hence we have now the Barents sea up there.
In those days the Dutch flag was flying high on all seas so I donot think that Barents went looking for the NW passage unless there were strong historical and or anecdotal scriptural evidence that the NW passage did exist. Indeed, in hindsight, it seems likely now to me that the NW passage did exist in around 1100 AD. Namely, in the MWP it appears to have been warmer than it is now, as evident from the 2nd graph here,
http://wattsupwiththat.com/2009/12/09/hockey-stick-observed-in-noaa-ice-core-data/
so, really, there is nothing new or to be concerned about, even if the NW does open up a bit
….for a little while…
Walsh et al. put sources together to work out how much ice there was historically. They say September extent never went below 6 million sq km from 1850 until 2002, this is a more useful comparison than anecdotes about individual areas IMO.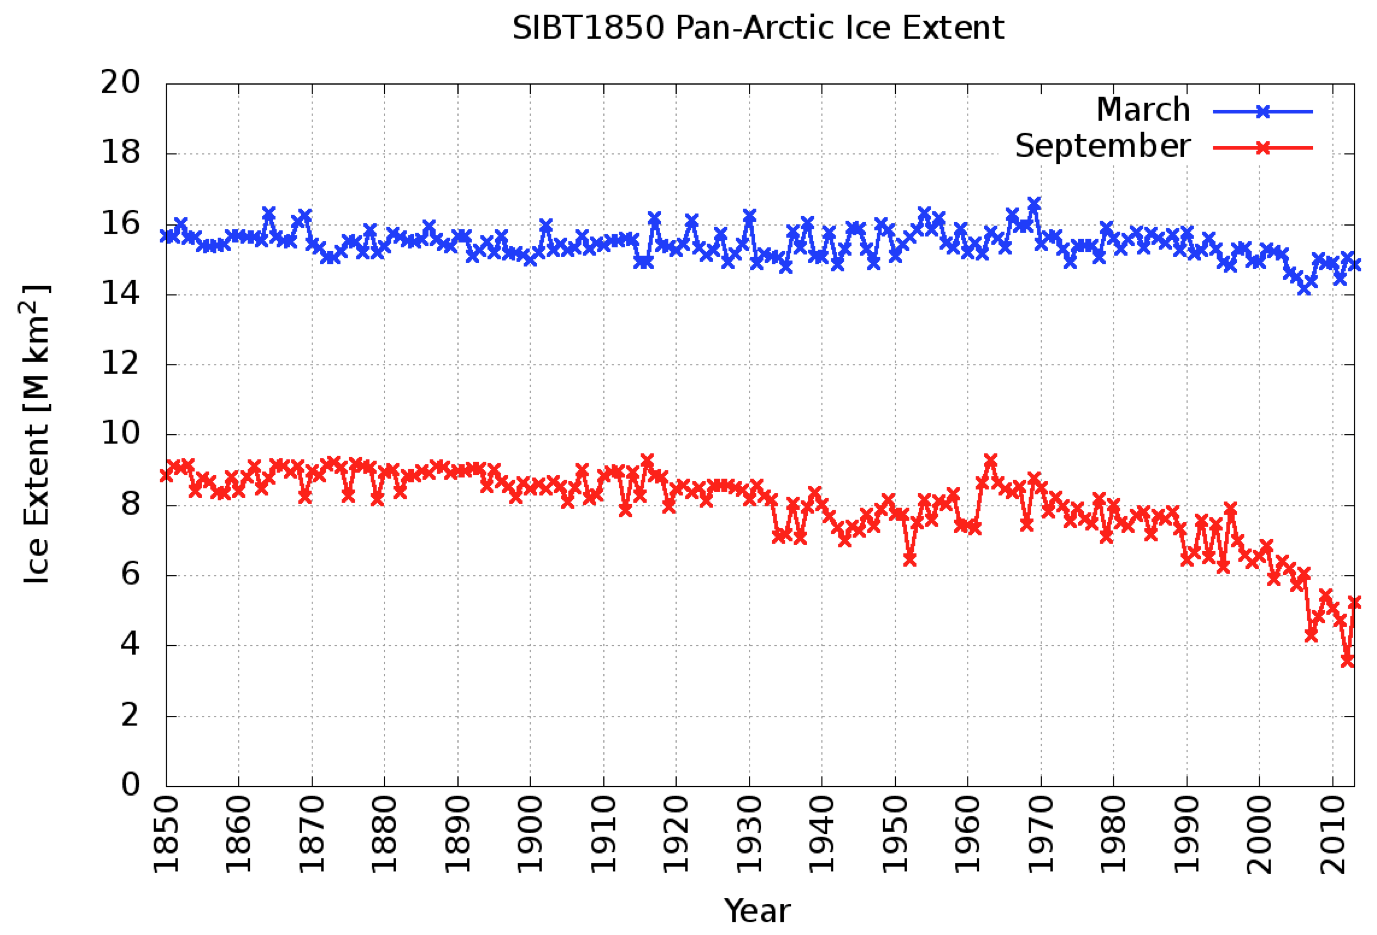 [/IMG]
https://www.carbonbrief.org/guest-post-piecing-together-arctic-sea-ice-history-1850
Not sure how to put an image in these posts:
[IMG
Does that affect anyone’s opinion here?
After carefully reading the initial post in this thread, I have spent the better part of two hours perusing the 213 (and growing) responses to this thread. I find the discussion fascinating and I’m grateful to all participants. I especially found Bartleby’s comments (September 23, 2016 at 10:55 am) to be helpful.
After carefully reading the Carbon Brief article “Piecing together the Arctic’s sea ice history back to 1850” mentioned several times in this thread I have spent about three minutes reading the comments. There are exactly two of them. The article,was posted August 11. Comments are now closed.
What can be appropriately inferred from the relative number of comments on both articles? I realize that Anthony’s blog is popular and I have a fairly good idea of why this is, but I was shocked at the near total absence of comments on the Carbon Brief article. This seems to be, after all, one of the truly crucial issues in the larger discussion about climate change.
Thanks, everyone.
cliosmith,
Having read the Carbon Brief article, what do you think of the historical Arctic sea ice record since 1850?
there is no man made warming (AGW), if that it what you are implying.
Namely, if there were, I should have found some noise in my minima graph here
but I found none.
(AGW is supposed to affect minimum T)
[On this site, please limit [ and ] to the moderators. .mod]
I have read Florence Fetterer’s guest post at the page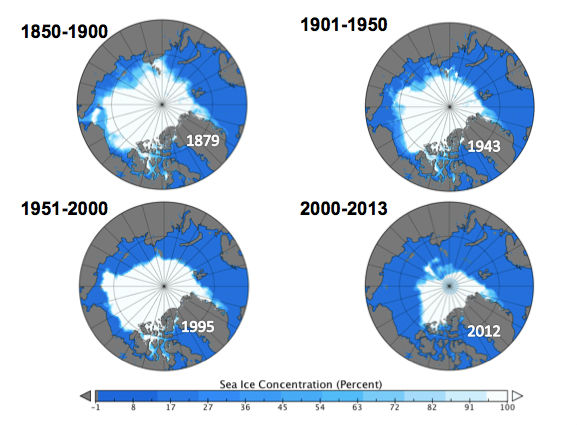

https://www.carbonbrief.org/guest-post-piecing-together-arctic-sea-ice-history-1850
proposed by MieScatter.
This guest post is quite interesting, and presents us a view somewhat differing from what we use to read, like “In earlier times it was warm as well in the Arctic” or “even warmer”.
This differing view manifestly is based on retrieval of many sources not present in earlier NSIDC compilations. These addenda led to a new record (for which there is unfortunately only a netcdf variant, no text data easy to read or download for anybody):
http://nsidc.org/data/g10010
We all know the the arctic region was to greater extents ice-free. But I did not imagine this:
nor a fortiori this
What disturbs me id that though Fetterer’s guest post is dated august 2016, the data presented here doesn’t go beyond 2012, known as a highly Arctic ice-arm year; I miss a representation of the slight recovery since then. That is a unnecessary missing which inevitably aliments suspicion.
Nevertheless we can draw at least one simple conclusion.
Should this data correctly reflect the past 150 years, so there is some evidence that the 35-year cycle idea imagined and presented here at WUWT by guest author Roger Graves has few chance to pass a deep scientific check, e.g. through a careful change point analysis:
http://www.changepoint.info/introduction.html
A look at the march and september plots lets rather thing of a major change point be detected around 1970. Prior to that date, both plots seem to show something like natural variability, and a decline since then, far more pronounced in september of course.
So?
The less arctic sea ice that is present in September, the greater the cooling effect the next seven months.
Many years, the greater the arctic ice area is in March-April, the smaller the area is in September.
Many years, the smaller the arctic sea ice area is in September, the larger the sea ice area is in March-April the next year.
From late-August until 1 April, the less sea ice there is, the greater the heat loss will be from the Arctic ocean.
Nothing of what you pretend is visible on the chart, so please come again when you have more substantial info.
What you wrote here is no more than a copy & paste of what you write everywhere as far as Arcitc sea ice is concerned. I know: it’s your leitmotiv, but repeating it all the tmie doesn’t make it more relevant.
Fine. I can always be convinced. By calculation, backed up by evidence.
So. Judith Curry has found that the average daily loss of heat energy from the Arctic sea ice at 78 degrees [latitude] in mid-August is greater than 2400 Watts-hrs/m^2. Now, that is for a much warmer period than any day in September, as the DMI average temperature plots for 80 north [since] 1958 show, and it does not include the heat energy losses [required] to freeze a surface layer of ice on any given melt pond on the arctic sea [ice] but let [us] conservatively assume that the open arctic waters in September lose 100 watts/m^ per hour to the air by evaporation and convection, to the seawater below by conduction, and to the arctic skies by long wave radiation.
Calculate the daily total energy difference gained by the arctic ocean by solar radiation, compared to what is gained by solar radiation onto the same area of average arctic sea ice for each day in September. Or for any day in September, for that matter.
Oh, and while you have the calculations and assumptions out, find out how extra solar energy is reflected by the average square meter of excess Antarctic sea ice that same day.
Nice reaction, but it is still no answer to what I was talking about:
– no evidence at all for a 35 year cycle there;
– decline starts around 1970 after 120 years with rather weak variability.
I have no idea about any cause for the second point, and I’m not a person explaining anything with AGW. Talking about credible causes interests me a bit more than an accurate evaluation of how much energy is lost by thawing.
And where does the energy needed for thawing after all come from? From a sun actually on full decline? From tentacular energy spent from far far away (5N-5S – 120-170W) by these good Niño guys?
At best one could guess after having read your prosa that that the increasing arctic sea ice decline from april till september at least helps in keeping the arctic sea ice decline from october till march somewhat lower 🙂
bindidon,
What strikes me this year is that though we have a tie with 2007 the low was very abnormally short compared to the other record lows: it rose 1 million suare kilometers from sept 10 to sept 30. This doesn’t comply with an arctic death spiral, more with “something is going on”
there are things happening in the arctic that we do not know of yet.
also comparing incomplete data from before 1979 with complete satellite data is adding an apple to a string of pears.
i’ pretty sure that if the arctic extend plot would be detrended that it will fit on the AMO index. Even the short reliable 37 year graph will show that.
Ooops! The chart must end in 2013 – and not in 2012! There is a visible sea ice recovery at the end, I didn’t look carefully enough at it. Apologies.
Again, similar to Global T, I don’t think we can compare data from before 1950 with todays’ data. It is again comparing apples with pears due to the method of collection of data – e.g non re-calibrated thermometers and human observation – instead of satellite / computed observations.
add on the Hudson bay company use of the North west Passage.
1937-
http://trove.nla.gov.au/newspaper/article/97897865?searchTerm=north%20west%20passage%20ice%20free&searchLimits=
and
1930
“PERILS OF ARCTIC
North-West Passage
THREE SHIPS GET THROUGH”
http://trove.nla.gov.au/newspaper/article/137078889?searchTerm=hudson%20bay%20company%20north%20west%20passage&searchLimits=
and not sure if this event happened-
1936-
NEW GRAIN RACE.
Dash Through North-West Passage.
http://trove.nla.gov.au/newspaper/article/40735753?searchTerm=wheat%20through%20the%20north%20west%20passage%20to%20england&searchLimits=
REPLY
Richard PERMALINK
September 17, 2016 11:42 am
SS MAnhattan went though the NWP in 1969.
REPLY
Richard PERMALINK
September 17, 2016 11:52 am
Richard Collinson was the first to take took his ship through the North West passage in the 1850’s.
“but Collinson took his
ship safely through to England. The
North-west passage was not again
made until Roald Amundsen navigated
the tiny Gjoa, a sailing sloop with
gasoline engine, from the Atlantic`’
http://trove.nla.gov.au/newspaper/article/66964441?searchTerm=richard%20collinson%20north%20west%20passage&searchLimits=
REPLY
richard September 25, 2016 at 8:10 am
1930
“PERILS OF ARCTIC
North-West Passage
THREE SHIPS GET THROUGH”
Didn’t happen, certainly in the usual sense of the word:
One ship travelled one way having left in 1928 and stayed near Gjoa Havn, and was met there in 1930 by a ship that came from the opposite direction, they exchanged some cargo and travelled back the way they had come. Nice bit of propaganda by the HBC.
http://trove.nla.gov.au/newspaper/article/137078889?searchTerm=hudson%20bay%20company%20north%20west%20passage&searchLimits=
and not sure if this event happened-
It didn’t.
Richard PERMALINK
September 17, 2016 11:52 am
Richard Collinson was the first to take took his ship through the North West passage in the 1850’s.
“but Collinson took his
ship safely through to England. The
North-west passage was not again
made until Roald Amundsen navigated
the tiny Gjoa, a sailing sloop with
gasoline engine, from the Atlantic`’
Again strange use of the word ‘through’, Collinson sailed into the western end of the NW Passage and explored it but then sailed out via the Bering Strait and returned to England via the Cape of Good Hope.
We also know that when regular satellite coverage became available in 1979,
______________________________________________________________________
We have quasi-regular satellite coverage as far back as 1961. We have some exceptionally interesting Nimbus HRIR (High Resolution Infrared Radiometer) and AVCS (Advanced Video Camera System) images from the Arctic from 1964, 1966, and 1969.
Here is a graphic from the NSIDC on Antarctic ice extent from Nimbus. There is much to learn from this early data…
Thanks for the hint -> http://cires1.colorado.edu/events/rendezvous/2011/posters/detail.php?id=4532 and other interesting sources I’ll search for when I have time to do.
Focus on the differences between 1964 and 1966 in the Arctic. You will be interested I assure you.
Here is another non-reader. Had you bothered to read my article on the Arctic in 2011 Energy and Environment you would know Arctic history by now. To start off, Kaufman et al. (2009) studied sediments in small Arctic lakes and determined that most of the last 2000 years there was nothing but a slow, linear cooling in the Aerctic. It ended at the turn of the twentieth century when a heat wave arrived unannounced. Warming continued until 1940 when cooling set in. The cooling lasted thirty years, until 1970, when the present warming returned. All of the Arctic warning data have been recorded after this date and none of these guys know what happened before. The warming cannot possibly be from the greenhouse effect because we know that no carbon dioxide was released when the warming started. It is very likely that what happened was a rearrangement of North Atlantic current system such that the warm Gulf Stream flow was aimed more directly at the Arctic Ocean. Spielhagen et al. (2011) measured the temperature of Atlantic water entering the Arctic and determined that it exceeded anything reaching the Arctic before this. The thirty year cold spell was probably caused by a temporary return of the previous flow pattern. But what happens in nature can happen again. It is not out of the question that another cold spell could appear and raise havoc with transportation in the Arctic.
True
global cooling on its way
1778:
“August 18 – reaches the ice pack at 70° 44’N., north of Icy Cape. Cook reported that in the early afternoon, sailing in a chilly mist, they encountered a wall of ice about 12 feet high, stretching from horizon to horizon. After noting that the pack ice was advancing at the rate of 15 miles in 10 hours, they of course then headed south again.”
http://www.explorenorth.com/library/yafeatures/bl-Cook1.htm
12′ high means 100′ thick. I’ve never seen this report discussed in a context of ice islands or any other. –AGF
The “death spiral” comments always make me laugh. The oldest ice in the arctic is not 4 billion years old (or whatever number you use for the earth’s age) so at some point the arctic was ice free, and now there is ice again. So the ice cannot “die”.
even more then you would conclude that “ice ages” are actually an exception rather then the norm in earth’s “life”…