At WUWT, we’ve gotten several tips about the XKCD cartoon that makes yet another “hockey stick” out of climate over recorded history. Nylo comments on WUWT Tips and Notes:
Marcott 2013 is still alive! Last to resurrect it is XKCD
Note the references vertically written on the right:

You can view it here: http://xkcd.com/1732/
Two things that make Josh’s take on it better (besides his superior artistic skills):
- The sources used are not just pro climate change like XKCD did
- It is factually correct, rather than illustrating a preferred narrative.
Here is is: prepare to scroll. Some people with lame un-updated operating systems, low RAM, and/or outdated browsers may not be able to see the entire thing.

The reference to Marcott http://climateaudit.org/?s=marcott
Top tip: Visit CartoonsbyJosh and give him a donation.
UPDATE: Chart corrected as per comments – the earlier version was posted before I had a chance to update. Any other comments and corrections are very welcome!
Discover more from Watts Up With That?
Subscribe to get the latest posts sent to your email.
Alarmists usually like to choose a start date for their temperature trends at a relatively cold period, Josh’s timeline would have been better to start ~16,000 years earlier to capture the peak of the Eemian IMO.
The Eemian was about 115,000 to 130,000 years ago.
Dear oh dear, I ran out of fingers and toes.
I did not know that glaciers reached all the way down to Boston and New York.
Doesn’t that mean that these places were once permafrost?
Long Island is the remnant of the “terminal moraine” of the last continental glacier — the pile of rubble pushed forward by the advancing wall of ice.
Cape Cod was under a lot of ice, too.
http://pubs.usgs.gov/gip/capecod/glacial.html
Even further south. In northern Princeton, there are many places you can find large rounded boulders that hitched a ride on the glacier and were left behind when the glacier retreated. There are three quarries that mine basalt from previous volcanic activity. To the east, say east of US 1, you will find triassic and jurassic sand as you head to the shore. With all of that, Princeton U has a geology lodge in Red Lodge, Mt. Go figure. Perhaps they enjoy the great small stream trout fishing.
Hmmm, according to xkcd, CO2 levels start to increase about 17,300 BC. I didn’t know that there were SUVs back then. And it continues to get the start of the industrial revolution wrong – I was taught, and even Wikipedia says, that the Industrial revolution began about 1760.
If memory serves me the Earth was at around 280 ppm for CO2 before the industrial revolution. If CO2 started rising back in 17,300 BCE then what the heck was it back then? Much lower than 280 ppm and plants can’t perform photosynthesis.
..Repeat after me…Up and Down, Up and Down…..etc…….
The warming period following Younger Dryas (i.e., starting about 12,000 years ago) had an associated large increase in atmospheric CO2 content (from about 190 ppm to 260 ppm, a 37% increase), and this obviously happened without any mankind-related burning of fossil fuels and associated mankind-related release of CO2 into the atmosphere.
Late Glacial Interstadial not Interstitial! ( or the Bolling Allerod Interstadial)
But I want to know when the Pastafarians first cooked their noodles.
Right after the Dogarians learned how to fry, not boil, their weenies ( in Garlic Butter) ?
Marcott 2013 is still alive! Last to resurrect it is XKCD
marcott is still alive – I thought even the most diehard climate alarmist accepted that the study has been throughly discredited
Brilliant work Josh
George McFly,
Heh, at first I read, “I’m your dentist.”
..And now, for something completely different…. ?oh=d46c0dac9fd0ae6bb39c1b37438e6f1c&oe=588105B3
Of topic in this thread:
game changing batteries.
There already exist drones the size of insects. Not that useful without fitting batteries.
https://www.seas.harvard.edu/news/2013/05/robotic-insects-make-first-controlled-flight
Then why did you post it???
Because I leave to [mod] to sort out.
Lovely work.
A crazy thought ran through my mind to fix XKCD with error bars. Just be glad you haven’t seen my cartooning. What about the error bars for any of this stuff?
Great comic Josh! Obviously it would make for a HORRIBLE comic, but I always find myself talking about the uncertainty in those old proxy reading with friends. We just have no way of knowing how quickly the earth cooled or warmed in those periods that meet our current standards of specificity. Whether it be, 1,000 years ago, 100,000 years ago or a million years ago. So when we talk about the current acceleration, it honestly means practically nothing to me.
Thanks, Josh! I have been waiting for this. Meanwhile, I decided to play around with a data extraction of the ‘modern’ component of the xkcd ‘data’.
The solid red line is a digitized version of the xkcd cartoon. The data points are the GISS data pulled from the NASA site. The red line is the smoothed version of the GISS data with a 39 year smooth and a 13 year shift in order to match the slope, the (missing) 1940s bump and the magnitude of the anomaly. No conclusions to be drawn except that, following their flawed sources, the cartoonist based it on data that, at best, ended at the beginning of the pause and involved a smoothing function that neither fits modern data nor is consistent with paleo estimates.
[IMG]http://i67.tinypic.com/20608s0.jpg[/IMG]
http://tinypic.com/view.php?pic=20608s0&s=9
Fixed it…I think …
I already did for you.
http://oi67.tinypic.com/20608s0.jpg
you realize, of course, it’s only 2016?
Thanks, Jeff.
probono: The last GISS data point is 2015. The red ‘dash’ at the end is the beginning of the xkcd extrapolation (oops … model projection).
great post Josh…the “hockey stick” is just bad statistics great that you footnoted the real world. Thankyou
I did not see a place for the greatest discovery ever by man, BEER.
The greening of the Sahara around 8000 BP was not due to more CO2, because CO2 was hardly over mid 9th century level then. The Saharan greening sas due to something else – probably a shift in precipitation patterns due to the warmer global temperature.
The invention of a “global average temperature” – a timeline and a hockey stick: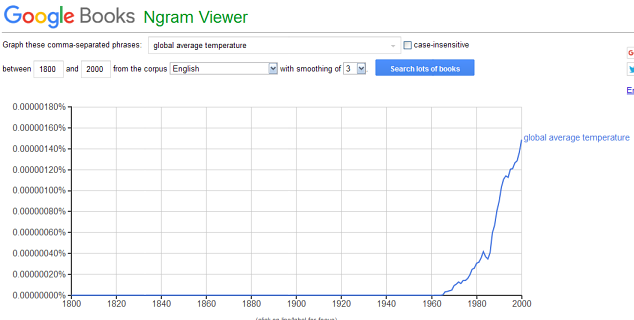
Josh’s Younger Dryas temperature changes are quite wrong. It should show a warming 16 times as fast as the past 160 years.
Josh might like to replot from here
ftp://ftp.ncdc.noaa.gov/pub/data/paleo/icecore/greenland/summit/gisp2/isotopes/gisp2_temp_accum_alley2000.txt
Tony,
Not so. A comparison of Josh’s Younger Dryas temperature changes and those from the GISP2 data you reference show that they are virtually identical when the GISP2 data are scaled down (by dividing by 4) to match the 4 C Last Glacial Maximum to preindustrial change estimated in Annan et al (2013) “A new global reconstruction of temperature changes at the Last Glacial Maximum” and shifted to a zero preindiustrial (1700-1800 mean) baseline. Try it.
My goodness. A cartoon should be precise, when paleoproxies themselves are anything but? Folks here have to get a grip. Splendid Josh cartoon. Contrast point to previous agreed. Else stop.
“Phoenetic alphabet” should probably be “phonetic alphabet” unless Josh is making a joke about Phoenicians I don’t get.
One thing noticeable in Josh’s timeline, and other reasonable paleotemperature reconstructions going back at least 20,000 years: The global climate was more unstable during the last glaciation and around the Younger Drias than it was after the warming that followed the Younger Drias. This seems to be from greater positive feedback from large variability of sunlit snow/ice cover from a temperature change.
I think the red-dotted projections in the Josh version should include at least the median (less-warming than the mean) of the two lowest, or the lowest and third lowest, of the four RCPs of the CMIP5 model projections. I expect the median of the projections in the lowest of the four RCPs of the CMIP5 projections to be close to what actually happens.
Alternatively, lump together the projections of the three lowest of the four RCPs, and plot the 10th percentile and the 50th percentile (median, which will have less warming than the mean). I expect the 10th percentile to be close to what actually happens.
None of the three red-dotted curves in the Josh version show and warming from now to 2150, which seems unrealistic.
Folks over at Climate Audit are asking Steve McIntyre to make his own assessment of the most probably Holocene temperature history. He is probably best placed to do so, having looked at the source data for all supposed reconstructions and thus having knowledge of the strengths and weaknesses of them all.
Here is a recent post by Steve at CA where he comments on attempts by the Australian climate establishment to bury and destroy the Antarctic Law Dome ice core data series:
https://climateaudit.org/2016/08/03/gergis-and-law-dome/
don’t miss this one from xkcd!
https://xkcd.com/1321/
Has Josh made his into a meme I can post on FB to counter the xkcd meme?