
As WUWT first reported yesterday, Arctic sea ice has reached the minimum and turned the corner. This press release from NSIDC today updates the date and minimum extent value.
BOULDER, Colo.—The Arctic’s ice cover appears to have reached its minimum extent on September 10, 2016, according to scientists at the National Snow and Ice Data Center (NSIDC). Arctic sea ice extent on that day stood at 4.14 million square kilometers (1.60 million square miles), statistically tied at second lowest in the satellite record with the 2007 minimum. The 2007 minimum occurred on September 18 of that year, when Arctic sea ice extent stood at 4.15 million square kilometers (1.60 million square miles).
“It was a stormy, cloudy, and fairly cool summer,” said NSIDC director Mark Serreze. “Historically, such weather conditions slow down the summer ice loss, but we still got down to essentially a tie for second lowest in the satellite record.”
“It really suggests that in the next few years, with more typical warmer conditions, we will see some very dramatic further losses,” said Ted Scambos, NSIDC lead scientist.
Arctic sea ice cover grows each autumn and winter, and shrinks each spring and summer. Each year, the Arctic sea ice reaches its minimum extent in September. The record lowest extent in the 37-year satellite record occurred on September 17, 2012 when sea ice extent fell to 3.39 million square kilometers (1.31 million square miles).
During the first ten days of September this year, the Arctic lost ice at a faster than average rate. On average, the Arctic lost 34,100 square kilometers (13,200 square miles) per day compared to the 1981 to 2010 long-term average of 21,000 square kilometers (8,100 square miles) per day. The early September rate of decline also greatly exceeded the rate observed for the same period during the record low year of 2012 (19,000 square kilometers, or 7,340 square miles, per day). By September, the air is cooling and there is little surface melt. This argues that that the fairly rapid early September ice loss was due to extra heat in the upper ocean. Recent ice loss was most pronounced in the Chukchi Sea, northwest of Alaska. NSIDC scientists said ice may also relate to the impact of two strong storms that passed through the region during August.
“This has been an exciting year with several record low extents reached during winter and early summer but thanks to a colder than average summer, more ice remained than at the end of 2012,” said Julienne Stroeve, NSIDC senior scientist. NSIDC scientists said there was a lot of thin ice at the beginning of the melt season, because thinner ice does not take as much energy to melt away, this may have also contributed to this year’s low minimum extent.

This animation above shows Arctic sea ice extent from 1979 through September 13, 2016. The black line is the 1981 to 2010 average, and the gray band around it shows ± 2 standard deviations for the same period. Yearly extents are color-coded by decade: 1979 to 1989 (green), 1990s (blue-purple), 2000s (blue), and 2010s (pink). This animation is adapted from NSIDC’s Charctic interactive sea ice graph.
Please note that the Arctic sea ice extent number for 2016 is preliminary—changing winds could still push the ice extent lower. NSIDC will issue a formal announcement at the beginning of October with full analysis of the possible causes behind this year’s ice conditions, particularly interesting aspects of the melt season, the set up going into the winter growth season ahead, and graphics comparing this year to the long-term record.
See the full analysis at NSIDC’s Arctic Sea Ice News and Analysis page.
See the NASA press release.
The National Snow and Ice Data Center (NSIDC) is part of the Cooperative Institute for Research in Environmental Sciences at the University of Colorado Boulder. NSIDC scientists provide Arctic Sea Ice News & Analysis content, with partial support from NASA.
This animation shows Arctic sea ice extent from 1979 through September 13, 2016. The black line is the 1981 to 2010 average, and the gray band around it shows ± 2 standard deviations for the same period. Yearly extents are color-coded by decade: 1979 to 1989 (green), 1990s (blue-purple), 2000s (blue), and 2010s (pink). This animation is adapted from NSIDC’s Charcticinteractive sea ice graph.- Earliest minimum since 1997 – shows how cold it is there
- This year extent was 22% above 2012, despite two massive storms
- Thickness is way up on 2010 and 2011
- Already extent is above 2007, as well as 2012, for this date
- We are looking at one of the fastest ice growths in September on record
https://notalotofpeopleknowthat.wordpress.com/2016/09/15/arctic-ice-growing-rapidly/
Discover more from Watts Up With That?
Subscribe to get the latest posts sent to your email.
37 years of data and we’re supposed to draw long term conclusions? If this year is 22%more than the 2012 minimum I wonder why he expects the coming years to be lower minimums? What trend would he attribute that to? Just looking at the history it would appear that the likelihood if higher minimums would be better than lower ones in the coming years. Unless of course you believe this is all being manually controlled by the trace gas CO2, then of course you might wonder why it’s 22% above 4 years ago with CO2 levels higher now than then? To me , it doesn’t appear to be alarming at all.
That’s what I was thinking. It’s nuts.
In fact we have good data going back to 1850… we can certainly say with confidence ice levels are now lower than in the 1920s to 1940s period.
Griff, you don’t have data going back to 1850 😉 You have guesses based almost entirely on ship logs, which are incredibly scarce. Data suggests there was some form of measurement taken.
The animation shows shows “1st year in the satellite record — 1979,” which is untrue.
Nimbus 5 was measuring sea ice extent with a passive microwave radiometer (which can observe ice through clouds) from Dec. 12, 1972 through May 16, 1977. Most of its sea ice measurement data (all except 1977) are on the NSIDC’s own web site, here:
https://nsidc.org/data/docs/daac/nsidc0009_esmr_seaice.gd.html
Inconveniently, however, the Nimbus 5 measurements show that Arctic sea ice extent was increasing during the chilly 1970s, and graphs of sea ice until about fifteen years ago showed 1979 as an anomalous peak. E.g., this is from the FAR (1990):
http://www.sealevel.info/ipcc_far_pp224-225_sea_ice2_1979circled_50pct.png
GISS have all but erased that 1970s cooling
Also it looks t me like the changes we see today in the arctic are of a lesser order than the past. The anomalies are smaller, look at 1979 and 1985
Those are two starkly contrasting conditions, there hasn’t been anything like that since really
Thanks, useful. 1979 was also anomalous in terms of date when min occurred.
What do you expect from an agency whose director infamously pronounced, “the arctic is screaming”?
Projection.
These aren’t really “changes”. They’re just statistical blips on a chart. Largely meaningless.
From a few days, the ice grows quickly in the central Arctic and Canada.
https://nsidc.org/data/masie/masie_plots.html
Has anyone seen a geneaology for the current polar observing satellites? There seem to be numerous sick sensors and I wonder how seamless a lot of measurements can be. Will the folks who run Cryosphere come back from wherever they are vacationing? Has the Naval Research Lab found another supplier?
They’ve lost interest since the data no longer fits their OMG alarmist hype. I predict that they will let if rot and only keep the melty bit.
They haven’t been tracking that ice for very long. Blip in the scale of time. So is the last 35 years. Waiting, waiting, waiting until we can all have a good long laugh at this….
For 8 out of the past 9 years, Arctic Ice Extent Minimums have been higher or equal to the 2007 low.
That certainly is NOT what the CAGW alarmists were predicting, and hilariously off from those “polar experts” that predicted a minimum of around 1 million KM^2 by 2015 and continuing at the level until humanity “took Global Warming seriously”….
Well,… any rational adult no longer “takes Global Warming seriously”, because it has become the biggest and most expensive junk-science scam in human history.
CAGW is dead.
Ice minimum scare is a misnomer, it’s area, not volume, volume matters. There are still millions who believe that the ice melted when a storm broke it up and compacted it because that fact is rarely if ever mentioned, as with 2012 and twice this year.
Wadhams and co allow people to believe it is because of warming.
An important bit is how long the minimum lasts, and the recovery, and the minimum was very short lived and the recovery looks good.
The obsession with one day per year cherry-picked from 365 days of data is politics, not science.
For the first time this year they got interesting in the other extreme but only since they could also start screaming about it being the “lowest on record”. Before this year it did not matter.
Many were excitedly saying this was going lead to another OMG summer min. having started at an all time low. But now we don’t see them saying this years change was surprisingly small since it was already low in March. That seems to be forgotten.
One thing is clear, larger areas of open water since 2007 have been accompanied by a slower rate of melting. This indicates a negative feedback, not the much heralded run-away melting.
The death spiral is dead.
And now the desperate cherry picking begins…
No, this did NOT tie – it was the second lowest extent… it was lower than 2007
See here:
http://www.iup.uni-bremen.de:8084/amsr2/
And as for Homewood:
•Earliest minimum since 1997 – shows how cold it is there
•This year extent was 22% above 2012, despite two massive storms
•Thickness is way up on 2010 and 2011
•Already extent is above 2007, as well as 2012, for this date
•We are looking at one of the fastest ice growths in September on record
The early minimum shows no such thing… and it is hotter up there than in previous years.
Thickness is not way up… does this look like its ‘thick’?
The rate of recovery and relative extent stuff is just nonsense…
You need to look at the extraordinarily broken up state of the ice as it hit minimum, plus note that the ice edge was way north at over 86 degrees..
Here’s a proper summary of what’s happened:
http://neven1.typepad.com/blog/2016/09/asi-2016-update-7-minimum-time.html
“It’s quite amazing, really. If there had been just a few weeks of open skies when the Sun was high in the sky during June and July, I think the 2012 record low minimum would have been beaten. As it is, this melting season comes in second.
I always thought that it would take extreme weather conditions as seen in 2007 for a melting season to end really low: Lots of open skies, warm winds and continuous compaction, just weeks and weeks of the same kind of weather. But given that there’s no let-up in the amount of heat flowing into the Arctic – via air and especially ocean – other set-ups can be just as destructive. It will probably be a back-and-forth of high pressure (open skies) and low pressure (dispersal, mixing) that will lead to new records, and eventually an ice-free Arctic.
That’s the big lesson for this year. Things just aren’t improving for the sea ice at all, and the fact that the cyclonic conditions we’ve seen this year, haven’t prevent the second lowest minimum on record, doesn’t bode well for the future at all.
Whatever it is we’re doing to stop this from getting worse in decades to come, we need to do it faster.”
The average melt from NSIDC 9.87 X 10^6 Km2 per year, 3 sigma is 1.64, so anything from 8.23 to 11.51 is ‘normal’. This year was 9.52, just BELOW average.
Griff, when are you going to address the yearly, there is no summer ice left predictions?
Why are the so called Arctic ice experts continually wrong in making them?
Who’s feeding Griff?
OH NOES!!!, we’re doomed. Climate change, dwindling arctic ice and the polar bears have finally been reduced to eating russian scientists to survive!! “Five Russian scientists are currently stranded in a small wooden shack in the Arctic, surrounded by a family of hungry bears.” http://www.bbc.co.uk/bbcthree/item/4ee744e6-4390-4768-8632-06c4e3ddff99?intc_type=singletheme&intc_location=bbcthree&intc_campaign=bbcthree&intc_linkname=vidclip_polarbear_contentcard27
How could they go to the Arctic without this essential piece of kit?:
http://www.dragunov.net/svd/svd_wood_550x.jpg
What caliber is required to “deter” a polar bear?
I have read through the posts trying to see if anyone else has said this and seeing as they have not probably means I am wrong. If it was genuine warming would it not be something that takes place over the whole year. I look at the data from the Danish site and there is never any increase during the summer months. It does not get as cold in winter but until things change in the summer I do not think it will ever be “ice free”
Well, not entirely. Average temp at the north pole sits at around 0 celsius in summer, but can go above that and does. Of course, you have areas where it is warmer than that. In winter, it drops to around -40 C, so even if it was warming, in winter it would need to be something spectacular to stop ice from forming. So the issue is always how much melting will occur in the summer months and what drives that melting. It is unlikely to be a .12 c decadal increase, so you either have to believe in arctic amplification of warming (I haven’t looked into it much) or you need to believe that the ice melting is primarily driven by ocean currents and wind. You then need to look at and understand what drives those and I don’t think you can really link that to CO2.
“If it was genuine warming would it not be something that takes place over the whole year.”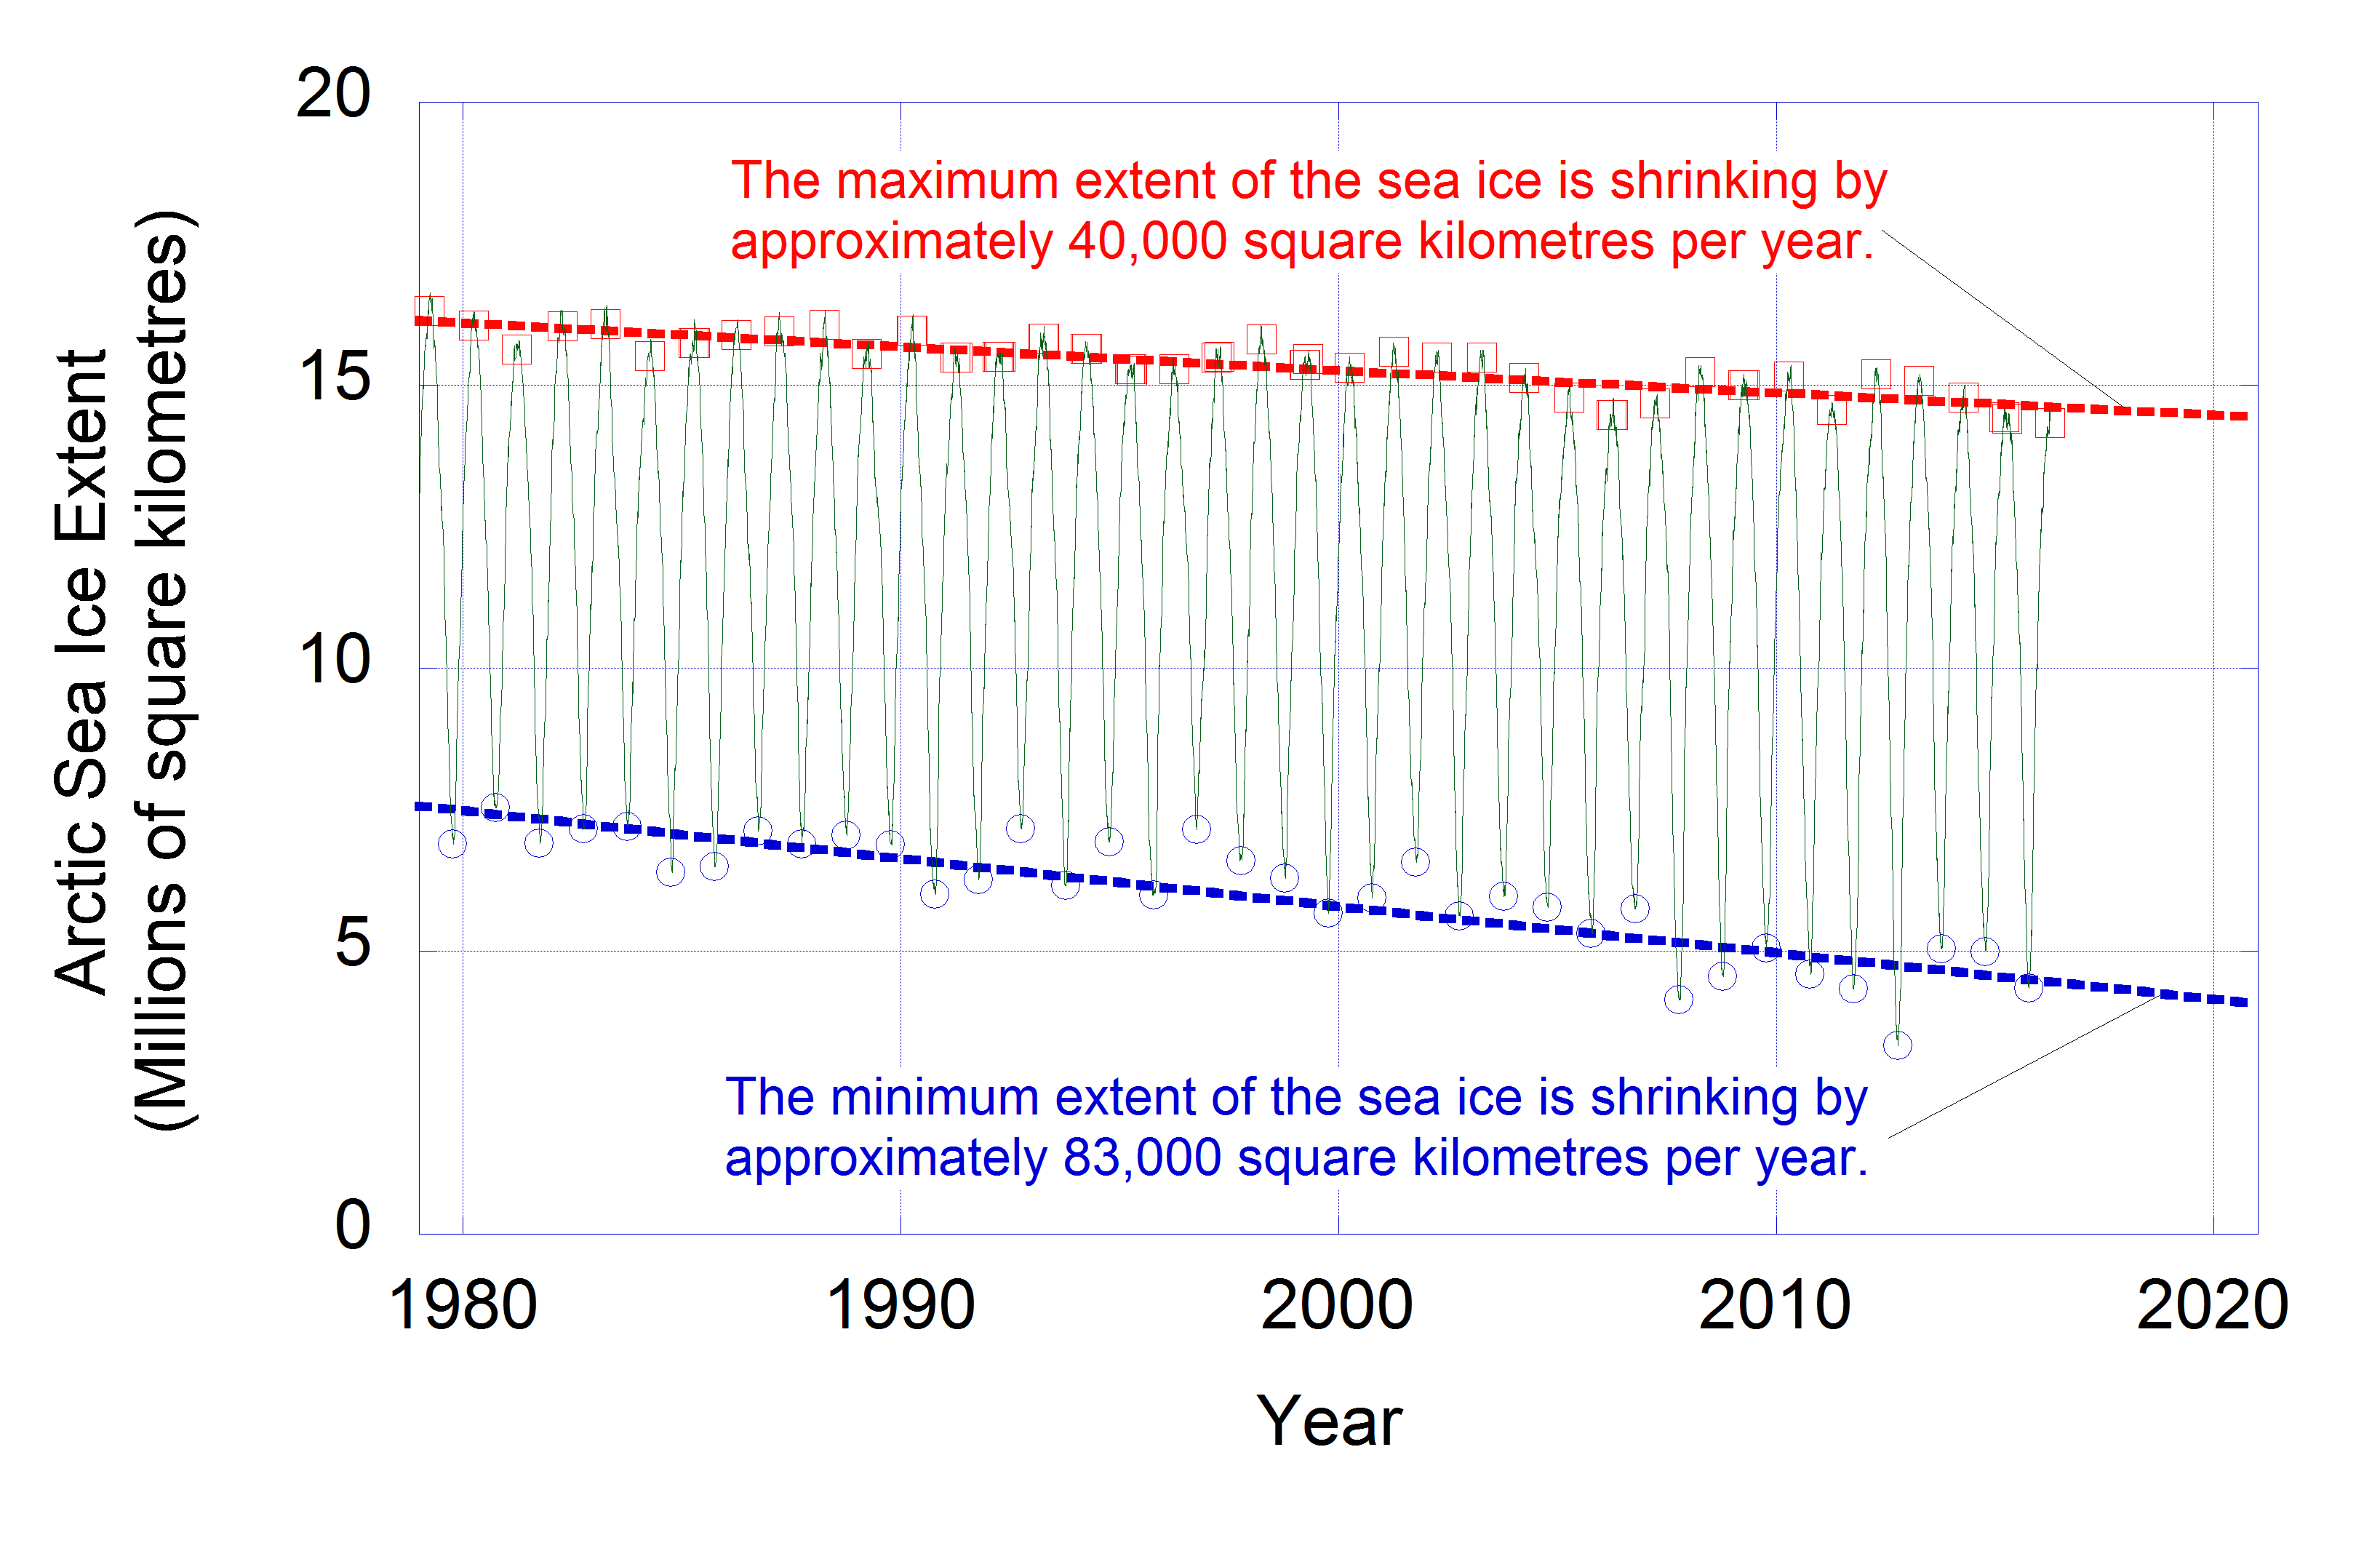
Yes, that is why there is also a trend in spring maxima.
Andrew Bennett
“If it was genuine warming would it not be something that takes place over the whole year.”
______________
It is taking place over the whole year Andrew. 2016 Jan to August has seen the lowest Arctic sea ice extent in the satellite record over that period and 2016 as a whole looks very likely to set a new lowest annual average Arctic sea ice extent record.
Every calendar month shows a downward trend in Arctic sea ice extent since 1979. It’s more pronounced between July and September, but even in winter the rate of Arctic sea ice loss has been -0.45 million km^2 per decade (NSIDC data) since 1979. That’s a total reduction of 1.72 million square kilometres of Arctic sea ice in winter (Dec-Jan) between 1978/79 and 2015/16.
does it really matter since Antarctic ice is growing and virtually replaces any losses in Arctic ice. Here is the global ice chart since 1979, show me the big losses. http://arctic.atmos.uiuc.edu/cryosphere/IMAGES/global.daily.ice.area.withtrend.jpg
Also, Antarctic sea ice has a many times greater effect on planetary albedo than does Arctic.
Well, it is not “many times”, but we are able to show that, over the course of a year, for equal assumptions about atmosphere clarity north and south, every square meter of the Antarctic sea ice does receive and reflect (or receive and absorb – depending on how you want to phrase it) 1.7 times the solar energy that the Arctic sea ice reflects.
Seven months of the year, LESS Arctic sea ice means increased heat losses from the Arctic ocean, and only five months a year (April – August) is there any gain at all from a loss of Arctic sea ice into the open (darker) arctic ocean waters.
RA,
The way I calculate it, Antarctic sea ice at its maximum extent has about five times the albedo effect of Arctic at its edge. Antarctic ice can go to much higher latitudes than can Arctic, which is largely surrounded by land. The angle of incidence of incoming sunlight at higher latitudes multiplies the effect.
Your calculation must be for the whole area covered.
Almost. The difference could also be in the subtleties of the calculation: the differences in sea ice albedo between north and south, the difference in top-of-atmosphere SW radiation each day of year between north and south, and the differences in ocean water albedo at each incident angle. As you point out, there is always greatly increased atmosphere absorption up north on to the Arctic sea ice.
Reasoning that there is ALWAYS some direct solar energy absorbed by sea water (sea ice) when it lands on the open ocean, and ALWAYS some direct solar energy reflected by the sea water (sea ice) when it lands on the open ocean,
and that the same amount of direct (or diffuse) solar energy will fall on the sea ice as falls on the open ocean,
I calculate the DIFFERENCE in energy absorbed between what is absorbed by the open ocean compared to what is absorbed by sea ice at the same latitude on the same time of day at the same day of year.
Further, reasoning that the albedo of sea ice changes differently in the north and south over the year, the albedo of open ocean changes based on time of day (incident angle of the sun), and the TOA radiation level changes over every day of the year, do not use average values at all. Instead, I calculate the total Daily Reflected Energy-Absorbed Direct Energy Difference for every hour at the average latitude at the edge of the sea ice area for every day of the year. So, this DREAD Energy Difference shows the theoretical difference in heat energy absorbed into the open ocean if any square meter of sea ice is replaced by open ocean each day of the year.
By totaling the Daily Energy differences over the course of a year, you get the yearly difference. The yearly total removes the distraction often used to allow the use of yearly average radiation levels at TOA, and the distraction of “slower arctic summer solar transitions” and “24 hours of sunlight” in the arctic – while ignoring the five months of the year when the arctic sun is not even above the horizon at the latitudes where the sea ice accumulates.
Yes, you are correct: The hourly energy budgets (heat received and absorbed) are much higher in the Antarctic than in the Arctic.
The sun is much higher in the sky through the entire year in the Antarctic than in the Arctic.
Antarctic atmospheric absorption is much less, and when the Antarctic sea ice is in its 24 hours of summer sunlight, the TOA radiation levels are 90 watts/m^2 higher than in the Arctic summer months. (The Antarctic sea ice is also much cleaner and “brighter” than the measured Arctic sea ice during each hemisphere’s summer melt season, so the Antarctic sea ice – which tends to melt-from-below, has a higher albedo than the arctic sea ice.)
EVERY measure causes the Antarctic sea ice to be more important than the Arctic sea ice in the earth”s total heat budget over the course of the entire year.
(All figures from NSIDC: ftp://sidads.colorado.edu/DATASETS/NOAA/G02135/)
Since satellite records started in November 1978 the Antarctic has gained sea ice extent at a rate of around 240,000 km^2 per decade; a total gain of 920,000 km^2. Over the same period the Arctic has lost sea ice extent at a rate of 370,000 km^2 per decade; a total loss of 1,390,000 km^2. The net change in global sea ice extent since November 1978 is therefore a reduction of 470,000 km^2 and the net rate of reduction over the period is 120,000 km^2 per decade.
Whether or not this matters, or represent ‘big losses’ depends on a number of factors. Perhaps most importantly that all the losses have occurred in the northern polar region.
+ 10
“Paul Homewood passes these point on via email:
•Earliest minimum since 1997 – shows how cold it is there
•This year extent was 22% above 2012, despite two massive storms
•Thickness is way up on 2010 and 2011
•Already extent is above 2007, as well as 2012, for this date
•We are looking at one of the fastest ice growths in September on record”
Wonder if the follow-up to the preliminary report will mention any of those?
/sarc /cynic
Since this IS this the same “scientists” who made the statement that the Arctic could be ice free by 2008, one wonders why they continue to believe in dramatic climate change caused by increasing CO 2 which has not had any recent impact. Do they learn from their mistakes?
http://abcnews.go.com/Technology/story?id=4728737&page=1
“You know when climate change is biting hard when instead of a vast expanse of snow the North Pole is a vast expanse of water. This year, for the first time, Arctic scientists are preparing for that possibility.
“The set-up for this summer is disturbing,” says Mark Serreze, of the US National Snow and Ice Data Center (NSIDC). A number of factors have this year led to most of the Arctic ice being thin and vulnerable as it enters its summer melting season.
In September 2007, Arctic sea ice reached a record low, opening up the fabled North-West passage that runs from Greenland to Alaska.
The ice expanded again over the winter and in March 2008 covered a greater area than it had in March 2007. Although this was billed as good news in many media sources, the trend since 1978 is on the decline.
Young and Thin
Arctic ice at its maximum in March, but that maximum is declining by 44,000 km2 per year on average, the NSIDC has calculated (see graph, top right). That corresponds to an area roughly twice the size of New Jersey.
What is more, the extent of the ice is only half the picture. Satellite images show that most of the Arctic ice at the moment is thin, young ice that has only been around since last autumn (see picture, right).
Thin ice is far more vulnerable than thick ice that has piled up over several years.”
Arctic sea ice appears to have turned the corner and is expanding so quickly and looks though it is going into the long term average range. However antarctic sea ice appears to be showing the opposite and is now at all time record low max extent according to the antarctic sea ice chart.
It is lower than it has been in recent years, but I can’t see anything on the charts to say it is a record low extent. What are you looking at?
It is incredibly interesting how the drop in the antarctic this September is as drastic as the increase in the Arctic…
What these guys forecasting the demise of the ice do not comprehend is that the arctic SUMMERS ARE NOT WARMING The DMI site here shows that plainly. In fact the last 5 years together appear colder than 1960-1965. The warming has been in winters where it leads to decreased seasonal growth, but it cant melt beyond a certain limit if the arctic summer is not warming. But nature is showing you she has her caps and the arrogant forecast, given the predictions of no ice and the death spiral proclamation shows ignorance of the simple fact that they have no idea if summers will warm, and have busted horribly on all this. But that is how it is nowadays. Push it back and stay on the attack. In fact with the IOD flipping, the PDO likely to go back to cold in coming years and the AMO coming out of its warm cycle, I suspect they understand they need to push the hysteria now because the true recovery is around the corner.
Hi Joe 🙂 I read your twitter often. Any insights into winter for Eastern Europe this coming season?
Actually, I would challenge even that observation; The DMI latitude 80 weather “forecasts” are not actually measurements – there never has been a single calibrated thermometer screen at 80 north that has lasted even part of one season, much less all seasons in the same place since 1959. ”
However, the DMI 80 north average temperature for the summer months has not even moved 1/10 of a degree in 60 years of “global warming” in the Arctic – the place theoretically most susceptible to CO2-induced warming! Winter months? Yes, those average temperatures have increased. (I do question their “average baseline” line in winter: Seems like there would be at least half the times the winter daily temperatures would have to be “below average” if there were to be an “average” at all. but even winter air temperatures as early as 1960-1970 are at today’s levels of +3 to +4 degrees “above average”. )
But the summer temperatures at 80 north have not changed at all.
Joe Bastardi on September 16, 2016 at 6:18 am
What these guys forecasting the demise of the ice do not comprehend is that the arctic SUMMERS ARE NOT WARMING The DMI site here shows that plainly.
Could you show us your source at DMI?
If you extract the arctic region (all stations within 60-90N) out of the raw unadjusted GHCN V3 record
and produce a monthly average out of it, you may, in a second step, produce
– for each winter sequence ‘oct nov dec jan feb mar’
and
– for each summer sequence ‘apr may jun jul aug sep’
the sum of the monthly values, and finally average these sums.
The result since october 1978, wrt the UAH baseline 1981-2010:
– winter months: 0.61 °C
– summer months: 0.79 °C
Are you incapable of thinking for yourself? Of looking at the data yourself?
There are NO stations between 72 north and 85 north – where the arctic sea ice actually is! – that can be used to produce your supposed average monthly 60-90 north records!
At best you can cite a few coastal land-based stations “almost” at the sea ice part of the year. But those are not measuring air temperatures over the sea ice, they are measuring the 2 meter air temperatures on the beaches 40-800 kilometers away from the sea ice in mid-summer.
The DMI DOES have daily weather forecasts for 80 north latitude since 1958 at
http://ocean.dmi.dk/arctic/meant80n.uk.php
Now, click on EVERY year’s plot since 1958. There is NO increase in summer temperatures in that record (those forecasts) since 1958. Now, how many kilometers of newly greening tundra and steppe and timberland are there between 80 north sea ice and 60 north tundra and forest? (Hint: How many kilometers per degree latitude at sea level x (80-60) = … )
Should you not wish to click that many times, a simple gif program can produce a permanent scrolling image.
Your monthly averages for 60-90 north land stations are irrelevant to the 50+ years of steady air temperature above the sea ice in mid-summer. There is NO arctic sea ice in mid-summer between 60 north and 72 north latitudes!
RACookPE1978 on September 18, 2016 at 1:52 pm
There are NO stations between 72 north and 85 north
Aha. I see in the GHCN station list 47 units between 70 and 85N. Minus 14 between 70 and 72N gives 33. Not much, of course!
The DMI DOES have daily weather forecasts for 80 north latitude since 1958 at
http://ocean.dmi.dk/arctic/meant80n.uk.php
I know of this chart, RACookPE1978. Since longer time. Many thanks.
What you imho do not want to be taken into account is simply the fact that the arctic region indeed isn’t warming very much above 80N recently, but the 60-80N stripe really is heavily warming, at a rate of about 1.25 °C / decade since 1979.
And that is what I’m talking about. Should this be irrelevant in your mind: no problem for me.
I repeated my little averaging on winter and summer months anomalies since 1979, this time restricted to the 70-80N stripe:
– winter months: 0.17 °C
– summer months: 0.52 °C
There is a point where we probably will have exactly the same meaning: in comparison with 1980-2016, the temperatures in the Arctic were by far higher 100 years ago! You just need to sort the temperature list since 1880 to be convinced about that fact.
But that was not the point in my answer to Joe Bastardi.
To repeat, the only sea ice between 60 north and 72 north is Hudson Bay, Bering Sea, and the Okhotsk Sea. All of these have melted by mid-summer, so they have no effect on sea ice totals after mid-summer. There is NO arctic sea ice below 72 north, and NO land thermometers where the sea ice actually is in the summer. Your averages are meaningless for discussions of the air temperatures above the arctic sea ice
Bindidon says:
…in comparison with 1980-2016, the temperatures in the Arctic were by far higher 100 years ago!
That’s exactly what we would expect, since the Little Ice Age has been tapering off for several hundred years now.
Natural climate variability is still the default “simplest explanation”, per Occam’s Razor.
Why do you feel compelled to find another explanation?
RACookPE1978 September 18, 2016 at 5:32 pm
There is NO arctic sea ice below 72 north, and NO land thermometers where the sea ice actually is in the summer. Your averages are meaningless for discussions of the air temperatures above the arctic sea ice
How about Alert?
https://en.wikipedia.org/wiki/Alert,_Nunavut
A good point. Thank you. (But is it accurate if I use the Alert hourly weather data for approximating the “weather” around the entire pole? To date, I have not done so. )
Reversing the comment that began this, how closely does the Alert weather data since its founding track the 60-90 degree averages that ARE assumed to be accurate for the trends across the ice fields. More than half the time, the Alert winds are from the islands and land to the south, not the arctic sea to its north.
It’s been 4 years since the lowest and 9 years since the second lowest. Yet they keep telling us that next year is the year the collapse will begin.
Denial, it’s not just a river in Africa.
‘Arctic sea ice extent on that day stood at 4.14 million square kilometers . . ., statistically tied at second lowest in the satellite record with the 2007 minimum.’
Are the numbers in yet for how many people died from this?
I find it particularly disturbing when the US military establishment jumps on the CAGW platform.
“U.S. defence experts and military officers sound alarm about climate change”
http://ottawacitizen.com/news/national/defence-watch/u-s-defence-experts-and-military-officers-sound-alarm-about-climate-change
“Climate change is increasing the risk of international conflict and putting U.S. national security at risk, warns a coalition of 25 retired officers and Democrat and Republican security experts. “There are few easy answers, but one thing is clear: the current trajectory of climatic change presents a strategically-significant risk to U.S. national security, and inaction is not a viable option,” said a statement signed by the security advisors and published by the Center for Climate and Security in Washington.”
We will soon be firing arrows into the sea in order to defeat Neptune. GK
THey won’t be firing arrows. They will be strapping bombs to dolphins.
The US Military says what the Commander-in-Chief tells them to say. If that C-in-C changes and orders them to say “Global Warming is a hoax” and climate is not relevant they will do so or be retired. According to the Constitution our National Defense is under civilian control.
37 years??
We’ve only just begun to measure Arctic sea ice extent.
Given this scant 37 years of satellite data,
We really know nothing of the history of Arctic
sea ice extent.
Any reference to “history” on this subject is a thin argument at best.
(150 years of temperature data hardly describes “history” either.)
Believe it or not, but it’s better to worry about firewood for the winter.
And in 2007 they were saying the Arctic would be “ice free” by 2013, see report here:
http://news.bbc.co.uk/1/hi/sci/tech/7139797.stm
Er, that would be a no.
Where there will be more ice?
https://earth.nullschool.net/#current/wind/isobaric/500hPa/overlay=temp/orthographic=4.74,97.41,452