Guest essay by Andy May
![Holocene_Temperature_Variations_Rev[1]](https://wattsupwiththat.files.wordpress.com/2014/09/holocene_temperature_variations_rev1.png?resize=600%2C405&quality=75)
The Holocene Thermal Maximum, also called the Holocene Thermal Optimum, occurred at different times in different parts of the world but generally between 10,000 BP and 4,000 BP. I use BP to indicate years before 2000. The world ocean was probably 0.7°C warmer than today 8,000 BP. This is remarkable because the ocean heat capacity is 1000 times larger than the atmosphere’s according to the IPCC and NOAA. Simple high school physics is all that is required to verify this, the calculation is described here. What this means is that if you heated the atmosphere to 1000°C and transferred all of that heat to the ocean, the ocean would only warm 1°C once the heat was well mixed. We can draw two conclusions from these facts. First, the world was much warmer 8,000 BP than today and the total heat stored in the atmosphere and in the oceans was much greater. That 0.7°C represents the heat required to warm the atmosphere to over 700°C. This would never happen, of course, ocean-atmosphere heat transfer processes would work to move heat from the ocean to the atmosphere and back again to keep temperatures moderate and stable.
The second conclusion is that there is no magic 2°C tipping point. Raising todays atmospheric temperature 2°C involves an insignificant amount of heat relative to the total ocean/atmosphere heat present only 8,000 years ago. If the oceans absorbed 2°C worth of atmospheric heat, the ocean temperature would only go up a trivial and unmeasurable 0.002°C. Bob Tisdale shows while we have good Argo float data from 0-2000 meters, these depths only include about one-half of the volume of the oceans. NASA has shown that the water below 2000 meters has shown no detectable warming. The key point is that the oceans will mitigate any atmospheric warming, man-made or not. Direct infrared radiation from greenhouse gases probably warms the oceans a little, but direct solar radiation does most of the work. Longer term ocean/atmospheric heat transfer (like evaporation, ENSO and other processes) do transfer a lot of heat from the atmosphere to the oceans and back again to stabilize the system. The graph below (Figure 1), made from data from the NOAA web site, shows that the world ocean average temperature has only gone up 0.1°C in the last 60 years, less than the error in the data. The precision of the ARGO thermometers is very good, +-0.002°C, but the accuracy is only 0.5°C over most of the world ocean.

Figure 1
There seems to be general agreement that the cause of the Holocene Thermal Maximum is the Earth’s precession cycle. As described in Michael Bender’s book “Paleoclimate,” a part of the Princeton Primers on Climate series:
“The orientation of Earth’s spin axis has changed over the past 10 Kyr so that northern summers now occur when Earth is farthest from the sun, whereas at 10 Ka [10,000 BP] they occurred when Earth was closest to the sun. Northern summertime insolation reached a maximum at about 10 Ka and has declined to the present, when it is near the minimum.”
Bender has determined that remnants of the Laurentide Ice Sheet (LIS) from the last glacial period contributed to cooling many northern areas and delaying their warm periods. These areas, like Western Europe had their climate optimum between 4,000 BP and 7,000 BP. In Germany and Scandinavia mean annual temperatures were warmest 6,000 BP to 7,000 BP and they have since fallen 2.5°C. In Alaska and western Canada the thermal maximum occurred 4,000 years before it occurred in northeast Canada and again the LIS was to blame.
The world ocean is all connected and currents distribute heat from one area to another. While the ocean is never at thermal equilibrium, over long periods (hundreds of years) heat can be redistributed all over the world. Rosenthal, et al, 2013 chose an area in Indonesia that is well located to reconstruct past Pacific Ocean heat content. They used a suite of sediment cores from the sea floor of the Makassar Strait and the Flores Sea (see Figure 2 below) to perform the reconstruction. These areas are major conduits for the exchange of water between the Pacific and the Indian Oceans and collectively they are referred to as the “Indonesian Throughflow.” The shallower current (0-200 meters) is from the North Pacific Ocean and the deeper current gets a large contribution from the Banda Sea and the South Pacific. The study uses both Magnesium/Calcium ratios and Oxygen isotope ratios in Foraminifera to reconstruct the temperatures of the past. Because the Foraminifera studied live at different depths reconstructions of both the surface temperatures and the intermediate depth temperatures were possible.

Figure 2
Figure 3 is taken from a portion of Figure 2 in Rosenthal, et al. 2013. In graph A the green curve is the reconstructed average surface water temperature for 30°N to 90°N latitude and the red curve is the reconstructed global average surface water temperature. In graph C the Northern Hemisphere (30°N to 90°N latitude) reconstructed average intermediate water temperature for a depth of 500 meters is plotted. Both plots show that Northern Hemisphere ocean temperatures between 9,000 BP and 7,000 BP were 2.5°C+-0.4°C warmer than the late 20th Century. Global Ocean temperatures are estimated to be 0.7°C warmer than in the late 20th Century.

Figure 3
In addition to warming the northern oceans, the Earth’s precession cycle also moves the “ITCZ” or the Intertropical Convergence Zone according to Michael Bender’s “Paleoclimate.” The ITCZ is a zone of warm rising air and high precipitation. This zone follows the sun, so when the Earth was closest to sun in the northern summer 10,000 BP the ITCZ was farther north and the Northern Hemisphere tropics received more rain. Currently the ITCZ is roughly centered on the equator (5.3°S to 7.2°N). In Africa, as everywhere on land, it moves a lot from summer to winter. However, it stays south of the Sahel, about 15°N. This process contributed to the Sahara region becoming a desert roughly 5,000 BP as the ITCZ moved south. In China, An, et al, have found that the peak monsoon precipitation event moved from northern China 10,000 BP to Southern China 3,000 BP. This suggests that China has been getting progressively cooler and drier over the last 10,000 years.
Climate and climate change are long term processes. Looking long term, it is clear the Earth and especially the Northern Hemisphere are cooler today than 7,000 BP and we are in a cooling trend. For a longer perspective see my previous post “Climate and Human Civilization over the last 18,000 Years.” Might this trend be changing and might it be due to man’s influence? Perhaps, at least in part. But, it is very premature to predict a disaster based on a shaky 150 year surface temperature record. Particularly when the record does not agree with existing atmospheric balloon and satellite datasets that are of arguably better quality. Further, it is clear that the enormous heat capacity of the world ocean will dampen any radical atmospheric temperature changes. Basically, there is nothing to worry about, no radical action is required.
One more point, the media and the climate alarmists like to say that the reason atmospheric temperatures are not rising with the increase in carbon dioxide is that the extra heat is “hiding” in the deep ocean. It has to be the deep ocean because measurements of shallow ocean temperatures have not shown any excess warming. Certainly, as we have seen, most of the heat is going into the oceans. But, the temperature rise caused by that transfer is very small. Since heat only moves from a warmer object to a cooler object, the heat will never exit from the ocean until the atmospheric temperature drops. At that point we will want that heat. If indeed, carbon dioxide is causing more heat to be trapped in the atmosphere, the oceans are the perfect place for it to go.
Dave,
Lots to discuss here so I’ve made a few comments and will send you more with data via email.
“Re: the synchronous timing, isn’t there a difference between short term and long term events? For example, the ‘polar see-saw’ is a shorter term contra-indication of NH and SH ice cover; when one hemisphere rises or declines, the other tends to move in the opposite direction.”
“(This sounds like a nitpick now that I’ve written it; sorry.) But on longer time scales it’s clear that the poles are in excellent agreement in their temperature trends — which indicates that they are a very good proxy for global T changes, such as the MWP and LIA. ”
Among many others.
Do you think that is correct? (You’re the expert here, and I am taking full advantage of your knowledge, if you’re still willing to comment. ☺)
The postulated “polar see-saw” is contradicted by a large number of recently published 10Be and 14C dates on moraines in North America and New Zealand. I’ve worked extensively on this issue and what is now apparent is short-lived, abrupt climate changes that occurred between about 13,000 and 10,000 years ago were almost exactly synchronous in both hemispheres, although not with the exactly the same strength.
“Next, regarding your “flickered” comment, those observations may simply be an effect of the changeover from one state to another. How is that either due, or not due, to orbital changes? I have a hard time following that argument to its conclusion.”
It’s basically simple–multiple, abrupt, drastic temperature changes occurred within the late Pleistocene k(Dansgaard-Oerscher events), none of which could have been caused by precession or other orbital changes because they are very slow acting.
“Or following your premise that whatever the cause of the ‘flickering’ is, it must also be a cause of glaciations. How does that follow?”
If some other cause can produce multiple climate changes of full glacial strength, then it must be possible to cause any glaciation without orbital changes.
“Does the observed ‘flickering’ have to be a cause, and not just an effect? It seems that since nothing in nature is a smooth sine wave, that ‘flickering’ could just be noise.”
Not a chance! Vast amount of data shows it is not random noise.
As Prof Lindzen wrote (elegantly, IMHO):
Climate is always changing. We have had ice ages, and warmer periods when alligators were found in Spitzbergen. Ice ages have occurred in 100,000-year cycles for the last 700,000 years, and there have been previous periods that appear to have been warmer than the present, despite CO2 levels being lower than they are now. More recently, we have had the Medieval Warm Period, and the Little Ice Age. During the latter, alpine glaciers advanced, to the chagrin of overrun villages. Since the beginning of the 19th Century these glaciers have been retreating. Frankly, we don’t fully understand either the advance or the retreat… For small changes in climate associated with tenths of a degree, there is no need for any external cause. The earth is never exactly in equilibrium. The motions of the massive oceans where heat is moved between deep layers and the surface provides variability on time scales from years to centuries. Recent work… suggests that this variability is enough to account for all climate change since the 19th Century. [my emphasis]
Do you agree with Lindzen’s analysis?
As far as it goes. The oceans certainly control climate, but what he doesn’t say is what causes the oceans to change? It has to be something external.
“If it’s correct, then where is there any room for the claims of ‘dangerous man-made climate change’? My argument for several years now has been that if “dangerous AGW” is occurring, then it must be significant enough to measure the man-made fraction of global warming (out of total global warming from all causes, including orbital changes, the MWP, ocean effects such as the AMO, etc., and other entirely natural causes).
There are so many climate changes that occurred before any possible AGW CO2 increase that the whole idea of CO2 driving climate is absurd. The only possible period of AGW is after 1950 (but we had 30 years of global cooling after that, so it’s really 1978 to 2000). I’ve document 40 periods of warming and cooling since 1500 AD (with no possible CO2 caue) that we have experienced recently is entirely within natural bounds. The amount of increase in atmospheric CO2 during the 1978-2000 warming was only 0.004% and that’s for a gas that makes up only 3.6% of greenhouse gas.
But to the best of my knowledge no one has ever produced any verifiable, empirical, testable measurements of AGW, which are acceptable to the general scientific community, that are replicable per the scientific method, and which specifically quantify the fraction of AGW out of all global warming, including warming from natural forcings.
Sorry to be so wordy, but those questions cut to the heart of the entire debate: is AGW a serious problem? Or is AGW, as Willis Eschenbach argues, just a small, 3rd-order forcing that is swamped by 2nd-order and 1st-order forcings?
CO2 is a non-player in climate change because there is so little of it and there have been hundreds of climate changes without any possible effect from CO2. Willis is correct. I see no evidence that CO2 can be responsible for more than 0.1 increase in temp.
If AGW (which I accept) is a major cause of global warming, then why are there no credible, replicable measurements quantifying AGW? Science is all about data; measurements are data. But so far, there appear to be no widely-accepted measurements of AGW! (Or any, that I am aware of.)
It doesn’t work!
The first person who produces verifiable measurements quantifying the fraction of AGW will surely be on the short list for a Nobel Prize, no? So the carrot is there. Thousands of scientists have been searching for decades to be the one(s) who are able to accurately quantify AGW. But still, there are no measurements!
If that is correct (please tell me if it’s wrong, I can take it), then pretty much everything claimed about ‘dangerous man-made global warming’ is just an opinion, no? And it follows that opinions are not a sufficient reason to deconstruct Western technological society by reducing atmospheric CO2, which mounting evidence shows is both harmless, and beneficial to the biosphere.
Thanks in advance for any response you’re willing to give to this interested reader (and skeptic of the DAGW conjecture). This is one of the really great benefits of WUWT: being able to ask true experts in the field questions like these
The Younger Dryas (YD) and multiple other abrupt, late Pleistocene climate changes are neither fictitious nor locally restricted. A vast amount of data from all over the world indicates that most were world-wide and globally synchronous. The GISP2 Greenland ice core is truly remarkable because it shows detailed fluctuations of temperature that can be almost exactly correlated with the global glacial record and other climate proxies. The magnitude of temperature changes during the late Pleistocene varies with latitude (more pronounced at higher latitudes). In addition to the YD, multiple, similar, but less robust, abrupt climate changes occurred between 15,000 and 10,000 years ago, including about half a dozen climatic intervals, previously identified and named from other proxies, including the global glacial record. The correlation with the GISP2 core is excellent, confirming the validity of the oxygen isotope record. The late Pleistocene temperature record does not rely on a single proxy from a single location.
About 14,500 years ago, the global climate warmed abruptly (~20 F in less than a century in Greenland), bringing about drastic melting of the late Pleistocene ice sheets. Temperatures fluctuated up and down many times during the deglaciation process, rising to near-Holocene levels about 13,000 years ago before plunging back to full glacial conditions at the beginning of the YD. “Full glacial conditions” here means that temperatures rose from the level of the latest full glacial at 13,000 years ago (not necessarily the coldest part of the full glacial). Thus, the YD represents a return to the same level as the full late glacial. However, this doesn’t mean that the huge ice sheets returned to their former size—they clearly did not, primarily because of lack of time—the YD lasted about 1000 years and although the ice sheets and alpine glaciers readvanced, they didn’t have time to return to their full size.
The abrupt end of the late Pleistocene, as well as older glaciations, and the YD could not have been caused by orbital variation (Milankovitch cycles) because those take thousands of years. Milankovitch cycles cannot possibly get the planet out of the last glacial period in such a short time—it had to be some other cause capable of producing abrupt drastic warming.
Don, nobody said that YD was fictitious or locally restricted. You are raising a straw man argument.
But YD did not mean a return to full glacial conditions. You are suffering from a δ18O Greenland-centric point of view.
“Sea surface temperatures derived from Mg/Ca ratios in planktic foraminifera G. ruber and δ18O over the last 30 ka show that deglaciation warming was initiated around 19 ka in the northern Indian Ocean, which is coeval with the Pacific and Antarctica deglaciation timing, but leading Atlantic and Greenland deglaciation. Northern Indian Ocean SST documents a gradual warming during glacial to Holocene transition rather than a two step rapid warming as in the Greenland and north Atlantic.”
A New Evidence on Sequence of Deglacial Warming in the Tropical Indian Ocean.
From minimum insolation at 21 Kyr to start of deglaciation at 19 Kyr to interglacial at 11 Kyr. That is 8000 years for deglaciation.
Previous termination (TII) did not have a YD event, yet levels of CH4 and CO2 are fully comparable to last deglaciation (TI).
Independent variations of CH4 emissions and isotopic composition over the past 160,000 years.
http://i1039.photobucket.com/albums/a475/Knownuthing/ngeo1922-f2_zpsreqa2o0w.jpg
Figure text: a, CO2 from Vostok (TII, brown) and EDC (TI, orange). b, δ13CH4 from Vostok (TII, light blue), EDML (TI, purple, reprocessed and corrected for Kr effect) and GISP2 (TI, dark blue, original timescale, corrected for Kr effect), all with inverted y axis. c, CH4 from EDC (TII, light green) and EDML (TI, dark green). Except for GISP2 δ13CH4, all records are given on the unified ice-core chronology46. Upper x axis refers to TI (0–25 kyr BP), lower x axis to TII (118–143 kyr BP), aligned at the major CH4 rises (grey dotted line).
Sea levels. The analysis of cores from Tahiti coral reefs found that sea level rose at a rate of about 7.5 ± 1.1 mm/yr during the Younger Dryas. Just after the end of the Younger Dryas, the rate of sea level rise accelerated to 17.4 ± 0.4 mm/yr and just before its start, it was 12.1 ± 0.6 mm/yr. This reduction in the rate of sea level rise directly reflected a substantial reduction of the global inflow of meltwater into the world’s oceans during the Younger Dryas.
Deglacial Meltwater Pulse 1B and Younger Dryas Sea Levels Revisited with Boreholes in Tahiti.
http://i1039.photobucket.com/albums/a475/Knownuthing/TahitiSeaLevel_zpslymsvugl.png
Increase in sea levels during YD is incompatible with “a return to full glacial conditions”.
Sincerely, you only have your opinion and δ18O isotope from Greenland ice cores. Not even Nitrogen isotopes from Greenland ice cores support your view that YD was a return to full glacial conditions.
YD was an abrupt 1200 years cooling period within a long 8000 years warming that took the planet out of the Pleistocene and into the Holocene. During that cooling period most of the planet continued warming albeit more slowly, as the sea level change demonstrates.
Don E. says “… Milankovitch cycles cannot possibly get the planet out of the last glacial period in such a short time—it had to be some other cause capable of producing abrupt drastic warming.”
———————–
The most fundamental tenet of the entire global warming mess hinged on the idea that since no other cause for last century’s warming was known, or could be guessed, then clearly, it had to be our fault. Applying that logic, it becomes clear that we ended the Pleistocene, as well. How deep, the well of our guilt.
🙂
Javier,
Interesting discussion. 🙂
This is what you said in an earlier post. “This is the problem of relying on a single proxy from a single location. The return to full glacial is fictitious.”
Please read my earlier post—you have totally ignored everything I said. I am far from relying on a single proxy from a single location. You seem to be unaware of all the other evidence and proxies that I refer to. The δ18O data is supported by ice core temperature data of Cuffy and Clow and by Alley. Both show a return to the same last, late-glacial temperature level of 13 ka.
The data you posted is very interesting, but let’s not quibble about how cold the YD was—that’s not the principle issue here. Nothing you have said so far addresses the real problem—orbital changes cannot explain (1) the sudden termination of the late Pleistocene, (2) synchronous climate changes in both hemisipheres, (3) the many Dansgaard/Oerscher abrupt climate changes. The orbital changes take thousands of years to be felt and cannot possibly have caused these. Until you can explain these facts, you have no argument. So far, you have only stated your opinion that it is due to precession, but have not yet addressed the real problem of with any concrete evidence.
Another time, it would be interesting to discuss the other data you posted.
Don
Don,
“Nothing you have said so far addresses the real problem—orbital changes cannot explain (1) the sudden termination of the late Pleistocene, (2) synchronous climate changes in both hemisipheres, (3) the many Dansgaard/Oerscher abrupt climate changes.”
Again, you seem to be focusing on only one termination. During the Pleistocene there had been 20 glaciations with 20 terminations. Milankovitch theory has been the only theory that has provided an explanation for the timing of glaciations. It was proposed before there was proof of the timing, and this timing fits in general terms Milankovitch cycles.
(1) Sudden terminations pose no problem at all for the theory. Once the process of warming the world keeps going, we know of several feedback processes that are likely to accelerate it giving the impression of an abrupt warming. Also other abrupt warming oscillations are know (D-O events) that could contribute to the abruptness of the termination.
(2) Obliquity changes are synchronous over both polar regions. Obliquity is so important for glacial termination, that of the 20 terminations, 12 of them have the same periodicity as the obliquity cycle.
(3) Why would Milankovitch cycles have to explain D-O oscillations? There is no indication that D-O oscillations are caused by orbital changes. There is evidence that they are linked to sea levels, so they probably have an oceanic origin.
Javier wrote:
What a disappointing article… Recently it has been proposed by Marcott et al., 2013 that the entire Holocene global average temperature span is 0.7°C. That is between HCO and LIA there is only a 0.7°C reduction in global temperature.
That is a typical alarmist assumption, and according to past articles posted here, Marcott isn’t very credible (just put ‘Marcott’ in the search box to get the articles and comments). Here is Marcott’s alarming view of the current (extremely *mild*) warming. Note the scary red in the chart:
http://www.realclimate.org/images//Marcott.png
Over the past century and a half, global warming was only ≈0.7ºC – ≈0.8ºC. Compared with the geologic record, that is nothing. Temperatures fluctuated by TENS of whole degrees just prior to our current Holocene — and before there were any indiustrial CO2 emissions. Marcott is just trying to alarm the public with his very scary — and very bogus — graph.
Javier keeps digging:
…between HCO and LIA there is only a 0.7°C reduction in global temperature. This immediately places current global average temperatures, as warmer than HCO, and 2015 has a chance of being the warmest year in the Holocene.
That amounts to an assertion, contradicted by plenty of evidence such as this:
Javier digs deeper:
There are no other global temperature reconstructions for the entire Holocene
for example:
http://i.snag.gy/BztF1.jpg
[click in charts to embiggen]
I can count at least twenty temperature increases during the Holocene that were just as great or greater than the current rise.
Next, Javier says “the entire Holocene”, but he never identifies which temperatures he is talking about. Is it polar temps, which vary by several degrees? If so, his statement is contradicted by ice core, oxygen isotope and other observations.
Or maybe Javier is referring to equatorial temps, which have varied less than 1ºC over the past billion years. But then his assumption makes no sense. So Javier is really just making assertions — which all happen to support his narrative. Funny how that works.
Real world evidence shows that the ≈0.7ºC wiggle in global temperatures over more than a century is a flatter temperature record than anything found in the geologic record. In fact, humanity and the biosphere have been extremely fortunate in this “Goldilocks” climate:
http://i1.wp.com/www.powerlineblog.com/ed-assets/2015/10/Global-2-copy.jpg
Despite the very mild global temperatures we have been enjoying, the climate alarmist crowd is still trying to convince the public that what we are observing is a climate catastrophe happening.
But that narrative is unsupported by any credible evidence. Only big money is keeping that scare alive. Really, it is just a hoax to pass carbon taxes, and give government bureaucrats more power over the average person’s life. The military has the perfect acronym: BOHICA.
(Note: “Buster Brown” is the latest fake screen name for ‘David Socrates’, ‘Brian G Valentine’, ‘Joel D. Jackson’, ‘beckleybud’, ‘Edward Richardson’, ‘H Grouse’, and about twenty others. The same person is also an identity thief who has stolen legitimate commenters’ names. Therefore, all the time and effort he spent on posting 300 comments under the fake “BusterBrown” name is wasted, because I am deleting them wholesale. ~mod.)
Buster,
“..science isn’t done on blogs, it’s done in journals.”
You are talking gibberish, to me, for science is not done on/in either blogs or journals, it’s just reported/discussed on/in such things.
Your “authority worship” is hampering logical thinking, it seems to me.
JohnKnight says:
You are talking gibberish
Hey, John, you’re talking about my entorage of one: my pet chihuahua Bungler Bluster, who constantly bird-dogs my comments with his illogical nonsense. That one is just another example: rather than reading even one Marcott article, Bluster pontificates as if he knows something. He doesn’t; he’s been wrong every time he comments.
I give Bluster his reason for existing, John. I’m his rai·son d’ê·tre. If you take that away from him, he’ll go back to pushing a shopping cart. Would you want that on your conscience? …yeah, I don’t care, either. ☺
Every once in a while another Blusterboi like that shows up here to exhibit his total lack of knowledge about the science being discussed. All he does is assert his wrong-headed opinion, while I post lots of facts and evidence. But what good did that do? None at all; he’s still just as ignorant as the day he first posted a comment here.
So disregard Bluster, he’s just a chihuahua trying to run with the big dogs. He is impervious to learning anything, all he does is bird-dog skeptics’ comments. Treat him like what he is: an amusing example of an alarmist lemming, a mouth-breather who head-nods along with everything he hears on the nightly news about ‘climate change’. Worse, he really believes it!
(Note: “Buster Brown” is the latest fake screen name for ‘David Socrates’, ‘Brian G Valentine’, ‘Joel D. Jackson’, ‘beckleybud’, ‘Edward Richardson’, ‘H Grouse’, and about twenty others. The same person is also an identity thief who has stolen legitimate commenters’ names. Therefore, all the time and effort he spent on posting 300 comments under the fake “BusterBrown” name is wasted, because I am deleting them wholesale. ~mod.)
(Note: “Buster Brown” is the latest fake screen name for ‘David Socrates’, ‘Brian G Valentine’, ‘Joel D. Jackson’, ‘beckleybud’, ‘Edward Richardson’, ‘H Grouse’, and about twenty others. The same person is also an identity thief who has stolen legitimate commenters’ names. Therefore, all the time and effort he spent on posting 300 comments under the fake “BusterBrown” name is wasted, because I am deleting them wholesale. ~mod.)
Bluster says:
Dbstealey, someone needs to go after all the errors you make.
I make plenty of errors, just like everyone else. But discussing the man-made global warming scare, you are 100% errors. You’re batting .000; you haven’t got a single hit yet. You don’t have a clue why the real world is contradicting your beliefs.
Don’t just take my word for it. Looking at other readers’ comments, you’re not even in the minor leagues. A batboy, maybe. Nothing more.
“JohnKnight, You can discuss politics on blogs, but “politics” is done in the voting booth. Get the analogy?”
BusterBrown,
You can discuss politics on journals, but “politics” is done in the voting booth. Get the problem with your “analogy”.?
(Note: “Buster Brown” is the latest fake screen name for ‘David Socrates’, ‘Brian G Valentine’, ‘Joel D. Jackson’, ‘beckleybud’, ‘Edward Richardson’, ‘H Grouse’, and about twenty others. The same person is also an identity thief who has stolen legitimate commenters’ names. Therefore, all the time and effort he spent on his comments is wasted, because I am deleting them wholesale. ~mod.)
JohnKnight,
See? I told you! Bluster lives for my comments (maybe yours now, too). He doesn’t have a life with any meaning, so he ended up here somehow, a little chihuahua trying to run with the big dogs.
I just love it when Bluster the Chihuahua bird-dogs my comments. He doesn’t try to discuss science because it’s way over his head. So he makes comments like those above.
And who else has their own one-chihuahua entourage?
(Note: “Buster Brown” is the latest fake screen name for ‘David Socrates’, ‘Brian G Valentine’, ‘Joel D. Jackson’, ‘beckleybud’, ‘Edward Richardson’, ‘H Grouse’, and about twenty others. The same person is also an identity thief who has stolen legitimate commenters’ names. Therefore, all the time and effort he spent on his comments is wasted, because I am deleting them wholesale. ~mod.)
I love it when you bird-dog me.
Got anything original, chihuahua? Or do I have to feed you all your ‘clever’ comments?
I’ve been pointing out that you’re “bird-dogging” my comments for at least the past week, and I’ve mentioned ‘bird-dogging my comments’ at least half a dozen times now. So now you’re copying my posts. Emulating me is all you’ve got, but I don’t mind. I like having an entourage, even if it’s just a single chihuahua.
I laugh at your copycat posts, but I’d prefer to discuss science. You’re always bird-dogging my comments, but now it’s at the point of stalking. If you would discuss facts and evidence I’d like it better. But I know why you don’t: it’s because you’ve got nothin’.
So get a life, chihuahua. You’re a noobie here. and you’re clearly not up to speed on these subjects. All you do is emit your baseless opinions while skeptical readers post data, and empirical observations, and repeatedly ask for (non-existent) measurements of AGW. And we thoroughly demolish your climate alarmism.
No wonder alarmist scientists have given up debating skeptics. They always lose those debates. So now they sic their chihuahuas on skeptics, hoping to spread the globaloney they’re too scared to debate themselves.
Won’t work, chihuahua. Bluster is still bluster, and facts, observations, and evidence still rule. The alarmist crowd still has zero credible evidence to support their ‘carbon’ scare. If it weren’t for the piles of grant money and a complicit media, the “man-made climate change” narrative would be the #1 topic for stand-up comedians on the late nite shows. It’s getting there anyway…
dbstealey,
Too bad you have not provided a single evidence of past global average temperatures. A single ice-core in Central Greenland does not provide support for anything that is not past temperatures in Central Greenland. Why do you think that Central Greenland climate can represent the entire planet is beyond me.
You keep repeating the same mistakes even after told, so it is not very productive to engage you in discussions about science. Your inability to learn is tiresome.
Javier,
Since you brought it up, what is the GAST?
As I’ve tried to teach you, that doesn’t matter. Only the trend matters.
I even helpfully posted quite a few charts so you could learn something. No dice. Dr. Easterbrook tried to help you out, too. But again, no dice. He tried to explain so even you could understand, that ice cores are excellent proxies for global temperature trends. Trends, Javier. Get it? Trends. They are what’s important, not GAST.
Your inability to learn is tiresome.
Dbstealey asks: (Note: “Buster Brown” is the latest fake screen name for ‘David Socrates’, ‘Brian G Valentine’, ‘Joel D. Jackson’, ‘beckleybud’, ‘Edward Richardson’, ‘H Grouse’, and about twenty others. The same person is also an identity thief who has stolen legitimate commenters’ names. Therefore, all the time and effort he spent on his comments is wasted, because I am deleting them wholesale. ~mod.)
Bluster Bozo says:
…why do you ask what GAST is when you post a chart of GAST?
Some day I may do you a favor, chihuahua, and explain what a ‘rhetorical question’ is. You presumed two things in your usual deflection here:
First, you presumed that I don’t understand what is meant by GAST (or GASTA). And you presume that you understand the issues being discussed here. Wrong on both counts.
As you just attacked someone else on another thread here, with your usual psychological projection:
Take the issue up with him, not me
Which I was doing with Javier. I would school you, but I’ve tried, and you’ve shown you have no ability to understand the basic issues being discussed. You did the same thing again here, in your incessant bird-dogging of my comments.
Javier and I have had these discussions since long before you stumbled on the scene with your usual deflection, misinformation, and in particular as we see here, with your abysmal lack of reading comprehension. I was doing Javier a favor, since he is convinced that orbital mechanics… oh, heck, why waste pixels explaining science to someone who believes that man-made CO2 is the cause of everything bad and nothing good? You’ve repeatedly shown that you ignore links, that you’re bird-dogging my comments in a very queer way, hoping to get a leg up which in your case will never happen, and that your mind is made up and closed tight. Like every other climate alarmist, your conviction comes from your belief (or money in the case of real alarmist scientists, and power for bureaucrats; unlike the average alarmist lemming, they know better, but they’re lying for a cause). But your belief comes from your eco-religion, not from science, or logic, or ratioinal deductions, or observations, or any real understanding of either human nature or how big money affects the eco-propaganda that is leading you by an invisible ring through your nose. You’re head-nodding about things you don’t even understand. That’s what they like.
Since you mistakenly believe that GAST is the issue here (it isn’t and it never was), here’s something more to get you pointlessly spun up:
http://4.bp.blogspot.com/-lPGChYUUeuc/VLhzJqwRhtI/AAAAAAAAAS4/ehDtihKNKIw/s1600/GISTemp%2BKelvin%2B01.png
You’re not just arguing with me and getting thrashed, puppy, you’re arguing with lots of skeptics here on lorts of threads, often with these stupid ‘gotcha!’ attempts. You can see they don’t work. If you had read what I wrote about the trend being the only relevant metric, you wouldn’t have stepped in it as usual. But that would mean you were starting to actually read comments and understand the discussion, instead of your hopelessly lame attempts at one-upmanship.
Scientific skeptics — the overwhelming majority of readers and commenters here — have no trouble repeatedly demolishing your alarmist nonsense, and the reason is easy to see: we follow evidence, observations, data, measurements, and logic, while you waste your energy on lame ‘gotcha!’ attempts that backfire. But I must say, it does my ego good to see you saving up my past comments to re-post. You’re so fixated on me you probably don’t even realize it. Or scarier yet — you know exactly why. Maybe instead of an entourage I have a stalker.
No wonder no alarmist scientists will debate skeptics any more. Even though they’re much more up to speed than you will ever be, they still lack the one vital requirement necessary to win a debate: they lack the truth. Just like you.
(Note: “Buster Brown” is the latest fake screen name for ‘David Socrates’, ‘Brian G Valentine’, ‘Joel D. Jackson’, ‘beckleybud’, ‘Edward Richardson’, ‘H Grouse’, and about twenty others. The same person is also an identity thief who has stolen legitimate commenters’ names. Therefore, all the time and effort he spent on his comments is wasted, because I am deleting them wholesale. ~mod.)
dbstealey,
What trend? Decadal? Centennial? Millennial? After choosing what trend matters you still have to demonstrate that “the trend that matters” is the same between Central Greenland and the rest of the world. After all precession changes are antisymmetric in both hemispheres so it is very difficult to argue that a polar trend is going to be identical to a global trend. I would right away dismiss it on theoretical grounds alone unless confronted with pretty strong evidence that what you say is true.
I think you are just wiggling around to avoid having to recognize that you have built a global argument out of a single regional proxy. I call that BS.
Javier,
If you will stop wiggling for a minute, I’ll explain it for you:
You want a global average temperature. But that isn’t important. It’s the temperature trend that matters. Is the trend rising? Falling? Flat?
We can discuss the time frame, but I’ll be happy to defer to someone on your side of the fence: Dr. Phil Jones. His time frame is 15 years. Go back 15 years from now and tell us the trend. Or even 18 years.
But you don’t like that, because it doesn’t show what you want it to: rising global T. Instead, you fumble around trying to corner me with time frames like “centennial”, etc. You’ve demonstrated that you’re not smart enough to do that.
Next, you wrote:
Too bad you have not provided a single evidence of past global average temperatures.
That’s your baby, Javier, not mine. I’m not interested in what the GAST is because it tells us nothing worthwhile here. The trend is what matters, and Dr. Jones’ 15 year time frame is fine with me. Dispute it if you know more than Jones does.
dbstealey,
Your definition of trend (15 years) is impractical and useless to analyze the Holocene. You still have to demonstrate that global temperature trends during the Holocene have anything to do with Central Greenland temperature trends as I asked you to do. Otherwise your claim that GISP2 represents global temperature trends is unsupported by evidence and can be dismissed without evidence as per Hitchen’s razor.
Javier,
I give up. Why try to help you understand when you won’t understand? It’s not my definition. I’ve repeatedly explained that the 15 year time frame was proposed by Dr. Phil Jones, not by me.
Go complain to Dr. Jones if you’re so unhappy about it. He’s another arch-alarmist, so you two should get along just fine.
As for ice core evidence, you’re pretty much alone on that. Ice cores are very good proxies for global temperature trends. Otherwise, why do so many scientists use them for exactly that?
dbstealey,
Please provide references where an ice core is used as a proxy for global temperatures
Javier,
I’ve done that repeatedly, at times in response to your own comments. So what good would it do? You would just argue pointlessly because your mind is already made up.
Because those scientific references do not exist. You are just making that up, and when challenged to provide evidence, you have been caught.
Thank you for addressing that. I run into that chart all over the place. The Warmings use it like the end all be all. I always just go back to the data set. That chart however does demonstrate just how political and corrupt that “science” it. They just make stuff up to support their case. People have to understand that if they win the world will never been the same. The socialists will now have the money to impose their will on whom ever they want. Up until now Socialism was self limiting because of its inability to self sustain itself. If we allow them to loot the energy sector, a sector with a produce with inelastic demand, they will be able to do a lot of damage, and be well funded.
Something isn’t passing the stink test with these climate charts. These charts show extreme volatility in temperature, yet CO2 didn’t respond. The theory is that the tilting of the earth led to a warmer ocean and more CO2. I buy that. Why then did the continued warming not result in more atmospheric CO2? Why did all that warming only result in CO2 going from 180 to 280 over 8,000 years? Something isn’t passing the stink test these temperature of CO2 charts. Henry’s Law either exists or it doesn’t, the warming of the oceans either released CO2 or not, and nothing turned off the warming, but the outgassing of CO2 did stop? That makes no sense. Something isn’t passing the stink test.
Those charts show extreme volatility in temperatures because they are not for the world. Those charts are for Central Greenland only. At high latitudes temperature changes are a lot more extreme. You are very mistaken if you think you can extrapolate those changes to the entire world.
Greenland is surrounded by Ocean. You have to assume that those swings in temperature are likely to be driven by the surrounding ocean. That implies the source of all the CO2 is changing in temperature. BTW, look at this chart. CO2 and temperature rapidly increased up to 12,000 years ago and then abruptly stopped increasing. What caused the increase? How did CO2 stop the warming? How did CO2 stop increasing? If CO2 is the main driver, what is turning it on and off? How is this a settled science?
http://i1039.photobucket.com/albums/a475/Knownuthing/ngeo1922-f2_zpsreqa2o0w.jpg
co2islife,
You have a faulty logic all over the place. The ocean never gets below -4°C. Central Greenland can easily get to -30°C average!
Javier says:
Those charts show extreme volatility in temperatures because they are not for the world… You are very mistaken if you think you can extrapolate those changes to the entire world.
Javier, if you’re claiming to be knowledgeable in this area you certainly appear to be deficient in your understanding. I’ve posted charts showing the same long term temperature changes occurring simultaneously in the Arctic (Greenland) and the Antarctic. Those changes corroborate each other over long time periods. They are accepted by geologists as a proxy for global T changes.
But apparently you believe they must be coincidental, because you keep insisting that the simultaneous rise and fall of temperature at both hemispheres is just happenstance and cannot indicate long term global changes. That belief isn’t rational.
C’mon, Javier, admit it: you’re just winging it. You really don’t know what you’re talking about, do you?
dbstealey,
That is pure, unadultered, bullshit. Arctic and Antarctic ice core records show very disparate changes. You have to be blind to claim that they corroborate each other. Your ignorance of climate is epical. You don’t even know that precessional changes in insolation are anti-symmetrical and therefore it is impossible that temperature changes in both poles show a similar trend over long time periods. Please let those who know discuss about climate and go back to study.
http://i1039.photobucket.com/albums/a475/Knownuthing/climate-reconstructions-11000-years1_zpsyqq8pbaq.gif
http://i1039.photobucket.com/albums/a475/Knownuthing/Bond-events2_zpshw6xtiry.png
No, not really.
The precessional “tilt” changes that affect one end of the globe affect the other end just as far.
What IS different is that the “summer ice” that may remain from one winter to the next in the north land masses cannot exist from one summer to the next in the southern seas surrounding Antarctica. BUT! That southern sea ice around Antarctica IS present all year round between 57-58 south and 60-66 south latitudes. Thus, over a year’s basis, every square kilometer of Antarctic sea and land edge ice is 1.65 to 1.75 MORE “energy effective” than the same area of Arctic sea ice.
Javier says:
That is pure, unadultered, bullshit.
So now you’re reduced to making impotent assertions like that, because you never could refute the charts I posted showing that the Arctic and Antarctic warm and cool simultaneously. If you ever admitted that, your entire argument would be demolished.
It probably flew right over your head like most of the evidence I post, but I’m trying to get you to say, “Post those charts again!”
But you never say that because you probably suspect that I’d put in a qualifier: if I post charts showing that the Arctic and Antarctic temperatures rise and fall together, you have to admit that you were wrong. Because you’re explicitly claiming that doesn’t happen.
Instead, you bluster with your ‘bullshit’ comment.
Javier, you are in the same position as people teaching epicycles right after Kepler showed that was false. They couldn’t admit they were wrong, and neither can you. But I can prove it. All you need to do is admit you were wrong when I re-post a chart or two.
Javier is posting anomaly charts above. Sneaky, huh? Furthermore, Javier posted the Holoccene, which is a tiny sliver of the geologic record. That’s even sneakier. But his short term cherry picking is exactly what I warned him against.
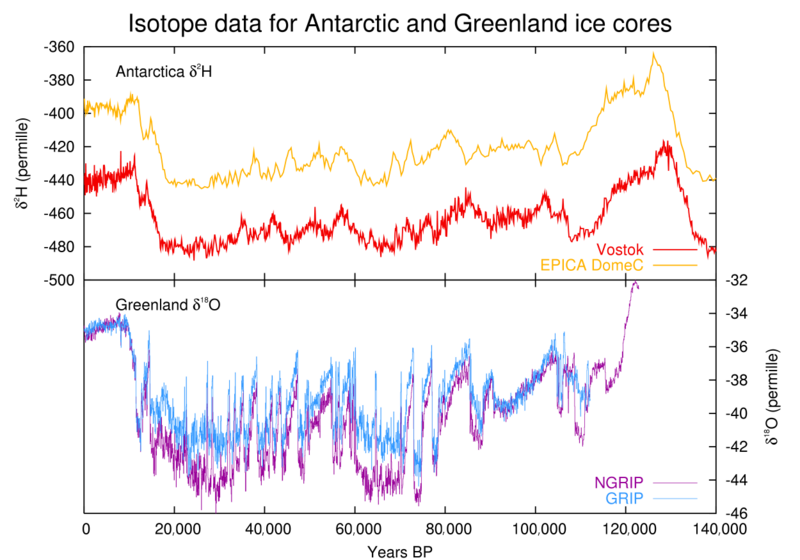
Actual long term temperature proxies look like this:
http://www.gisp2.sr.unh.edu/IMAGESGISP2/Bender-NSF.GIF
It is crystal clear that temperatures in both hemispheres are correlated. That means the ice cores are excellent proxies for global T.
Here’s another Vostok/Greenland overlay posted right here in 2011:
Note the difference: Javier posted only the Holocene. I warned him, but he didn’t listen.
Greenland vs Antarctica, 4 different proxies showing the same correlation:
And with that, Javier has been pwned.
RACookPE1978,
You seem to be confusing precession and obliquity changes. The changes in axial tilt refer to obliquity, not precession.
dbstealey,
If you put charts with a scale of 100,000 years you cannot extract conclusions that are valid when discussing changes over 10,000 years. Is like arguing about daily differences in temperature and you bringing a yearly chart. Seasonal changes are very different from daily changes, and glacial changes are very different from Holocene changes.
May I remind you that we are talking here about the Holocene? Last 10,000 years? That is what the article above is about.
Changes in the poles are not coupled. You seem to ignore everything about the bipolar see-saw. You seem to ignore that the changes in temperature during Daansgard-Oechsger events are not synchronous between Antarctica and Greenland. They only appear so because of the scale that you have chosen to hide that you have been wrong all along.
During the Holocene the temperature trends between Antarctica and Greenland have been very different as I have demonstrated with my two graphs above. Therefore you cannot claim that Greenland temperature changes during the Holocene are representative of global temperature changes.
You started this discussion by showing a 10,000 year chart of Greenland and claiming that it was a global representation. Go head, show it side by side with a 10,000 year chart of Antarctica so we can all see how global they are. They are very different unless you hide their difference behind a much bigger scale that makes the entire Holocene less than 1 cm.
Your problem is not how little you know of climate change, but that you have it all backwards and refuse to learn. You have collected some graphs but you don’t understand what they mean.
And I am still waiting for those references where an ice core is used as a proxy for global temperatures. Remember that what is claimed without evidence can be dismissed without evidence. So basically everything you say.
http://wattsupwiththat.com/2015/12/21/the-holocene-thermal-optimum/comment-page-1/#comment-2109267
Javier,
You’re grasping at straws. I originally commented on Dr. Easterbrook’s post, asking:
Re: the synchronous timing, isn’t there a difference between short term and long term events? For example, the ‘polar see-saw’ is a shorter term contra-indication of NH and SH ice cover; when one hemisphere rises or declines, the other tends to move in the opposite direction. (This sounds like a nitpick now that I’ve written it; sorry.) But on longer time scales it’s clear that the poles are in excellent agreement in their temperature trends — which indicates that they are a very good proxy for global T changes, such as the MWP and LIA.
You wrote:
You seem to ignore everything about the bipolar see-saw.
See the ‘polar see-saw’ in my earlier comment? See the ‘short term’ (Holocene) versus the long term trends? All you’re doing is arguing endlessly because you’re cornered. Nothing I wrote there is wrong. You just don’t like it.
You also wrote:
Please provide references where an ice core is used as a proxy for global temperatures
So I posted several ice core charts. They debunk your assertion that temperature trends are not global.
You also said:
I am still waiting for those references where an ice core is used as a proxy for global temperatures.
So I gave you several examples. But now you’ve moved the goal posts again, trying to limit it to the Holocene. You’re deliberately ignoring my original comment to Dr. Easterbrook. I’ve posted charts showing the same long term temperature changes occurring simultaneously in the Arctic (Greenland) and the Antarctic. Those changes corroborate each other over long time periods. They are accepted by geologists as a proxy for global T changes. That is factual; you just don’t like it because it contradicts your narrative.
You did the same thing with the Dr. Jones’ 15 year time frame to determine if global warming has stopped. You’re a slippery eel when it comes to really discussing anything, Javier. That’s because you’re not nearly as right as you believe, and you know I’ve got your number: you’re a closet alarmist. I’ve made that clear for a long time. But most of all, your mind is made up and closed tight. You respond to counter evidence with “Bullshit.”
So you can say my comments, my evidence, and my numerous corborrating links are “pure, unadultered, bullshit.” Only someone who has no rational response would post that. Projection, no doubt. And intense anger at my proving you wrong.
You’re not reading what other people write, Javier. You should try, you know. That would spare you the necessity of your endless tap-dancing and moving the goal posts.
Based on what I wrote to Dr. Easterbrook, I am correct despite your attempts to muddy the waters. You’ve done nothing to change that. You really can’t, Javier. You’re not smart enough. ☺
Keep repeating CO2 absorbs between 13µ and 18µ that is how CO2 impacts climate change. CO2 changing from 280ppm to 400ppm traps about 2.2W/M^2.
This is from the link above:
http://scholarsandrogues.com/2013/05/09/csfe-heat-capacity-air-ocean/
It is a gold mine for quote to debunk CO2 as the cause of the warming. Note, nowhere in this explanation of how the oceans impact the atmospheric temperatures has absolutely nothing to do with CO2. Nothing in this cycle has anything to do with CO2, and yet they tie it to AGW. El Nino/Ninas existed well before Man. Here are some quotes:
This shows that the heat capacity of the oceans is about 1000x larger than the heat capacity of the Earth’s atmosphere…La Nina is a massive upwelling of cold water in the Pacific that, because ocean water has a much higher heat capacity than air, cools off the entire planet and affects weather patterns. El Nino is a massive pool of hot water in the Pacific that does the opposite – it dumps heat stored in the ocean back into the atmosphere, warming the globe and affecting weather patterns. Nearly all the energy absorbed by the Pacific Ocean during La Nina periods will eventually be emitted back into the atmosphere during El Nino periods…Since total ocean heat capacity is about 1000x greater than total atmosphere, it means that a barely measurable temperature increase in the ocean (1/1000th of a degree C) could drive a massive spike in global air temperature (1 degree C)…We’ve had more La Nina cycles since 1998 than we’ve had El Nino cycles, and that means the Pacific ocean is storing more energy…The problem with this, however, is that it means that energy is going to come back OUT of the ocean again eventually. And when (not if) that happens next, the average global temperature will spike.
I posted this on that Blog, it will be interesting to see if it passes the gate keeper. I doubt they intended to debunk the CO2 driven AGW theory.
1) How could CO2 cause these patterns?
2) All previous peaks are above current temperatures
3) The low ice coverage allows for maximum solar radiation of the oceans
4) Why would CO2 ever decrease or result in cooling given the GHG effect of CO2 as the sole factor of warming?
co2islife,
That chart debunks Javier’s charts. He’s not gonna like that. ☺
Do the math, the atmosphere doesn’t contain this much heat, let alone between 13µ and 18µ. Something other than CO2 is warming the oceans, and the oceans are warming the atmosphere.
http://www.scilogs.de/wblogs/gallery/16/heat_content55-07.png
Consider this theory: Solar output increases or the earth tilts setting a new higher temperature equilibrium maximum. Before you get to that maximum you must first melt the ice, and then once the maximum is reached, stabilize temperatures. That looks to be exactly what happened, temperatures began increasing 20,000 years ago, that melted the ice, that caused sea level to increase, this slowed the increase in temperature, once all the ice had melted, the sea level stops increasing, the cooling effect of the melting ice stopped, the thermal max was reached. CO2 doesn’t need to play a role in any of that. Ocean temperatures driven by the sun explain all the temperature and CO2 changes. If CO2 was the driver, temperatures would never plateau.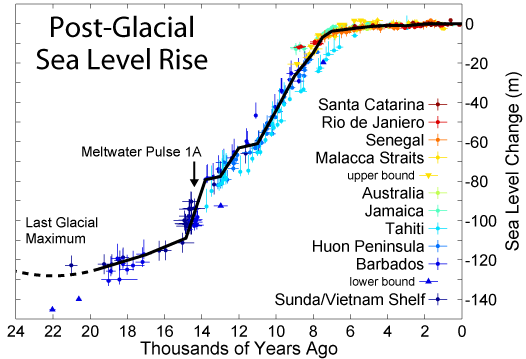
 ?w=720
@Don Easterbrook. An intriguing graph from Javier shows Holocene temperatures from the end of the YD against a curve of obliquity. They are a remarkable match. It would certainly seem that the slide into glaciation is obliquity driven. Can’t seem to paste it here. Maybe Javier will link to it.
Sure, J Martin. No problem. But I believe Don is no longer reading this.
http://i1039.photobucket.com/albums/a475/Knownuthing/Solar%20cycles2_zps1va5vqbt.png
J Martin,

This shows an even more remarkable match:
So does this:
And this:
http://www.gisp2.sr.unh.edu/IMAGESGISP2/Bender-NSF.GIF
Ice core evidence from the Arctic and the Antarctic is closely corellated. That means global T moves the same. Anyone can see in those chart overlays (and there are lots more) that global T moves up and down along with the ice core proxies.
Well, anyone but Javier. The evidence is clear to everyone else.
dbstealey,
I have already demonstrated that:
1. Over a scale of decades North and South pole temperature trends are different.
2. Over a scale of centuries North and South pole temperature trends are different. This is the range where the bipolar see-saw operates. See graph.
3. Over a scale of millennia North and South pole temperature trends are different. This is the range where the anti-simmetrical precessional cycle operates. See See graph. This is the scale that is relevant to this article that refers only to Holocene temperatures.
In a desperate attempt to disguise the exposure of your profound ignorance on paleoclimate you have taken refuge on the scale of hundreds of thousands of years where you make the trivial observation that both poles together with the rest of the planet get into and out of glaciations together.
That trivial observation that is known by 12 year old children does not support in any way your use of millennial scale regional Greenland ice-cores to support global changes, a practice that is so completely outside the realms of science that when asked to provide a scientific reference you have been unable to do so.
You can use political debating tactics as much as you want. This is about science. Science is not on your side. you do not understand science. So scientifically you lose no matter how many posts and words and time you are willing to put into this.
Javier,
That’s another fail. Now you’re re-framing the argument to limit it to the Holocene. But I was specifically replying to your request:
“Please provide references where an ice core is used as a proxy for global temperatures.”
So I did; I provided several charts, all showing conclusively that ice core evidence is an excellent proxy for global temperature trends. I made it very clear that there is a difference between long term trends and shorter trends like the Holocene.
But you didn’t like my answers, because they debunk your climate alarmism. So you moved the goal posts again, setting up another strawman and arguing with that. And I know where you’re coming from, with your appeals to ‘authorities’ like Marcott and others in that camp. FYI, Marcott has been thoroughly falsified in previous WUWT articles and comments:
http://img703.imageshack.us/img703/9075/marcottgisp.jpg
(Marcott in blue)
Next, you called it “trivial” that I proved global temperature trends are seen in ice cores. It may be trivial, but it debunks your counter claims. So when you say “Science is not on your side. you do not understand science,” that is just your own psychological projection speaking. Because if you admitted that polar temperatures are a proxy for global T, you would have to admit that the MWP and the LIA were global events. That would demolish your climate alarmism.
Javier, you’re so set in your beliefs that you can’t see reality staring you in the face. If you were as right as you claim to be, you could make accurate, repeated predictions. But as we all know, neither you nor any other climate alarmist has been able to predict anything accurately. Not one of you predicted the most significant global temperature event of the past thousand+ years: the fact that global warming stopped in the late 1990’s, and it hasn’t been seen since.
In fact, your side has been 100.0% WRONG in every alarming prediction you’ve ever made. No exceptions. So it’s no wonder that you’re getting so flustered trying to keep up with the facts and evidence I post. Your response is either bluster, or to keep moving the goal posts whenever I provide a correct answer, usually by setting up a strawman and arguing with it. Just like your erroneous “peak oil” predictions, nothing you predicted has ever happened. So why should anyone accept your alternate version of reality? Even your arguments with Ferdinand Engelbeen were wrong.
Now you can tell us why epicycles are the real explanation for the motion of planets, and why Kepler was all wrong. ☺
dbstealey,
Now you are smearing the discussion. A clear sign that even yourself think that you cannot win it on scientific grounds.
You said:
Now provide scientific references where an ice core is used as a proxy for global temperatures. If so many scientists use them exactly for that it should not be that hard.
The rest of your opinions about me, you can put them up where the sun never shines.
Javier,
If it wasn’t for your psychological projection (“smearing the discussion”) you wouldn’t have much to say. Or do you conveniently forget about your comments like “pure, unadultered, bullshit”, and “you can put them up where the sun never shines”? I don’t say things like that about you. I just hold your feet to the fire, and you don’t like it.
You’ve lost the argument here, Javier. I’ve already provided several scientific references showing the correlation between the hemispheres. When both hemispheres have the same rising or declining temperature trends, they are an excellent proxy for global T. I’ll post them again if you like. But I suspect you don’t want that, because they debunk your argument.
I suppose you will try to come up with more fancy footwork again, tap-dancing around the facts and evidence I’ve produced. It doesn’t matter, because I am right: on longer time scales the polar temperature trends are an excellent proxy for global temperature trends. I’ve never said anything different, and the fact that you’re going ballistic indicates that you know you’ve lost the argument.
I’ll wait here, just in case you want me to re-post those scientific references. ☺
BTW, I have an interesting debate going on over at the Scholars and Rogues article linked in the main article. I know I’ve got them stumped when they refuse to post my comment. You can tell these climate alarmists have never actually debated this issue, and have only existed in a little group think bubble where everyone reinforces their misguided beliefs.
http://scholarsandrogues.com/2013/05/09/csfe-heat-capacity-air-ocean/#comment-266174
BTW my one comment on Scholars and Rogues got a “ping back” to the link below. This article was posted elsewhere.
http://andymaypetrophysicist.com/2015/12/20/holocene-thermal-optimum/