Bipolar disorder continues, Arctic reaches lowest maximum extent while the Antarctic sets new records

Time to take a quick look at the sea ice situation down under, as I must have missed it on BBC News. According to NSIDC, a new record high has been set for April, beating last year. Ice is above average virtually all around the continent. Meanwhile, according to Bob Tisdale, Southern Ocean surface temperatures continue to plunge. It really does not take a genius to add two and two together. –Paul Homewood, Not A Lot Of People Know That, 3 May 2015
From the WUWT Sea Ice Page: http://wattsupwiththat.com/reference-pages/sea-ice-page/

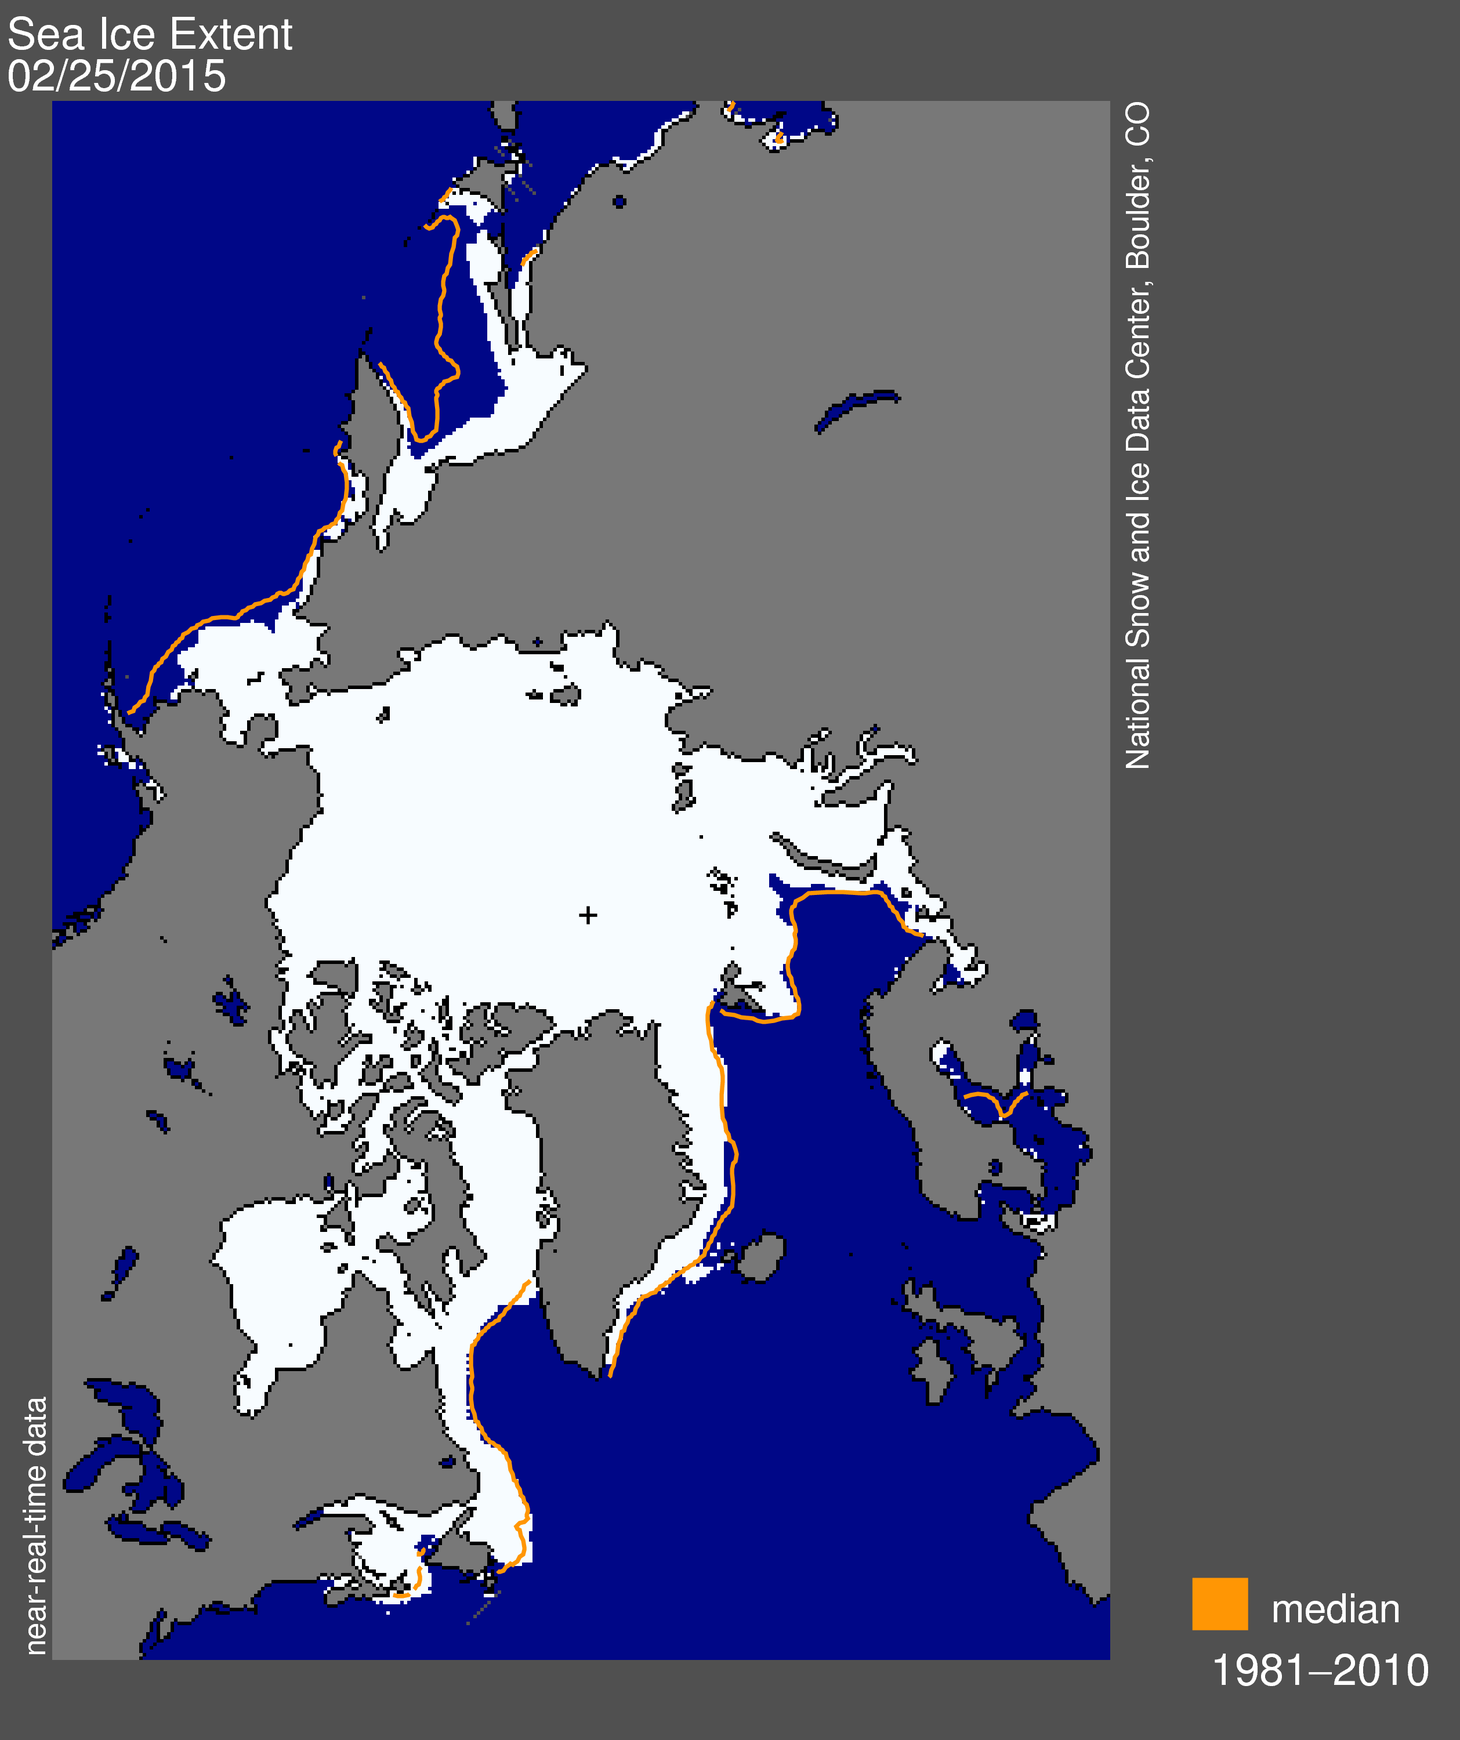
Arctic sea ice maximum reaches lowest extent on record

The National Snow and Ice Data Center (NSIDC) is part of the Cooperative Institute for Research in Environmental Sciences at the University of Colorado Boulder. NSIDC scientists provide Arctic Sea Ice News & Analysis content, with partial support from NASA.
NSIDC has issued an update to Arctic Sea Ice News & Analysis describing winter sea ice conditions in the Arctic Ocean.
Arctic sea ice appears to have reached its maximum extent for the year on February 25 at 14.54 million square kilometers (5.61 million square miles). This year’s maximum ice extent is the lowest in the satellite record.
NSIDC will release a full analysis of the winter season in early April, once monthly data are available for March.
To read the current analysis from NSIDC scientists, see http://nsidc.org/arcticseaicenews.

Satellite Products
The ice surface temperature strongly affects heat exchange between the surface and the atmosphere and the rate of ice growth. In order to perform proper forecasting of weather and sea-ice conditions, it is essential to obtain accurate surface temperatures.
A sparsely distributed observational network, consisting of drifting buoys, cannot resolve the surface temperature variations in the Arctic sufficiently but satellite observations can fill in the gaps of the traditional observational network.
The DMI ice temperature product (IST) uses three thermal infrared channels from the Advanced Very High Resolution Radiometer (AVHRR) on board the Metop-A satellite to calculate the surface temperatures in the Arctic.
http://ocean.dmi.dk/arctic/ice_temp/plots/icetemp.arc.d-00.png
I am just going outside and may be some time
It grows seismic activity in Antarctica.
http://ocean.dmi.dk/arctic/climatology_v2/img/ymon/sh_JAM__ymontrend_08.jpg
There appears to be a natural bipolar seesaw in operation.
‘The minimum over the pre-industrial period occurred during the years AD 1250 – 1500. The sea-surface temperature in the Southern Ocean lags the conditions in the Northern Hemisphere, where the simulated temperatures reach a maximum in the model during the 11 and 12th centuries.
‘Such a lag is due to the long memory of the ocean associated with the storage and transport of temperature anomalies at great depth. Between AD 1250 and 1500 the simulated Antarctic ice area was similar to that at the end of the 20th century.’
Goosse and Renssen 2004
We are talking about on 1 in 14 variation from average max to this low max when annual swing from max to min is 7 or 8 parts in 14. Not sure why this should have any effect on much of anything.
my comment is wrt Aectic
Warm cuddly model, meet cold hard reality.
http://www.gifbin.com/bin/102012/1350490360_guy_jumps_cannon_ball_into_frozen_pond.gif
I do love how he blazed a path to new understanding … via buttock and spinal column’s compaction … you don’t see that sort of thing very much these days … reminds me of the movie, “The Right Stuff”, the part where the German engineer subtly suggests a chimpanzee might be a more prudent occupant for the ‘capsule’.
Breaking your tail bone is one of the least best forms of entertainment.
In other news, here’s my “Oh, but…” trollish person imitation:
Oh, but Antarctica is losing ice mass.
In retrospect, I do sincerely apologize. It’s painful to even watch.
I got 5 stiches in my chin playing hockey at the local rink, without being a fool.
So, I got no pity for amateurs 🙂
Does anybody recall the concept of “average?” The black line is the average of 1981 to 2010 trends w/ +/- 2 stand dev band. That means that half of the 29 year lines were above and half below. Plot all of the annual trends and see where 2015 fits in. Just lost among the 15 other lines in the SD band.
What’s the hub-bub, bub?
It doesn’t mean half were above and half below the average. That would be the median rather than the mean (average).
You could say approximately half.
Antarctic surface temperature measurements are worthless, because they are contaminated by a combination of the only Urban Heat Islands on the continent, and albedo melting of snow and ice from the particulate pollution from the diesel generators all the stations use, exposing bare rock at many of the stations and darkening the snow/ice at all of them. Thus absorbing more solar energy around the stations.
Concerning the loss of sea ice in the Sea of Okhotsk. This area is downwind from Siberia where there have been extensive forest fires this spring, with reports of the haze from these fires reaching as far as several US cities.
Deposition of this particulate haze/smoke on the ice will have caused accelerated spring melt in the Sea of Okhotsk, which is the most southerly Arctic sea ice, and thus most susceptible to melt from albedo changes.
Particulate pollution occurs across much of the Arctic, whereas it is almost completely absent from Antartica (except very locally to the Antarctic Stations as noted above). Which makes changes in Antarctic sea ice climatically far more more significant.
In “Climate Science” it really does take a genius to add two and two together. Is the answer 4, or 4.000, and do they know the difference? They probably do but know that low-information types do not, and this is endlessly exploited…
Ice that is frozen onto a Continent is nothing like ice that is free-floating on an Ocean. Ice attached to a continent can resist the Wind, whereas ice free-floating, with all the leads and polynyas, cannot. It’s the Wind what dunnit, another issue not understood by those poor unfortunate Low Information types.
Did I spell “polynyas” correctly?
Michael Moon
May 5, 2015 at 8:37 pm
“Did I spell “polynyas” correctly? ”
=============
It seems you did, good work.
Nothing confusing about this.
Found this today….
http://www.bbc.com/news/science-environment-32599228
One of the lines from the article….”The new core also supports the “bipolar seesaw” effect between poles, meaning that when it’s warm in Greenland, Antarctica is cooling, and vice versa”.
http://arctic.atmos.uiuc.edu/cryosphere/
It has been updated.
ARCTIC SEA ICE -.648 below normal.
ANTRACTIC SEA ICE +1.76!!!! above normal.
Once again deniers…you don’t know what you’re talking about. The increased ice is due to global warming. Sorry.
Antarctic sea ice is complex and counter-intuitive. Despite warming waters, complicated factors unique to the Antarctic region have combined to increase sea ice production. The simplistic interpretation that it’s caused by cooling is false.
[url=https://www.skepticalscience.com/increasing-Antarctic-Southern-sea-ice-intermediate.htm]Why is southern sea ice increasing?[/url]
Redtom,
Define a “denier”.
If/when you do/can, I’ll give you a better definition.
You won’t like it. But it will be far more accurate.
Redwing Tom, are you the guy that used to sell me my work boots?
(Redwing shoes are top-notch!)
I believe the same can be said for the greenhouse effect’s influence on global climate.
At least, when you look at the divergence of the models from reality…
The claim that land ice melting is causing the extra sea ice around Antarctica has been completely debunked. Guess where the only area with below average sea ice is located? Right where the land ice is experiencing geothermal melting.
@Redwingtom,
You say:
“Once again deniers…you don’t know what you’re talking about. The increased ice is due to global warming. Sorry.”
========================
So lets parse this statement, I’m sure it was as nasty as you could produce.
You say: “Once again deniers…you don’t know what you’re talking about.”
I say: You may very well be right, but was the “deniers” tag necessary ?
You say: “The increased ice is due to global warming.”
I say: How does warming lead to more ice ?
So, by calling me names you figure I’ll be more receptive to your crazy theory that “The increased ice is due to global warming.”
Can you even see how backwards your tactics are ? Not only do you insult me, you expect me to believe something that is counter-intuitive.
The data is slowly but surely proving that nobody knows what they are talking about.
You should be happy you are in the fraction of the world population that has the resources to actually debate the issue.
There seems to be “money” in the ultimate outcome.
University of Illinois’ Cryosphere today is now updating their graphs.
Based on what has happened before (paleo record when there was a reduction in solar activity) and the current trends, it appears there will soon be record total sea ice followed by record sea ice both poles.
http://arctic.atmos.uiuc.edu/cryosphere/iphone/images/iphone.anomaly.global.png
Any way you cut it the global temperature average is static.
A bit of noise, some heat island effects, some record low temps, some record high temps.
Exactly what you’d expect.
No up trending, no down trending.
No NET heating, no NET cooling.
Stable planet.
All the rest has nothing at all to do with science.
CPC forecasting positive sea ice extent anomaly for peak melt sea season in Sept 2015.
http://www.cpc.ncep.noaa.gov/products/CFSv2/imagesInd3/sieMon.gif
If that comes to pass, and Antarctic Ice stays very positive, takes the Arctic Ice melting doom off the table for 2015 Paris COP propaganda run-up.
The Antarctic is heading into its winter now, and darkness so don’t worry. The Arctic is coming into summer and longer days of sunlight. Don’t worry sea ice is always going to retreat and grow in the Arctic same as Antarctic. As the Arctic is mainly sea ice and no land near the pole, not the Arctic circle and there is nothing we can do to control this. It tires me when all these reports suggest AGW controls sea ice melting etc., when it is caused by the seasons and natural physically events. Yes the Antarctic is very seismic and has active volcanoes terrestrial and submarine. And they don’t have polar bears either.