GUEST POST by Bob Tisdale
That’s the title of a new paper by Cook et al. that’s been making the rounds in the mainstream media.
The paper is available from GISS here. The abstract reads:
In the Southwest and Central Plains of Western North America, climate change is expected to increase drought severity in the coming decades. These regions nevertheless experienced extended Medieval-era droughts that were more persistent than any historical event, providing crucial targets in the paleoclimate record for benchmarking the severity of future drought risks. We use an empirical drought reconstruction and three soil moisture metrics from 17 state-of-the-art general circulation models to show that these models project significantly drier conditions in the later half of the 21st century compared to the 20th century and earlier paleoclimatic intervals. This desiccation is consistent across most of the models and moisture balance variables, indicating a coherent and robust drying response to warming despite the diversity of models and metrics analyzed. Notably, future drought risk will likely exceed even the driest centuries of the Medieval Climate Anomaly (1100–1300 CE) in both moderate (RCP 4.5) and high (RCP 8.5) future emissions scenarios, leading to unprecedented drought conditions during the last millennium.
The paper has two strikes against it right from the get-go: paleoclimatological data and climate models.
A COUPLE OF QUICK SPOT CHECKS
The Cook et al. (2015) paper states, where PDSI stands for Palmer Drought Severity Index:
PDSI is easily calculated from GCMs using variables from the atmosphere portion of the model (for example, precipitation, temperature, and humidity) and can be compared directly to observations.
So let’s take a quick look a couple of worst-case examples of how poorly the models simulated temperature and precipitation in the regions selected by Cook et al during the satellite era, the past 35 years.
They selected a group of 17 models from the CMIP5 archives, using RCP4.5 (moderate emissions scenario) and CP8.5 (“business as usual” scenario). As a spot check, the following two model-data comparisons use the average of all of the models in the CMIP5 archive, with the historic forcings from 1979 to 2005 and the RCP8.5 scenario afterward. If you’d like to redo the following graphs with only the models used by Cook et al., you’re more than welcome to do so. And also show us the outputs of the models that Cook et al. didn’t use.
Cook et al. also identified the coordinates of the regions they included in their study:
All statistics were based on regional PDSI averages over the Central Plains (105°W–92°W, 32°N–46°N) and the Southwest (125°W–105°W, 32°N–41°N).
And their paper included the boreal summer months of June-July-August.
For the data in the following comparisons, we’re presenting GISS Land-Ocean Temperature Index data, and CAMS-OPI precipitation data, which is a merger of rain gauge and satellite-based precipitation data. The data and the climate model outputs are available from the KNMI Climate Explorer.
Again, we’re showing the worst case model-data comparisons.
For the Southwest United States region, the climate models are showing almost twice the observed June-July-August precipitation from 1979 to 2014. See Figure 1.

Figure 1
And in the Central Plains region of the United States, the models more than double the observed warming rate.

Figure 2
CLOSING
My Figure 3 is Figure 1 from Cook et al. (2015). Nice hockey stick.

Figure 3
Maybe at some time in the future, probably not in my lifetime, the climate science community will come to realize that model outputs showing “unprecedented” future values are indications the models are fatally flawed.
Discover more from Watts Up With That?
Subscribe to get the latest posts sent to your email.
Hmmmm. I wonder if the modeled precipitation output (which does indeed go up as the atmosphere is supposed to get wetter) was simply flipped and called the “drought” scenario. Something does not smell kosher here. Warmer does not default as dryer. Warmer is more often than not, wetter. So I say again, something does not seem correct here.
If you really want to see dryer, extend year round ice past the 45th parallel. But that would require a colder world. Pondering just how they got models to say “dryer”. Might someone have had a finger on the scale?
Don’t bother asking why, it’s settled science
I don’t even need to read the paper and I can see that this is the garbage output when simply imputing the IPCC temperature projections into the GCMs and looking at what that would output for a desert region. If the absolute temperature goes up in the already hot and dry desert southwest, it would be very hard (or impossible) for the models to show an increase in humidity as well because that would lead to utterly unbelievable heat indexes, even for a CAGW cultist. Since the runaway warming was forced into the models, the models have no choice but to lower the relative humidity to stay inline with reality, and voila, unprecedented drought yada yada. Make sense? If instead they were forcing projected humidity levels into the models it would probably show that hot and dry regions would have their absolute temperatures decrease.
Based on the miserable record of such predictors so far, I think we can all rest easy.
See the Southwest and Alaska.
It’s “only” circulation.
http://vortex.accuweather.com/adc2004/pub/includes/columns/alertengine/2015/590x458_02060414_feb6a.png
“Unprecedented 21st-century drought risk in the American Southwest…”
The Anasazi Indian’s Tribal Spokesperson was unavailable for comment.
😉
I will be them any amount of money that this will not take place.
CORRECTION I would bet them any amount of money this will not take place.
Yes this is a climate change paper. I recognize the words, “expected”, “could”, “might”.
Ralph, they are getting wise, they did not use, likely, presumed, probable, a chance, more or less, fifty/fifty, with a margin of error (… fill in the number > 20%) etc etc. ( i ran out for now). oh … possible, the models seem to show, seemingly …..
I am always fascinated by climate heating models that predict drought, when virtually all paleo data of past hot climates show increased precipitation due to increased evaporation. This must be based upon extreme location cherry picking.
It’s based on them forcing projected runaway warming into the models. If you force an atmospheric model to show warming of a few degrees into a region that is already 50+ degrees C in the summer then the model has no choice but to lower projected relative humidity. This is just more GIGO based on GIGO…GIGO²?
Time to replant drought resistant Prairie grass and graze Bizon that are also great at handling droughts. Same old, same old for the US though will these droughts be mega droughts of 100- 150 years.
The GCMs and adjusted “data” have produced a limpy this time. Is this the yang for Mann’s hockey stick woody, er, ying? I wonder what would happen if they fed the model the rate of change of angels dancing on the head of a pin over time.
Ice ages are dry. There is less snow and less rain both. Lots of water covered by ice so it doesn’t create rain conditions which requires moisture rising from somewhere.
Tundra are dry areas, not wet. They have surface water only due to frozen ground conditions so water doesn’t percolate into the soil.
This from Cook et al 2007: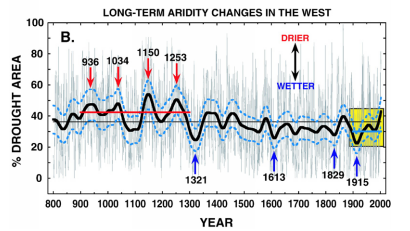
Back when he seemed to be incorporating a bit of actual data. While it is clear that generally during the MWP there were episodes of extreme drought, there were also intervals of above average rainfall. Forty years after the Anasazi left Chaco in 1130 there were two decades of near average rainfall. The grey lines are as instructive as the smoothed. This is an area of enormous variability.
Water Vapor cycles through the atmosphere each 9 days. From evaporation to rainfall, it takes an average of 9 days. Or in other words, there is 40 times more rainfall than there is water vapor in the atmosphere at any one time.
In the year 2100, global warming theory predicts that water vapor levels will increase by 23%. Yes, it is 23%.
So it is just going to rain 23% more +/-.
There is only 9 days of flux to play with. You can’t have water vapor accumulating on a never-ending basis for years on end without it simply raining more. It can increase by 23% but it is still going to rain out at roughly the same rate.
Either that, or global warming models can’t be trusted to forecast precipitation. The last time it was 2.0C warmer on the planet, there was no deserts, and the whole land surface was one big forest. I guess CO2 makes all the difference in where rainfall happens.
The prediction is for a regional drought, not a world wide drought. There are regional droughts going one right now, for example. There are no indicators that the global warming models have ever predicted anything that has come to pass and so they have stopped calling their prognostications “predictions”. Theirs is a 95% confidence level in a SWAG based on a belief system that is guaranteed to produce grant money.
I thought the models weren’t fit for regional projections.
Total accumulated precipitation in inches over the 10 days from the GFS model. Yes, there are some dry areas but increase this rate by 23% and how can anywhere have drought.
http://www.tropicaltidbits.com/analysis/models/gfs/2015021306/gfs_apcpn_global_40.png
Since multi-decadal droughts in the SW and intermountain region are well established from the paleo-record, it is clear that once again we see the climate hypesters using deceit to sell their papers.
It’s too bad, but “Texas Toast” will fall by the wayside, as it’ll be too insensitive and politically incorrect to use the term, with Texas toasted.
Well, lol, you may be right, Mr. Robertson.
On the other hand:
Since much of the motive behind such “studies” is to use Envirostalinist regulations to make petroleum production as pseudo-costly as nuclear energy…..
to thumb my nose at those lousy Enviro-thugs,
I will LOUDLY AND PROUDLY PROCLAIM HERE: the term “Texas tea” (no matter what state’s ground it comes “a bubblin'” up from) will be here for a looooong time to come.
“Black gold….. Texas Tea…. O’l, that is!” #(:))
(youtube)
Good ol’ Jed Clampet was doin’ okay until they “up an they moved” to California. That’s where everyone started trying to take their money.
Just
like
today.
********************************************************************
Note re: song: it’s style fits the “study” being debunked above.
While Bob Tisdale’s work is impeccably scholarly, that of the IPCC and its gang is just a bunch of slick, fast-talking, backwoods, scientist-wannabes trying to sell their “Patent Medicine.”
@Janice , thanks for the chuckle but “The , Just Like, Today is sobering, Oh I forgot to check, how much rain did that “Pine Apple Express” deliver to California I was watching golf this and last week NADA! (Sunny and calm) Am I right? There were no end of California stories of floods or blocked highways or snowed in mountain passes what happened? ( we sometimes do have to look back even if it is for 2 weeks)
Hi, A Sybot!
You are so very welcome (thanks for saying so). Okay, because I like you, I looked up the rainfall for the Bay Area during the Pineapple Express “event.”
“More than 13 inches of rain fell in Venado in unincorporated Sonoma County… .”
Source: http://kron4.com/2015/02/09/seasonal-rain-totals-back-to-normal-after-recent-storm/
And that’s the weather, folks. Stay tuned for that cute polar bear story we’ve been promising you all evening long JUST TO MAKE YOU KEEP WATCHING OUR BORING NEWS SHOW, bwah, ha, ha, ha,ha, haaaaaaaaaaaa!
Bye for now!
Janice
If I understand the main thrust of their argument it is that , although there will be increased cold season precipitation in some areas , eg california , it will be greatly offset by increased evaporation due to the higher soil temperatures . So they seem to me , a layman in these matters , to be relying on the forecasted global temperature rises in the RCP models to produce the lower moisture levels . I did not see much discussion of how weather patterns, and ocean circulation events are affected by the models , but that is presumably contained within the body of the models.
If not taking into account actual weather systems , but relying mainly on estimated increased temperatures (which may not occur) then the paper , for all its impressive appearance , is actually a bit thin .
Or am I completely out of my depth here?
EPA Drone reconnaissance reveals that you are in about up to your ankles.
NSA blog intercepts confirm that you have publicly questioned gov’t “findings”.
IRS computers just stuck your name on the audit list
DHS operatives have moved your name to a domestic watch status.
Oh heck . In that case I had better find something nice to say about it ( see below in reply to Brandon ).
http://www.nasa.gov/content/goddard/1934-had-worst-drought-of-last-thousand-years/
A study to show the current drought is nothing special.
I love “state-of-the-art.”
That’s the state in which modelers finger-paint, and we’re all supposed to lower our gaze and say “Yessum NASA’ “.
(I think they call it California.)
In their favour, they admit there was a Medieval Warm Period which they renamed to avoid the implication it was ‘warmer’ in those days. I noticed they shortened its duration as well. Those are two pointers that it is very embarrassing to the CO2-only AGW hypothesis.
Landscheidt predicted a severe drought in the US in 2018. If it materialises, both the barycentric and GCM method promoters will find solace. Interesting. A complication may be that it will be a lot colder by then, but the cold will be dismissed as weather while the drought will be blamed on CO2. We already know how that works, right?
I think the paper is significant in that it says paleoclimate data support the warmer-than-now MWP. Is that a first for the Team in the past 30 years? Common sense is starting to prevail. Next thing you know there will be a LIA. Then, who knows…natural variation?
‘That’s the title of a new paper by Cook et al.’
Sorry but even using industrial strength ones that sentence although broke the BS meter has it went right off the scale.
So it hardly a surprise to find its ‘models ‘ and selective speculation all the way . The sad part is that although it is normal for climate ‘science’ to consider that you can tell has many lies as you like , your data can be worthless and your methods rubbish but all that matters is what press your ‘research’ gets , it is no less annoying that this BS has be making the rounds in the mainstream media.
From the article:
“… indicating a coherent and robust drying response to warming”.
Couldn’t “a coherent and robust warming response to drying” also be true? Why did they not test that hypothesis to exclusion?
UK media panic underway —
at the Independent.
Sure enough the study by “NASA Scientists” is a big headline I today’s paper.
Unfortunately there is truth to the idea if you keep telling the same old lies again and again with little or no noticeable rebuttal (anything the denialist say is wrong), people will begin to believe all the lies. Meanwhile those who see and know the lies, get wore out and numbed by the same old lies.
http://wattsupwiththat.com/2014/05/22/interesting-graph-fraction-of-the-globe-in-drought-1982-2012/
If you look at this great chart you will see the real story about climate change/drought.