 It never fails. Hurricanes and tropical cyclones always bring out the manmade global warming alarmists, with their claims of unusually warm sea surface temperatures along the storm tracks. Of course those fictionally warmed sea surface temperatures were caused by rising CO2 emissions. We expected and saw that nonsense when Sandy struck the east coast of the U.S. mainland back in 2012. Not unexpectedly, data contradicted the claims. See the posts here and here.
The same unwarranted alarmist claims magically appeared when the two tropical cyclones (Iselle and Julio) threatened Hawaii last week. Iselle’s storm track is shown on the map to the right. (Please click on it to enlarge.) I’ve highlighted the coordinates I’ve used for Iselle’s storm track…before it reached Hawaii. Julio’s track was similar but ran a little north of Iselle’s. So, were the sea surface temperatures along Iselle and Julio’s storm tracks unusually warm, and have the sea surface temperatures there warmed during the satellite era?
WEEKLY DATA
The weekly Reynolds OI.v2 sea surface temperature anomalies for the coordinates of 15N-20N, 155W-120W, for the week centered on August 6, 2014, were above the 1971-2000 average. (Those are the base years used by NOAA for the Reynolds OI.v2 data.) But they were not unusually warm as shown by the horizontal red line. They have been warmer quite regularly since the start of the weekly data in January 1990. And it’s blatantly obvious that the sea surface temperatures have cooled there. The cooling rate is -0.3 deg C/decade since 1990, based on the linear trend shown in blue.

Weekly Iselle and Julio Storm Track SST Anomalies
MONTHLY DATA
The monthly satellite-enhanced Reynolds OI.v2 data stretches back as far as November 1981. The July 2014 sea surface temperature anomalies for Iselle and Julio’s storm tracks (shown in red) were not unusually warm, and the sea surface temperatures there have cooled since November 1981 based on the linear trend (shown in blue).

Monthly Iselle and Julio Storm Track SST Anomalies
HOW FAR BACK CAN WE GO AND STILL SHOW NO WARMING IN THAT PART OF THE EASTERN TROPICAL NORTH PACIFIC?
The next graph shows the NOAA ERSST.v3b-based sea surface temperature anomalies for the coordinates of 15N-20N, 155W-120W, from January 1880 to July 2014. I’ve highlighted the period of January 1930 through July 2014 in brown. Since January 1930, the warming rate of the sea surface temperatures for Iselle and Julio’s storm track is only +0.004 deg C/decade. That’s 4 one-thousandths of a degree C per decade. And as shown by the red horizontal line, the sea surface temperature anomalies back as far as the 1880s were comparable the July 2014 value…if you believe sea surface temperature data back that far.
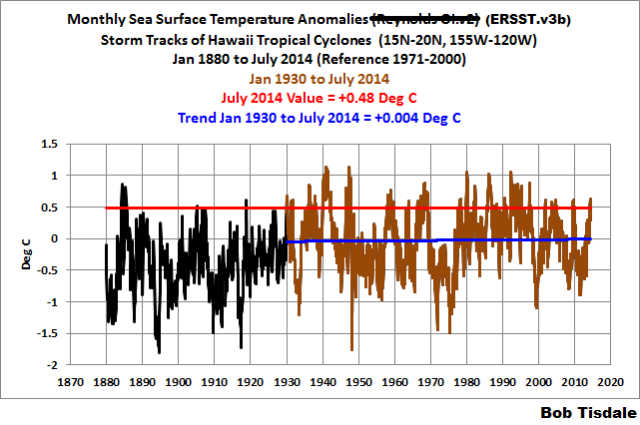
Long-Term Monthly Iselle and Julio Storm Track SST Anomalies
YEAH BUT, YEAH BUT, YEAH BUT
History has shown, if I were to end the post there, then someone would say something to the effect of, Greenhouse gases have increased the amount of moisture in the air, making tropical storms worse than before.
To counter that nonsense, we turn to the NCEP/DOE Reanalysis-2 outputs of Specific Humidity, which represents the amount of moisture in the column of atmosphere. The units are kilogram of water vapor/kilogram of dry air. For Iselle and Julio’s storm tracks, there is nothing unusual high in the specific humidity for July 2014, and the trend since 1979 shows a decrease, not increase, in specific humidity southeast of Hawaii.

Monthly Iselle and Julio Storm Track Specific Humidity Anomalies
SOURCES
The weekly and monthly Reynolds OI.v2 sea surface temperature data are available through the NOAA NOMADS website here. The long-term monthly NOAA ERSST.v3b sea surface temperature data are available through the KNMI Climate Explorer. And the monthly specific humidity output of the NCEP-DOE Reanalysis-2 is available from the NOAA NOMADS website here.
Don’t confuse them with facts, Bob!
The figure representing the specific humidity displays two constant trends, a sudden lower trend around 1997. Although a local but not small surface representing it reflects the cooling trend since that time, given the fact that water is a GHG.
“It’s Worse Than We Thought (TM)”
So Sublimation of water is 2,830,000 J/kg.
http://www.theweatherprediction.com/habyhints2/524/
And since most of this energy is taken from the nearby sea water – it will cool
Specific Heat Sea Water = 4,009 J/kg oC 2,830,000/4,009 = 705 or 705 kg by 1- oC
Since there is 1,0000 Kg per m^3 or 100 Kg per cm-m^2, and 1″ (2.54 cm) of water sublimated will cool the next (705/100)/2.54 = 2.77″ of water 1 oC. How many inches of water do you think each sq meter of ocean got sucked up by these two systems and how much cooler the sea is now?
Data is just propaganda put out by deniers. Stop it.
So the trend looks to be cooler and drier.
Just noticed that the “like” button has made it’s way back into the trash heap. Good.
I was amused to see the media excitement about the possibility of two hurricanes striking the islands. I told my wife that Iselle would be completely destroyed if she ventured near the big island; Julio saw what happened and ran North like a scalded poi dog!
Bob, STOP IT.
These poor deluded people need counselling, not public humiliation.
You are just being cruel. (but the scadenfreude is getting better by the month 🙂 )
If an alarmist wants to see an increase in anything (temps, precip, tornadoes, etc) then any decrease observed is really an increase in disguise.
“My mind is made up. Don’t confuse me with the facts!”.
/sarc
More fun with tropical storm Flossie and the big Island of Hawaii….
FF to 0:42 the last moments in the video….Poof….
The theory back then was gasses from the Kilauea volcano…
http://www.sciencedaily.com/releases/2014/07/140729084542.htm
Yeah but, that cooling trend is caused by global warming.
You know it makes sense.
@ Bob
Just reading how ocean Temp’s ,salinity and conduction go hand in hand. I see the ocean as a capacitor and through conduction it releases energy to the atmosphere via point charges and a AC pathway opens up. Anyway just my opinion , I think this link is important to understanding how the ocean works. http://sam.ucsd.edu/sio210/lect_2/lecture_2.html . Could you explain el nino using a globe of the earth and a horse shoe magnet ? Do you see how energy is released by the sun and is cooled and then drawn back to the surface , I see the same thing going on here on earth. ( cold attracted to hot) I don’t see enough referencing to Coulombs Law which would help see that my opinion above is fact.
Good article, Bob.
It is interesting to see that this area has been cooling since 1995.
It would seem reasonable to suggest that the recent rise in SST may have contributed to the formation of these storms even if it is not an all time record.
What would be needed is hurricane frequency or accumulated cyclone energy for this area and a comparison to the temp record.
I think you have show from previous storms that they do cause a noticeable drop in SST. They are an important natural negative feedback that counters surface warming ( from whatever cause ).
There does seem to be strong linkage in the North Atlantic.
http://climategrog.wordpress.com/?attachment_id=215
IIRC Dr Ryan Maui’s data shows hurricanes peaked between 2000 and 2005. It would be interesting to see an update on that.
Thanks, Bob. How refreshing data can be!
I see tropical cyclones as emergent phenomena out of the chaotic weather system. They sure like to fly over warm waters, but they are slaves of the steering winds that prevail at the time. These winds can steer them into cold or warm waters.
Cyclones are not heat-seeking, self-steered phenomena. When they run over cold waters they spend their energy and dissipate.
Global Tropical Cyclone Activity – Dr. Ryan N. Maue
Last 4-decades of Global and Northern Hemisphere Accumulated Cyclone Energy: 24 month running sums. Updated on July 31, 2014. At http://models.weatherbell.com/tropical.php
I see peaks at ’73, ’93-’94, ’98 and ’06.
Yeah but, yeah but, yeah but, the data must be wrong!
Bob, you are a resource onto yourself! I have already linked to your El Nino articles more than once. I suspect this one will be no different. Thanks!
jmorpuss says:
August 13, 2014 at 3:30 pm
___________________
It all comes down to physics, in the end.
Thanks Bob. You provide valuable input and sanity as usual.
Just a few days ago, the local news in Sarasota was asking for support for the 2 Hurricanes that hit Hawaii. If I am not mistaken, we didn’t even have a TS at landfall, relating to the one that actually came close…..
Soon, the models will put out the press releases, if not already…….
Just sayin,,,,,,
Aloha:
Pele (Mauna Loa) 1; Iselle (& Julio) 0
Yes, I live on the Big Island.
@Lonnie King – you think you can lend Pele to the east coast next month? 😉
Slightly OT but related.
Cumulative NOAA Tornado count in USA as of Aug 9, 2014
861, about 75% of 10 year average on this date.
Only 2013 (736) and 2005 (836) had less.
http://www.spc.noaa.gov/wcm/torngraph-big.png
Bob, you’re a one-man Climate Change Alarmism Wrecking Crew. Good job!
Joel
Stephen Rasey says: August 13, 2014 at 7:40 pm
Slightly OT but related Cumulative NOAA Tornado count in USA as of Aug 9, 2014
861,
Try looking at the Confirmed / Preliminary Count. Add the Confirmed months (only thru May now) with the remaining Preliminary and you get a count of 751. May alone had APR 220 Prelim 113 Confirm.
http://www.spc.noaa.gov/climo/online/monthly/newm.html
I see something interesting in your 1880 to present ssta chart. You know how I have always seen the cyclic pattern in looking at charts. Well, start with a line from 1884/85 to 1914/15. Follow that with a line from 1914/15 to 1946/47, and then draw a line from 1946/47 to 2006/07. It can then be noted that those lines follow the cooling in the late 1800s into the mid 1910s, which is then followed by the warming which ends in the late 1940s. Then that is followed by the cooling period up till the mid 1970s. After which the grand global warming occurs from 1976/77 to it,s peak in 2006/07. All the years are approximations from the way that I look at the data.
The ocean pattern in the zone that chart encompasses fits that pattern of warming/cooling to a ‘T’. Also noteworthy, is the period of years from 1978 till 1998. Note that this is the longest sequence of years with so little variation between the highs and lows. That correlates with the grand warming. Is this particular spot in the ocean a ‘key’ spot for some reason? Lastly note that since 2006/07 the following years revert back to a higher variation between highs and lows as is seen prior to 1976 and back to the beginning years of the chart. One last note, look at the years between 1919 till 1930, where it can be seen that this warming period also shows a similar streak of less variation in high to low, although it does not extend for as many years as the recent warming period. This particular zone could well be a keystone to global warming/cooling.
“”Follow that with a line from 1914/15 to 1946/47, and then draw a line from 1946/47 to 2006/07.”” That line should have read “…from 1946/47 to 1976/77.. and then from 1976/77 till 2006/07”.
Andrew,
Just sent some beer money your way via your Fling funds link. Buy yourself and Bob a beer next time you meet. Thanks for the good work, both of you.
Joel
Does will combine three tropical storms?
http://earth.nullschool.net/#2014/08/18/0900Z/wind/isobaric/850hPa/orthographic=-136.69,14.72,1676
Look at the cool water just east of China from recent tropical storms stirring up the water:
http://vortex.plymouth.edu/mapwall/ssta.png
beng says:
Look at the cool water just east of China from recent tropical storms stirring up the water:
Exactly can be seen. Look at also at the Atlantic with Africa.
Here is the next global scare: Human induced warming REDUCES the number of natural and necessary hurricanes, tornados, and other weather events thus has a deleterious affect on both marine and land biospheres. Our children will not know what hurricanes are. Therefore we must curtail human [fill in with your favorite activity] in order to save Earth and return to our natural and good variable and unpredictable weather state.
Us see vortex in the Pacific.
http://earth.nullschool.net/#current/wind/surface/level/overlay=misery_index/orthographic=-110.05,17.15,1106