 As many know, I’m a big fan of citizen science. There’s much that can be contributed by the layman that the government often cannot or will not do.
Since many people seem to be worried about nuclear fallout from Japan’s nuclear reactors, particularly on the west coast, I’m happy to introduce this live map, updated every five minutes, from the volunteer operated National Radiation Network.
Since this is likely to be popular, and to minimize the page loads on the website, I’ve put the image beyond the “read more” divider. Please only click if you are interested in seeing the live USA radiation counts map:

The map is updated every 5 minutes.
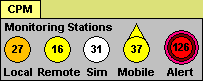
Key to the map:
![]() Nuclear Power Site Location
Nuclear Power Site Location
Alert Level = 100 CPM (counts per minute)
As you can see from the four west coast stations, there does not appear to be any elevated activity in radiation counts. The CPM is a unit of measurement for a Geiger counter, corresponding directly to the audible beeps or clicks per minute. CPM is the standard unit of measurement for alpha and beta radiation, and is also commonly used to express background radiation in numerical terms.
Normal background radiation is typically in the range of 25-75 counts per minute, depending on location and surroundings. Much of the natural background radiation comes from cosmic rays in addition to natural decay of earth bound elements. Of course, if somebody drives a banana truck into your neighborhood, that may change.
You can become part of this network if you are interested by purchasing a datalogging geiger counter and the network software to enable you to plug into and submit live data to the network via your office or home internet connection. Images below show a digital Geiger counter and the software with the RS232 interface cable.

 Unfortunately, the company, MineralLab announced on their website that they are completely sold out due to the demand in wake of the Japan reactor events.
Bookmark it for future use if you are interested and visit again when this all settles down.
===============================================================
In related news, a similar setup is operating online in Tokyo. The one week graph is certainly encouraging.
Denphone Tokyo Office Geiger Counter
Posted: 2011-03-16 2:28 pm by Simon Gibson.
Here are the outputs from the Geiger Counter in our office in Azabujuban, Tokyo:
4 hour reading

24 hour reading

One week reading

h/t to Poptech for the original map link.
Discover more from Watts Up With That?
Subscribe to get the latest posts sent to your email.
Thank goodness you guys didn’t get the radiation (from what i can see).
Fingers crossed for Japan 🙁
Bah. The radiation “hitting” the US is trivial. And there will be zero radiation casualties in Japan. It’s all hysterical hooey.
boston : rainwater has radiation in it
concerns about water supply
people who arent taking this seriously have no clue about wtf you are talking about.
once it gets into food, children will be affected
the retard above is brain dead, there are still cancers in belarus because of fallout into the water.
nat;
bananas have lotsa radiation (K70, y’know?). Stay far way! Peanut butter is almost as bad.
You are clueless about radiation and biology. The Belarus numbers are pure computer projections based on the “no safe dosage” presumption. Which is false.