 As many know, I’m a big fan of citizen science. There’s much that can be contributed by the layman that the government often cannot or will not do.
Since many people seem to be worried about nuclear fallout from Japan’s nuclear reactors, particularly on the west coast, I’m happy to introduce this live map, updated every five minutes, from the volunteer operated National Radiation Network.
Since this is likely to be popular, and to minimize the page loads on the website, I’ve put the image beyond the “read more” divider. Please only click if you are interested in seeing the live USA radiation counts map:

The map is updated every 5 minutes.
Key to the map:
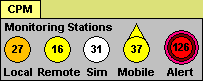
![]() Nuclear Power Site Location
Nuclear Power Site Location
Alert Level = 100 CPM (counts per minute)
As you can see from the four west coast stations, there does not appear to be any elevated activity in radiation counts. The CPM is a unit of measurement for a Geiger counter, corresponding directly to the audible beeps or clicks per minute. CPM is the standard unit of measurement for alpha and beta radiation, and is also commonly used to express background radiation in numerical terms.
Normal background radiation is typically in the range of 25-75 counts per minute, depending on location and surroundings. Much of the natural background radiation comes from cosmic rays in addition to natural decay of earth bound elements. Of course, if somebody drives a banana truck into your neighborhood, that may change.
You can become part of this network if you are interested by purchasing a datalogging geiger counter and the network software to enable you to plug into and submit live data to the network via your office or home internet connection. Images below show a digital Geiger counter and the software with the RS232 interface cable.

 Unfortunately, the company, MineralLab announced on their website that they are completely sold out due to the demand in wake of the Japan reactor events.
Bookmark it for future use if you are interested and visit again when this all settles down.
===============================================================
In related news, a similar setup is operating online in Tokyo. The one week graph is certainly encouraging.
Denphone Tokyo Office Geiger Counter
Posted: 2011-03-16 2:28 pm by Simon Gibson.
Here are the outputs from the Geiger Counter in our office in Azabujuban, Tokyo:
4 hour reading

24 hour reading

One week reading

h/t to Poptech for the original map link.
Discover more from Watts Up With That?
Subscribe to get the latest posts sent to your email.
So far today I’ve had 2 BEDs via a banana and a handful of nuts.
Here is a link to a recent update.
At the bottom of this page is a list of the injuries among power plant workers. It is interesting and needs to be more widely circulated.
http://www.world-nuclear-news.org/RS_Progress_by_on-site_workers_1703111.html
You mean we’re not extrapolating averages across large intervening regions devoid of any volunteer’s gieger counter?!
Sorry: “Geiger” counter.
Same website as John Hultquist noted except different story. This gives some interesting data on declining radiation figures over the past few days as well as some interesting data on temperatures.
http://www.world-nuclear-news.org/RS_Attempts_to_refill_fuel_ponds_1703111.html
Looks like a very hopeful trend.
Bernie
I’m with NOAA Programmer.
Note that the people in the net are basically clustered near … nuclear sites. This is urban warming redux!
Regardless, thank you for providing this service. And… I’ll bet “an app for that” would fund your retirement if it could clear ASAP.
Awww enough with the bananas please Anthony. The poor oft battered folk of North Queensland rely on banana plantations to get back on their feet.
A fall in banana sales is not what they nedd right now. (yes your influence is far and wide)
regards with cheek
Baa
Thanks for posting this, Anthony. Very nice.
Here’s another data set, (see the link below) to US EPA’s RadNet data, for radiation counters across the USA. There are many other datasets in this also. One must register first, then obtain free access to the databank.
The RadNet data is taken hourly, and has beta and several types of gamma radiation counts from the stations. There are archives, data downloading in Excel(tm) and plotting capabilities. For a government website, not bad, actually.
I looked at the data for beta radiation for the past week on the US west coast, from Eureka (California) and Anaheim (California) – which is near Los Angeles and the home of Disneyland. Eureka has an average of about 15 counts per minute, and Anaheim is somewhat higher at about 30.
https://cdx.epa.gov/SSL/CDX/Login.asp
Also, here’s a link to the State of Alaska’s statement on radiation from nuclear incident in Japan. It gives the typical background beta radiation count as about 5 to 50 counts per minute, and states that no concern is warranted up until about 2000 counts per minute.
http://www.hss.state.ak.us/prepared/assets/fs_radiation.pdf
Correct me if I am wrong, but we seem to be getting slightly elevated levels in places with direct fights from Tokyo.
It would be interesting to see measurements added from Hawaii.
Here’s the iPhone app you’ve all been waiting for. the iPhone iMeter….it’ll meter anything you need to meter on your iPhone!
It’s accurate, reliable, instant unit conversion, portable, affordable, NIST traceable (no, it’s a different NIST..), and best of all, it’s only $.99 at the ap store.
Just point your phone at whatever you’re needing to measure, and slide your finger up on the screen to give the desired reading.
THIS is the ultimate alarmist tool! I use it all the time to detect B.S., or show people how CO2 is rising as we speak. Now, measure GoreRads in situ, in real time, and scare everyone with claims of dangerous something-or-other whenever you want to.
http://www.apptism.com/apps/imeter
(believe it or not, I’ve actually convinced a few people that it’s real…..groan….)
Looks to be a lot of ‘bananas’ in Denver?
/sarc
In Alaskan news, the EPA has set up monitoring sites (as well
as on Guam and the Hawaiian Islands) but they don’t expect to
see much fallout since the jet steam is currently “Far south
of Alaska. Hmmm… doesn’t “far south of Alaska take you
to British Columbia, Washington and Oregon?
See:
http://www.ktuu.com/news/ktuu-alaska-radiation-epa-sends-radiation-monitors-to-alaska-20110316,0,6429116.story
If you want some quick near real time visualizations of which way
the wind blows across the Pacific:
MTSAT looking with infrared:
http://www.goes.noaa.gov/FULLDISK/MTIR.JPG
MTSAT looking in visible wavelengths:
http://www.goes.noaa.gov/FULLDISK/MTVS.JPG
GOES Full Disk Infrared:
http://www.goes.noaa.gov/FULLDISK/GWIR.JPG
GOES Full Disk Visible wavelength:
http://www.goes.noaa.gov/FULLDISK/GWVS.JPG
I usually check on two animated world loops when I’m interested
how our regional weather fits into the greater picture::
http://www.ssec.wisc.edu/data/comp/cmoll/cmoll.html
http://www.sat24.com/image2.ashx?region=world&time=false&index=6
Denver was over 70 before the last refresh. I’ve got the kids loaded up with iodine and have packed the car…
/sarc
Just a note about the nuclear plant shown on the Oregon-Washington border northwest of Portland. It’s no longer there in any meaningful sense. According to Wikipedia, decommissioning and demolition began in 1993 and was completed in 2006.
All that’s left at the site are the spent fuel rods, and (contrary to Wikipedia) they’re no longer in the spent fuel pool. Portland TV station KGW reports: “The waste is now stored inside 34 stainless steel containers, each surrounded by 150 ton casks made of concrete.” I’m sure the radiation levels at the site are determined more by the radioactive minerals in the concrete than by the contents of the casks.
How about a grayed-out icon showing that it once was, but is no more?
What about Hawaii?
REPLY: They have sensors there, but for some reason not on the network right now. They have a manual note that says:
“We know a Radiation Monitoring Station on the Island of Maui in Hawaii, and have asked them to “plug in” to the Network, but so far we have received a report of just a manual reading as of 3/13/11 or 3/14/11 indicating no elevated radiation levels.”
– Anthony
Geiger counters of this sort are good when looking for gross radiation levels, but do not tell you how that may translate into exposure rate which is the measure of potential dose (not necessarily the dose you are actually getting). I prefer what is called a microR meter for measuring my background levels. The microR meter is much more sensitive and the reading is easier to interpret for significance.
Anyway, if you insist on buying a Geiger counter, here are some tips:
When using a Geiger counter like this, seeing spikes of two or three times normal background is not unusual, so don’t panic if it does this. Background radiation varies considerably from daylight to night time, so expect this. If you move the meter around, expect variation. I don’t know about this particular meter, but just the motion of moving the meter will swing the needle on some meters (geotropism) and give you a false reading. The detector should be facing up if you are measuring background airborne contamination such as we may get from Japan. However, areas with relatively high radon levels may cause deposition of radon daughter products on the detector causing elevated counts over time, so I put a piece of tissue over the detector (I lose alpha counts doing this). Be careful where you put the meter, you may be in a naturally “hot” area. Be careful what you bring around the meter, there are lots of things in our personal worlds that can cause elevated counts.
You can distinguish alpha, beta or gamma emissions by doing the following:
1) put a piece of tissue paper over the detector. If the counts drop dramatically you are measuring an alpha emitter. Side window detectors, such as seen on the old Civil Defense meters, won’t detect alpha particles. Even pancake detectors such as used by the Inspector above have a very low efficiency for alpha particle detection. So if you see a dramatic drop when you put tissue over the detector, you have a serious radiation problem.
2) Put a 3/8 inch piece of plastic or wood over the detector. If the counts drop dramatically you are measuring a beta emitter such I-131 (also a gamma emitter so it may be a little confusing). The pancake probe on the Inspector is typically about 30% efficient.
3) If the counts don’t drop much after doing the above, you are measuring a gamma emitter such as Cs-137. Most of your normal background counts are X-ray/gamma emissions from the sun and natural radioactive materials that are all around us.
If you spill something on the detector, don’t try to clean it yourself – guaranteed you will ruin the detector. Have the manufacturer replace it. If your Geiger counter has a cable for the detector, it is not unusual to see the cable go bad and it will peg your meter. Don’t stick your tongue to an attached cable – there is about 500-1000 volts running through it. The window on a pancake or end window detector is fragile – I had a stalk of stiff grass break one ( I won’t say how many I’ve broken).
How do you know your detector is calibrated properly? You won’t. However, if you can get hold of a source of radiation such as old, orange FiestaWare, you can see if there is any change in your detector over time. It is critical, if you do this trick, to make sure you maintain the same geometry each time, i.e. the exact same distance from meter to source and exact same location of source relative to detector. With a uranium source such as found in FiestaWare, you should see very, very little decrease in counts over a year or more.
The above are just a few things you need to understand when using a Geiger counter. If you do not get decent training on how to properly use a meter like this, I personally think you are wasting your money, but it is your money and I like most of the companies that make radiation detectors so be my guest. Proper training also includes a course on how radioactive atoms and radiation interact with matter and, by extension, the detector.
they are missing one of the counties first nuke sites just to the west of me in southeastern Idaho. Soon to be a fuel reprocessing site also.
Wow… hot time in the mountains!
Wonder what’s in Boulder Colorado besides NCDC, NCDIC, NCAR, NOAA that makes it so darn HOT?? I thought they only hiked temperatures. Guess not.
Hi Anthony,
Thanks for the map and links!
Question, however – what is being included as ‘nuclear power sites?’ What’s shown just doesn’t match up. Here’s a map of US nuclear power reactors: http://www.nrc.gov/reactors/operating/map-power-reactors.html
So then I thought, ok, maybe it’s including research reactors, but while I see South Texas Project & Commanche Peak, the Texas A&M research reactors aren’t there and neither is the UT reactor. I see what must be Pantex (DOE Weapons Facility) in the panhandle near Amarillo, but what’s the one to the west of DFW in the middle of nowhere? Then there’s Nevada, no commercial nukes in the state – so, ok, I thought, it must be including the Nevada Test Site, and maybe Yucca Mountain or something… even tho there’s no power reactor there, but then what’s the third site? Plus, as someone else already posted, Trojan (outside of Portland Or) is long gone – and there are only two stations in California, Diablo Canyon and San Onofre. What in the world is in Montana? There are others too but these are the ones that caught my eye right off…
Sooooo….. I’m confused! Clearly the map legend ‘nuclear power sites’ is not referring just to commercial nuclear power sites, but I can’t make out just what it is or isn’t including. Help please.
Also, and suspect I’m going to feel stupid when I get the answer on this one, but what type of monitoring site is the “sim” referring to?
http://www.cbc.ca/news/canada/british-columbia/story/2011/03/16/bc-japan-reactor-hanford.html
Reactor in Washinton state, next to volcanoes LOL
re post by: wayne says: March 18, 2011 at 12:36 am
It’s this little thing called altitude. :0) Makes a huge difference in normal background radiation levels.
For the Tokyo Geiger counter readings – I hope they’re not taking those readings INSIDE their office building. If you read their site literally, that’s what they are doing – and that won’t be representative of the dose rate outside. For that matter, you’ll get a boatload of building effects on the plume pathway in a city – can easily wind up with some spots significantly higher dose rates and others significantly lower, all based on how the wind is blowing through the city & around and over the buildings, and how each building is causing turbulence, flow disruptions, pathway deviations, etc.
To Wayne re “Wonder what’s in Boulder Colorado besides NCDC, NCDIC, NCAR, NOAA that makes it so darn HOT??
Actually the measurement looks to come from the Denver area and thus I could use an old health physics joke and say that we are scintillating. Putting up with Boulderites is not scintillating, though frequently entertaining in a twisted way.
We have a higher average background in Colorado because of our altitude (more solar radiation) plus we have a fair amount of uranium in the ground (more terrestrial radiation). We also have a lower leukemia incidence. Interesting, huh?
If you saw my previous post, you will note there are many factors that will affect the reading of a Geiger counter at these low levels being reported. I could probably list at least 20 more influencing factors beyond what I posted earlier. Take this map and readings with a grain of salt.
To all: I notice the US map readings are in counts per minute (CPM) and the Japanese readings are in uR/hr. Big difference. I’ve measured a lot of different places in the US and normal background readings will range from 5 to 50 uR/hr on the average. Spikes you see on the Japanese graphs are within normal background measurements. I for one was pleased to see this.
‘Since this is likely to be popular, and to minimize the page loads on the website’ – Slight mistake here, It’s not popular you and your web site are Mr Watts.
Watching France 24 TV news channel (0900) the Japanese Prime Minister said:
” There have been no readings of radioactivity in Japan that are high enough to be a harm to human health !” The reporter on the Japanese TV said that the media was to blame for a nuclear scare story.