Guest post by David Middleton
INTRODUCTION
Anyone who has spent any amount of time reviewing climate science literature has probably seen variations of the following chart…

A record of atmospheric CO2 over the last 1,000 years constructed from Antarctic ice cores and the modern instrumental data from the Mauna Loa Observatory suggest that the pre-industrial atmospheric CO2 concentration was a relatively stable ~275ppmv up until the mid 19th Century. Since then, CO2 levels have been climbing rapidly to levels that are often described as unprecedented in the last several hundred thousand to several million years.
Ice core CO2 data are great. Ice cores can yield continuous CO2 records from as far back as 800,000 years ago right on up to the 1970’s. The ice cores also form one of the pillars of Warmista Junk Science: A stable pre-industrial atmospheric CO2 level of ~275 ppmv. The Antarctic ice core-derived CO2 estimates are inconsistent with just about every other method of measuring pre-industrial CO2 levels.
Three common ways to estimate pre-industrial atmospheric CO2 concentrations (before instrumental records began in 1959) are:
1) Measuring CO2 content in air bubbles trapped in ice cores.
2) Measuring the density of stomata in plants.
3) GEOCARB (Berner et al., 1991, 1999, 2004): A geological model for the evolution of atmospheric CO2 over the Phanerozoic Eon. This model is derived from “geological, geochemical, biological, and climatological data.” The main drivers being tectonic activity, organic matter burial and continental rock weathering.
ICE CORES
The advantage of Antarctic ice cores is that they can provide a continuous record of relative CO2 changes going back in time 800,000 years, with a resolution ranging from annual in the shallow section to multi-decadal in the deeper section. Pleistocene-age ice core records seem to indicate a strong correlation between CO2 and temperature; although the delta-CO2 lags behind the delta-T by an average of 800 years… 
Ice cores from Greenland are rarely used in CO2 reconstructions. The maximum usable Greenland record only dates as far back as ~130,000 years ago (Eemian/Sangamonian); the deeper ice has been deformed. The Greenland ice cores do tend to have a higher resolution than the Antarctic cores because there is a higher snow accumulation rate in Greenland. Funny thing about the Greenland cores: They show much higher CO2 levels (330-350 ppmv) during Holocene warm periods and Pleistocene interstadials. The Dye 3 ice core shows an average CO2 level of 331 ppmv (+/-17) during the Preboreal Oscillation (~11,500 years ago). These higher CO2 levels have been explained away as being the result of in situ chemical reactions (Anklin et al., 1997).
PLANT STOMATA
Stomata are microscopic pores found in leaves and the stem epidermis of plants. They are used for gas exchange. The stomatal density in some C3 plants will vary inversely with the concentration of atmospheric CO2. Stomatal density can be empirically tested and calibrated to CO2 changes over the last 60 years in living plants. The advantage to the stomatal data is that the relationship of the Stomatal Index and atmospheric CO2 can be empirically demonstrated…

When stomata-derived CO2 (red) is compared to ice core-derived CO2 (blue), the stomata generally show much more variability in the atmospheric CO2 level and often show levels much higher than the ice cores…

Plant stomata suggest that the pre-industrial CO2 levels were commonly in the 360 to 390ppmv range.
GEOCARB
GEOCARB provides a continuous long-term record of atmospheric CO2 changes; but it is a very low-frequency record…

The lack of a long-term correlation between CO2 and temperature is very apparent when GEOCARB is compared to Veizer’s d18O-derived Phanerozoic temperature reconstruction. As can be seen in the figure above, plant stomata indicate a much greater range of CO2 variability; but are in general agreement with the lower frequency GEOCARB model.
DISCUSSION
Ice cores and GEOCARB provide continuous long-term records; while plant stomata records are discontinuous and limited to fossil stomata that can be accurately aged and calibrated to extant plant taxa. GEOCARB yields a very low frequency record, ice cores have better resolution and stomata can yield very high frequency data. Modern CO2 levels are unspectacular according to GEOCARB, unprecedented according to the ice cores and not anomalous according to plant stomata. So which method provides the most accurate reconstruction of past atmospheric CO2?
The problems with the ice core data are 1) the air-age vs. ice-age delta and 2) the effects of burial depth on gas concentrations.
The age of the layers of ice can be fairly easily and accurately determined. The age of the air trapped in the ice is not so easily or accurately determined. Currently the most common method for aging the air is through the use of “firn densification models” (FDM). Firn is more dense than snow; but less dense than ice. As the layers of snow and ice are buried, they are compressed into firn and then ice. The depth at which the pore space in the firn closes off and traps gas can vary greatly… So the delta between the age of the ice and the ago of the air can vary from as little as 30 years to more than 2,000 years.
The EPICA C core has a delta of over 2,000 years. The pores don’t close off until a depth of 99 m, where the ice is 2,424 years old. According to the firn densification model, last year’s air is trapped at that depth in ice that was deposited over 2,000 years ago.
I have a lot of doubts about the accuracy of the FDM method. I somehow doubt that the air at a depth of 99 meters is last year’s air. Gas doesn’t tend to migrate downward through sediment… Being less dense than rock and water, it migrates upward. That’s why oil and gas are almost always a lot older than the rock formations in which they are trapped. I do realize that the contemporaneous atmosphere will permeate down into the ice… But it seems to me that at depth, there would be a mixture of air permeating downward, in situ air, and older air that had migrated upward before the ice fully “lithified”.
A recent study (Van Hoof et al., 2005) demonstrated that the ice core CO2 data essentially represent a low-frequency, century to multi-century moving average of past atmospheric CO2 levels.

It appears that the ice core data represent a long-term, low-frequency moving average of the atmospheric CO2 concentration; while the stomata yield a high frequency component.
The stomata data routinely show that atmospheric CO2 levels were higher than the ice cores do. Plant stomata data from the previous interglacial (Eemian/Sangamonian) were higher than the ice cores indicate…

The GEOCARB data also suggest that ice core CO2 data are too low…

The average CO2 level of the Pleistocene ice cores is 36ppmv less than GEOCARB…

Recent satellite data (NASA AIRS) show that atmospheric CO2 levels in the polar regions are significantly less than in lower latitudes…


So… The ice core data should be yielding lower CO2 levels than the Mauna Loa Observatory and the plant stomata.
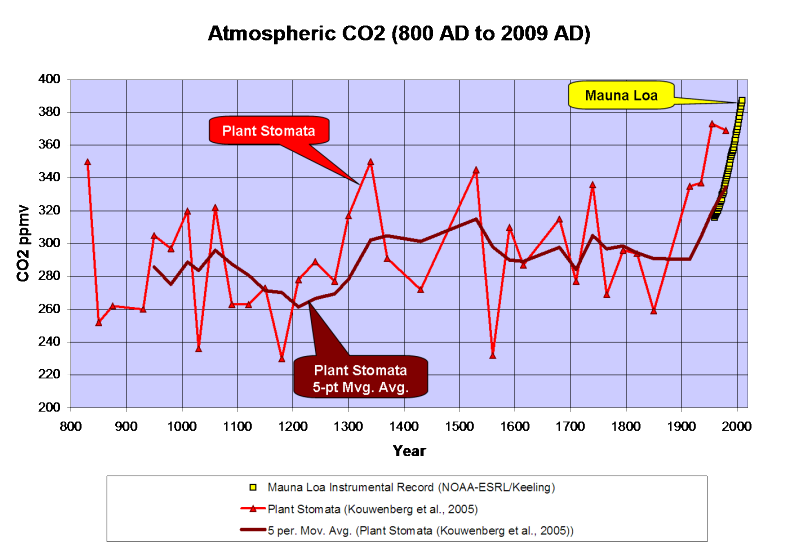
Kouwenberg et al., 2005 found that a “stomatal frequency record based on buried Tsuga heterophylla needles reveals significant centennial-scale atmospheric CO2 fluctuations during the last millennium.”
Plant stomata data show much greater variability of atmospheric CO2 over the last 1,000 years than the ice cores and that CO2 levels have often been between 300 and 340ppmv over the last millennium, including a 120ppmv rise from the late 12th Century through the mid 14th Century. The stomata data also indicate higher CO2 levels than the Mauna Loa instrumental record; but a 5-point moving average ties into the instrumental record quite nicely…

A survey of historical chemical analyses (Beck, 2007) shows even more variability in atmospheric CO2 levels than the plant stomata data since 1800…

WHAT DOES IT ALL MEAN?
The current “paradigm” says that atmospheric CO2 has risen from ~275ppmv to 388ppmv since the mid-1800’s as the result of fossil fuel combustion by humans. Increasing CO2 levels are supposedly warming the planet…

However, if we use Moberg’s (2005) non-Hockey Stick reconstruction, the correlation between CO2 and temperature changes a bit…

Moberg did a far better job in honoring the low frequency components of the climate signal. Reconstructions like these indicate a far more variable climate over the last 2,000 years than the “Hockey Sticks” do. Moberg also shows that the warm up from the Little Ice Age began in 1600, 260 years before CO2 levels started to rise.
As can be seen below, geologically consistent reconstructions like Moberg and Esper are in far better agreement with “direct” paleotemperature measurements, like Alley’s ice core reconstruction for Central Greenland…

In fairness to Dr. Mann, his 2008 reconstruction did restore the Medieval Warm Period and Little Ice Age to their proper places; but he still used Mike’s Nature Trick to slap a hockey stick blade onto the 20th century.
What happens if we use the plant stomata-derived CO2 instead of the ice core data?

We find that the ~250-year lag time is consistent. CO2 levels peaked 250 years after the Medieval Warm Period peaked and the Little Ice Age cooling began and CO2 bottomed out 240 years after the trough of the Little Ice Age. In a fashion similar to the glacial/interglacial lags in the ice cores, the plant stomata data indicate that CO2 has lagged behind temperature changes by about 250 years over the last millennium. The rise in CO2 that began in 1860 is most likely the result of warming oceans degassing.
While we don’t have a continuous stomata record over the Holocene, it does appear that a lag time was also present in the early Holocene…

Once dissolved in the deep-ocean, the residence time for carbon atoms can be more than 500 years. So, a 150- to 200-year lag time between the ~1,500-year climate cycle and oceanic CO2 degassing should come as little surprise.
CONCLUSIONS
-
Ice core data provide a low-frequency estimate of atmospheric CO2 variations of the glacial/interglacial cycles of the Pleistocene. However, the ice cores seriously underestimate the variability of interglacial CO2 levels.
-
GEOCARB shows that ice cores underestimate the long-term average Pleistocene CO2 level by 36ppmv.
-
Modern satellite data show that atmospheric CO2 levels in Antarctica are 20 to 30ppmv less than lower latitudes.
-
Plant stomata data show that ice cores do not resolve past decadal and century scale CO2 variations that were of comparable amplitude and frequency to the rise since 1860.
Thus it is concluded that:
-
CO2 levels from the Early Holocene through pre-industrial times were highly variable and not stable as the Antarctic ice cores suggest.
-
The carbon and climate cycles are coupled in a consistent manner from the Early Holocene to the present day.
-
The carbon cycle lags behind the climate cycle and thus does not drive the climate cycle.
-
The lag time is consistent with the hypothesis of a temperature-driven carbon cycle.
-
The anthropogenic contribution to the carbon cycle since 1860 is minimal and inconsequential.
Note: Unless otherwise indicated, all of the climate reconstructions used in this article are for the Northern Hemisphere.
References
Anklin, M., J. Schwander, B. Stauffer, J. Tschumi, A. Fuchs, J.M. Barnola, and D. Raynaud, CO2 record between 40 and 8 kyr BP from the GRIP ice core, Journal of Geophysical Research, 102 (C12), 26539-26545, 1997.
Wagner et al., 1999. Century-Scale Shifts in Early Holocene Atmospheric CO2 Concentration. Science 18 June 1999: Vol. 284. no. 5422, pp. 1971 – 1973.
Berner et al., 2001. GEOCARB III: A REVISED MODEL OF ATMOSPHERIC CO2 OVER PHANEROZOIC TIME. American Journal of Science, Vol. 301, February, 2001, P. 182–204.
Kouwenberg, 2004. APPLICATION OF CONIFER NEEDLES IN THE RECONSTRUCTION OF HOLOCENE CO2 LEVELS. PhD Thesis. Laboratory of Palaeobotany and Palynology, University of Utrecht.
Wagner et al., 2004. Reproducibility of Holocene atmospheric CO2 records based on stomatal frequency. Quaternary Science Reviews 23 (2004) 1947–1954.
Esper et al., 2005. Climate: past ranges and future changes. Quaternary Science Reviews 24 (2005) 2164–2166.
Kouwenberg et al., 2005. Atmospheric CO2 fluctuations during the last millennium reconstructed by stomatal frequency analysis of Tsuga heterophylla needles. GEOLOGY, January 2005.
Van Hoof et al., 2005. Atmospheric CO2 during the 13th century AD: reconciliation of data from ice core measurements and stomatal frequency analysis. Tellus (2005), 57B, 351–355.
Rundgren et al., 2005. Last interglacial atmospheric CO2 changes from stomatal index data and their relation to climate variations. Global and Planetary Change 49 (2005) 47–62.
Jessen et al., 2005. Abrupt climatic changes and an unstable transition into a late Holocene Thermal Decline: a multiproxy lacustrine record from southern Sweden. J. Quaternary Sci., Vol. 20(4) 349–362 (2005).
Beck, 2007. 180 Years of Atmospheric CO2 Gas Analysis by Chemical Methods. ENERGY & ENVIRONMENT. VOLUME 18 No. 2 2007.
Loulergue et al., 2007. New constraints on the gas age-ice age difference along the EPICA ice cores, 0–50 kyr. Clim. Past, 3, 527–540, 2007.
DATA SOURCES
CO2
Etheridge et al., 1998. Historical CO2 record derived from a spline fit (75 year cutoff) of the Law Dome DSS, DE08, and DE08-2 ice cores.
NOAA-ESRL / Keeling.
Berner, R.A. and Z. Kothavala, 2001. GEOCARB III: A Revised Model of Atmospheric CO2 over Phanerozoic Time, IGBP PAGES/World Data Center for Paleoclimatology Data Contribution Series # 2002-051. NOAA/NGDC Paleoclimatology Program, Boulder CO, USA.
Kouwenberg et al., 2005. Atmospheric CO2 fluctuations during the last millennium reconstructed by stomatal frequency analysis of Tsuga heterophylla needles. GEOLOGY, January 2005.
Lüthi, D., M. Le Floch, B. Bereiter, T. Blunier, J.-M. Barnola, U. Siegenthaler, D. Raynaud, J. Jouzel, H. Fischer, K. Kawamura, and T.F. Stocker. 2008. High-resolution carbon dioxide concentration record 650,000-800,000 years before present. Nature, Vol. 453, pp. 379-382, 15 May 2008. doi:10.1038/nature06949.
Royer, D.L. 2006. CO2-forced climate thresholds during the Phanerozoic. Geochimica et Cosmochimica Acta, Vol. 70, pp. 5665-5675. doi:10.1016/j.gca.2005.11.031.
TEMPERATURE RECONSTRUCTIONS
Moberg, A., et al. 2005. 2,000-Year Northern Hemisphere Temperature Reconstruction. IGBP PAGES/World Data Center for Paleoclimatology Data Contribution Series # 2005-019. NOAA/NGDC Paleoclimatology Program, Boulder CO, USA.
Esper, J., et al., 2003, Northern Hemisphere Extratropical Temperature Reconstruction, IGBP PAGES/World Data Center for Paleoclimatology Data Contribution Series # 2003-036. NOAA/NGDC Paleoclimatology Program, Boulder CO, USA.
Mann, M.E. and P.D. Jones, 2003, 2,000 Year Hemispheric Multi-proxy Temperature Reconstructions, IGBP PAGES/World Data Center for Paleoclimatology Data Contribution Series #2003-051. NOAA/NGDC Paleoclimatology Program, Boulder CO, USA.
Alley, R.B.. 2004. GISP2 Ice Core Temperature and Accumulation Data. IGBP PAGES/World Data Center for Paleoclimatology Data Contribution Series #2004-013. NOAA/NGDC Paleoclimatology Program, Boulder CO, USA.
VEIZER d18O% ISOTOPE DATA. 2004 Update.
Discover more from Watts Up With That?
Subscribe to get the latest posts sent to your email.
Bart—yes it looks negative on the quadratic (for the recent 2-4 years), but linear is still up…
Cohenite–“Sorry David, you are wrong; the rate of change of CO2 concentration as a % of the atmospheric total is declining. ”
I guess I need to go back and retake my graduate atmospheric radiation courses. And Even if knorr is right about the airborne fraction being stable, the amount of CO2 in the atmosphere is still going up, I don’t see that declining.
Joel Shore says:
“…I challenged you to present examples of AGW-doubting positions that you are skeptical of…” & blah, blah, etc.
FYI, it is the purveyors of the CAGW scare who have the onus of defending their positions. Projecting that onus onto skeptics is just alarmist semantics.
First off, you, like the rest of the alarmist contingent, completely ignore the scientific method. It is not the job of scientific skeptics to ‘present examples of AGW doubting positions.’ I am skeptical of the whole AGW scam. Not because there could not be some insignificant warming based on radiative physics, but because the whole scam is based on the demonization of a harmless and beneficial trace gas.
The Joel Shores of the world are most certainly not skeptical scientists — which are the only honest kind of scientist. You folks are simply true believers, or worse: you know the “carbon” scare is a scam, but you personally benefit from it in some way. I’m not a mind reader so I don’t know which it is with you, maybe a combination of the two. But you are no skeptical scientist.
For example, I am skeptical that the increase in CO2 has caused any measurable harm at all, while there is direct evidence that more CO2 is very beneficial. If you can convincingly show, through testable, reproducible evidence [not models] that the rise in CO2 has caused identifiable, provable “harm,” then I’m all ears.
With $7.5 billion being funneled into “climate” bogosity, there is ample motive to diddle with the results, which is exactly what the object of your adoration, in addition to the serial liar Michael Mann and his poodle Gavin Schmidt are doing. Maybe you can explain exactly how you are any different? Because you’re certainly no skeptic.
Dr. van Hoof,
I think your paper is kind of like the “Rosetta Stone” in regard to reconciling the stomata and ice core CO2. Having been a seismic interpreter in the oil industry for almost 30 years, I tend to look at things from a signal processing angle and I think that’s how the various climate “signals” should be analyzed.
Have you ever tried tying the stomata chronologies into CO2 data from any of the Greenland ice cores?
David says:
December 28, 2010 at 7:07 am
“Bart—yes it looks negative on the quadratic (for the recent 2-4 years), but linear is still up…”
As Doc Brown would admonish, you’re not thinking four dimensionally. Which term will dominate over time?
More importantly, yearly emissions in the last two decades, at a time when India and China, with a combined population of more than 1/3 of the planet, have been rapidly industrializing, show no such slackening.
I don’t think 4 dimensions…only Richard Feyman does that!
Bert, we just had a major global recession, and now we are in La Nina with cooler water temps (less co2), yet this last year 2010 shows a strong rise in CO2.
http://www.esrl.noaa.gov/gmd/webdata/ccgg/trends/co2_trend_gl.png
tonyb says:
It is not semantics at all. The person I was responding to was basically saying, “How can Hansen say that we’ll have a runaway greenhouse effect if we go above 450ppm? We’ve gone above that and the earth didn’t turn into Venus.” My answer was that Hansen didn’t make such a claim. He talked about tipping points involving land ice melting and the earth being a very different place but that does not contradict the fact that CO2 levels have been above 450 ppm before because, from what we can tell, during those times (particularly when they occurred most recently when we have the best data and the sun wasn’t significantly dimmer and the continents and mountain ranges were in about the same place), the world was indeed significantly different.
By the way, in regards Hansen’s predictions of what might really lead to a Venus runaway, I just skimmed through Hansen’s book in the bookstore today and have little to add to what I said earlier about what he had to say about that. cohenite is correct in saying that Hansen talked about the possibility that it could occur at a level as low as 1000ppm (although I don’t think he was saying that 1000ppm corresponds to 10 W/m^2 forcing exactly…unless he was including some additional forcings due to the other greenhouse gases).
cohenite says:
I don’t know why you brought the 450ppm back into it, since that is not what Hansen said.
Also, given your track-record in separating sense from nonsense (e.g., defending Gerlich and Tscheuschner in the past; referencing Beenstock and Reingewertz as a trustworthy analysis in this very thread), I don’t think you are exactly the best arbiter on the subject of what does and does not make sense. I stand by what I wrote, both the skepticism that I have about Hansen’s claims, as well as my unwillingness to dismiss them as wrong.
tonyb says:
You too! (meant to include that in my last post)
Bart says:
If you are really think that you can fit a quadratic over only 2 or 4 years of the data and draw a serious conclusion then you deserve whatever answer you get!
Smokey says:
Thank you for providing one of your typical demonstrations of my statement about “your M.O. of holding yourself to an abysmally-lower standard than you hold people whom you disagree with to.”
Does anybody out there notice how Smokey has turned the question around? I didn’t ask you to demonstrate your “skepticism” by telling us how you are skeptical of AGW. That’s easy for you to do! What I asked you to do is demonstrate you are truly skeptical by telling us which arguments of “climate change skeptics” you are skeptical about. It is strange that you call me a true believer and yet it is you who has been unable to demonstrate any deviation from believing what you want to believe. Talk about projection!!!!!!!
And, you have the easy task. I gave you an example of my being skeptical of something that James Hansen said, a scientist who has won incredible accolades from his scientific peers (awards from the AMS, AAAS, APS, and AGU). All you have to do is express some skepticism about some things out there that are not even being supported by any scientist who has a shred of a reputable publication record in the field! And, so far you have still been unwilling or unable to do it! Talk about a “true believer”!!!
So, I am trying to hold you to a much, much lower standard than I have held myself and yet so far you seem unable to even live up to that!
You claim Hansen is reliable?
Of “that” I claim skepticism!
(And that alone allows me to question your “reliance on (presumed) authority. Please note that at no previous time in scientific history has “reliance on authority – particularly when the “authority” in question has monetary, power, prestige, and reputation on the line! – has the authority figure been proved right.)
On a serious note, you challenge his skepticism by requiring him to challenge other authors? Why? On the other hand, there is NO scientific basis to believe Mann, Hansen, NOAA, NASA – GISS, HadCRU, etc.
GISP2 CO2 Data, anyone have the CO2 data? AFAIK, there are only bits and pieces released (all portions of glacial events, no interglacial samples somehow, unbelievably), and it should be released. If it is contaminated by volcanoes, these should be short term events, and can be low pass filtered, and the longer term averages evaluated. Not released you say? Let me guess, too high on average, regardless of volcanic activity? Someone has some splainin’ to do..
High res data from Vostok? Hmmmm…funny that. Vostok has roughly 10 data points in 10,000years, that’s some good quality data for a good qualitative discussion. My @ur momisugly!$#@ur momisugly*^(&! Is there a scientific reason for why we can’t have better resolution of CO2 data or IS this a coverup/setup and purposely created grey/fudge area? I would think we could at least get CO2 data in Vostok every 100yrs, which would provide 1000 data points, revealing at least 200yr cycles. Of course my preference would be 30yr data (or better) to get some clue as to the 60yr cycles or oceanic responses thereof, or at least nail the lead/lag question. We should be demanding quality data from these guys rather than arguing whether the crappy data supports or doesn’t support an interpretation. Maybe there is a valid reason, if so let me know, so I can at least feel I’m not getting conned by every tom dick and harry ( or at least fewer of them).
@ur momisugly David Middleton… well actually for the somewhat older stomata data ( I focussed on the past 1000 yrs but my colleages on the whole Holocene) there are Greenland iced-core records which match pretty well… However, we can’t use them for publictions as the ice community officially redrew them as soon as the Antarctic records became available.. they claimed the records are contaminated by too much dust in the ice….
Furthermore I want to mention that we fully understand there are uncertainties with the stomata data. what bothers me is that for our records the scientific community focusses on these uncertainties in exact prediction while all the flaws and errors in ice data are ignored… furthermore it is quite amusing for me as a biologist to read the papers where physicists try to attack the proxies by playing plant physiologist…. I am very surprised the scientific community does not have a very warm welcome for new innovative techniques when those techniques put question marks at established ideas.., I always learned that these discussions are the fundamental backbone for science… therefore my hope that climate science will ever become a fullgrown scientific discipline is lost as long as politics (read funding) keeps intermingling..
@tregembo
See Dr. van Hoof’s last comment. I’ve downloaded some of the bits & pieces of Greenland CO2 data in NOAA’s Paleoclimatology data base. The CH4 also has a higher amplitude than the Antarctic cores during warm periods and interstadials. If you read the Anklin paper, you’ll get the distinct impression that they rejected their own results primarily because they were counter-paradigm.
Sorry for the late reply, I am currently travelling in France, where I have no access to my files…
1DandyTroll says:
December 26, 2010 at 3:14 pm
@ferdinand meeus Engelbeen
‘CO2 levels are measured in “background” conditions at some 70+ places over the world + satellites.’
We only have 30 years of readings from the latest 30 years and since the sat readings don’t correlate to the down to earth readings on a 1:1 basis, there’s discrepancies to account for, and explain, to boot, and until such time who can say with enough certainty what’s what in that department.
We have over 50 years of direct data and a few years of satellite data, which are comparable to the local data near ground. Plus an overlap of some 20 years between ice core data (Law Dome) and South Pole direct data.
Take into account all the “70+” places, those doesn’t begin to cover the whole planet by even the most liberal statistical concoctions
CO2 levels are quite rapid mixed: within days to weeks for the same latitude/altitude. Within weeks to months for different latitudes/altitudes and about a year between the hemispheres. Even one station would be enough to represent the trend in global CO2.
Which is a problem of definition. The higher the definition the better it was supposed to get, but it didn’t did it? We can no more today with even higher definition than yesterday account for even a decades precision in any age, let alone ten years ago from today. So how can we be certain of the readings at all, really.
The resolution of the ice cores really is about a decade for the fastest accumulating ice cores. The ice at closing depth is about 40 years old, the average gas age at the same depth is about 10 years older than at the atmosphere. The (not important) ice age – gas age difference thus is 30 years. The diffusion rate was measured top-down in the firn. At closing depth the composition of air in still open bubbles and already closed bubbles was identical…
Katio1505 says:
December 26, 2010 at 3:19 pm
Just happen to be reading Solomon’s ‘The Deniers’ at the moment. He explains that it was only possible to get the nice splice between the Siple ice core data and the Mauna Loa data by shifting the former forward by 83 years. Did the Law Dome data have to be adjusted also?
This is nonsense, probably taken from Jaworowski: Jaworowski takes the ice age date from the Siple Dome ice core and compares that to the CO2 level of the atmosphere of the same age. But there is no CO2 in the ice! CO2 is in the gas phase, and that is much younger than the ice at the same depth. That was clearly visible in the report of Neftel for the Siple ice core: ice age and gas age are in adjacent columns in the same table.
That Jaworowski doesn’t (want to?) know the difference between ice age and gas age makes him quite unbelievable.
cohenite says:
December 26, 2010 at 4:26 pm
Drake reached a similar conclusion about the ice cores underestimated historical concentrations of CO2:
Drake does “adjust” the ice core CO2 levels for ice age – gas age differences. That has not the slightest physical meaning: ice layers and gas bubbles are independent of each other, except that the number of layers and the averaging of the air composition at closing depth both depend of the snow accumulation speed. Thus the error that Drake made is from the type:
A causes B
A causes C
that makes that there is a good correlation between B and C, even if there is no physical relationship between B and C. The correlation (and thus the correction) is completely spurious.
Berényi Péter says:
December 26, 2010 at 4:30 pm
Would you explain if difference between mean age of air and age of ice in the same layer is more than two thousand years in the Vostok ice core, how the resolution is supposed to be as good as 600 years?
That is because gas age – ice age difference and resolution have nothing to do with each other. The resolution depends of the diffusion speed of air through the pores, top – down through the different layers, as long as the pores are wide enough, the diffusion speed lowers with ice density, thus with depth. The ice age – gas age difference depends mainly on the accumulation speed (and on temperature), which gives the number of ice layers at closing depth. Thus ice age is directly dependent of accumulation speed, gas age and resolution only partly.
Floor Anthoni says:
December 26, 2010 at 6:03 pm
Engelbeen must be corrected here. The oceans contain 38000 Gt carbon and the atmosphere 700GtC. Henry’s law insists that about 1100GtC outgasses per ºC at 15ºC, which equates to over 600ppmC/ºC. Not 16ppmv/ºC as Engelbeen states.
Sorry, but you are wrong on this point: No matter how much CO2 is in the (deep) oceans, Henry’s Law is a matter of differential pressure between CO2 in the atmosphere and CO2 in the oceans. If the ocean surface (as a whole) increases with 1°C, then an increase of 16 ppmv (32 GtC) in the atmosphere is enough to compensate for the temperature increase, no matter how much CO2 resides in the upper or deep oceans…
Further, I have seen several errors in your pages, good for several corrections… To mention one: the oxygen use that you have calculated is based on what rests in the atmosphere, but should have been calculated on the full use of fossil fuels and not only 1:1 (for coal) but also 1:1.5 (oil) and 1:2 (natural gas)…
Note: I don’t know if I will have more time to respond, but I am back home tomorrow (late) night…
Tom van Hoof says:
December 28, 2010 at 6:48 am
The lone fact that stomata data of the USA and Europe have the same timing of a CO2 wiggle which has also been recorded (but with a much lower amplitude) in two Antarctic ice cores is evidence enough that Co2 variability has been larger in the past millennium then assumed.
Some comment on this:
In how far the higher variability (even more in the US than in Europe) of the stomata data is caused by local variability of CO2 levels (and other variables like drought, temperature,…) not reflected in global CO2 levels?
Ferdinand,
I think the only way to answer that question would be through the collection of a lot more Holocene stomata chronologies and building regional, hemispheric and global reconstructions.
Your question does beg the converse questions… “How much of the lower variability in the Antarctic ice cores is due to the lower resolution due to the low snow accumulation rates? How much of the lower variability is due to the relative meteorological isolation of Antarctica? How much of the lower variability is due to the effects of burial compaction?”
If the stomata data and Greenland ice cores are ignored or explained away, none of these questions can be answered.
Interesting accumulation of data but this is meaningless without showing the associated uncertainties.
Don’t feel alone , this now seems to be almost accepted practice in climate “science” !! A point Dr. Judith Curry had being trying to hammer home recently.
Even discussing the 36 ppm difference between the geocarb estimates and ice core data is pointless until you show the experimental uncertainty of those results.
36 ppm in 380 ppm is only around 10% . Do you really believe either method is accurate to within 10% ? Almost certainly not. And for the difference to be anything noteworthy each would have to be better than 5% for there even to be a disagreement in the results to discuss.
The CO2 hockey stick has the same problem as Mann’s temp hockey stick : plotting incompatible data on the same graph and ignoring the fact they are incompatible and then drawing false conclusions.
Mauna Lao is daily data, probably monthly smoothed here. Ice core data has a physical “smoothing” on the scale of centuries as you rightly point out. It has a much greater averaging in that the data points (in Vostok core) are generally thousands of years apart.
If the M.L data was smoothed on the same timescale the rise of the last 50 years would be tiny blip not a hockey stick. Or more likely the whole of the christian era would have been missed in between two successive data points.
Here is the beginning of the Vostok record:
Ice cores tell us nothing about the changes on a timescale comparable to the industrial period.
The available data is not able to prove or disprove that this is in anyway different or “unprecedented”. The whole discussion is totally without foundation.
The most significant thing to note is that in past epochs CO2 was TEN TIMES what it is today and the world did not blow up or evaporate into space. Life on Earth did not end.
I was incorrect to call that averaging. It is not , it is missing data.
This record is incredibly long and is useful for that reason but it is a false assumption to believe it is complete. When you have several kilometers of ice core you have take selective samples along it’s length. The gaps are huge.
So there is century scale smoothing due to gas diffusion in the snow and firn plus millenium scale gaps in the data.
This must be taken into account when trying to infer the magnitude of past variation.
@ur momisugly P. Solar
Those are excellent points. The inherent problems with tying together data sets with vastly different resolutions was one of the main points I was trying to make.
“Mike’s Nature Trick” is the perfect example of creating an anomaly by improperly combining high- and low-frequency data.
P. Solar says:
Vostok is a slowly-accumulating core and is thus good at providing lower frequency information that goes back far in time. However, there are other cores that have faster accumulation and provided considerably higher-frequency information. For example, here is the Taylor Law Dome data ftp://ftp.ncdc.noaa.gov/pub/data/paleo/icecore/antarctica/taylor/taylor_co2-holocene.txt , where they have about 1 data point every century. There may be others that are higher frequency than this.
If your criterion concerning whether or not a problem is important enough to take action is whether or not it will cause the world to blow up or evaporate into space, then there would be very few problems that we would need to concern ourselves with. For example, do you think terrorists flying planes into a few buildings is at all a danger to life on earth, let alone comparable to some events from geologic times such as major asteroid impacts? Even such terrorists getting their hands on a nuclear weapon is not going to come anywhere close to threatening life on earth. Despite these facts, I would certainly be surprised if you were to express the opinion that nothing should be done to try to prevent this from happening!
Yes, CO2 has been much higher in past epochs (although there are quite large error bars on the estimates of exactly how much higher CO2 levels were), but it is also true that climate and sea level were very different. Such changes may be something that we don’t want to impose on ourselves and the current flora and fauna adapted to the current climate, sea level, etc.
Finally, as I noted in posts above, the few scientists like Hansen who are really concerned about the possibility of a true Venus-like runaway if we really go to town burning our fossil fuel reserves have arguments why a runaway could happen this time even though it never did before. I am not claiming that these arguments are correct, but I don’t think you can just say, “It hasn’t happened before” and be done with it. Hansen understands that, but he also notes ways in which the current situation may not really have a previous precedent.
Bart says:
December 26, 2010 at 7:47 pm
No. They aren’t. The increase in CO2 concentration bears only a superficial resemblance to the human production of CO2. The two series correlate poorly in the low frequency regime, and not to any level of significance at all in the higher frequency realm.
Just back from a few days in Paris…
Well you are completely wrong on this. The correlation between the accumulated emissions and the accumulation in the atmosphere is a near perfect fit for the past 100+ years:
http://www.ferdinand-engelbeen.be/klimaat/klim_img/acc_co2_1900_2004.jpg
Or in direct comparison with temperature (as the late Endersbee suggested):
http://www.ferdinand-engelbeen.be/klimaat/klim_img/temp_co2_acc_31.jpg
Of course if you look only at the derivative (the year by year increase), you remove the trend and only look at the variability around the trend, which is mainly caused by the variability in temperature. But even then, the emissions are twice the average increase in the atmosphere and the variability is about +/- 1.5 ppmv for 4 ppmv/year emissions and 2 ppmv/year increase:
http://www.ferdinand-engelbeen.be/klimaat/klim_img/dco2_em.jpg