Guest post by David Middleton
INTRODUCTION
Anyone who has spent any amount of time reviewing climate science literature has probably seen variations of the following chart…

A record of atmospheric CO2 over the last 1,000 years constructed from Antarctic ice cores and the modern instrumental data from the Mauna Loa Observatory suggest that the pre-industrial atmospheric CO2 concentration was a relatively stable ~275ppmv up until the mid 19th Century. Since then, CO2 levels have been climbing rapidly to levels that are often described as unprecedented in the last several hundred thousand to several million years.
Ice core CO2 data are great. Ice cores can yield continuous CO2 records from as far back as 800,000 years ago right on up to the 1970’s. The ice cores also form one of the pillars of Warmista Junk Science: A stable pre-industrial atmospheric CO2 level of ~275 ppmv. The Antarctic ice core-derived CO2 estimates are inconsistent with just about every other method of measuring pre-industrial CO2 levels.
Three common ways to estimate pre-industrial atmospheric CO2 concentrations (before instrumental records began in 1959) are:
1) Measuring CO2 content in air bubbles trapped in ice cores.
2) Measuring the density of stomata in plants.
3) GEOCARB (Berner et al., 1991, 1999, 2004): A geological model for the evolution of atmospheric CO2 over the Phanerozoic Eon. This model is derived from “geological, geochemical, biological, and climatological data.” The main drivers being tectonic activity, organic matter burial and continental rock weathering.
ICE CORES
The advantage of Antarctic ice cores is that they can provide a continuous record of relative CO2 changes going back in time 800,000 years, with a resolution ranging from annual in the shallow section to multi-decadal in the deeper section. Pleistocene-age ice core records seem to indicate a strong correlation between CO2 and temperature; although the delta-CO2 lags behind the delta-T by an average of 800 years… 
Ice cores from Greenland are rarely used in CO2 reconstructions. The maximum usable Greenland record only dates as far back as ~130,000 years ago (Eemian/Sangamonian); the deeper ice has been deformed. The Greenland ice cores do tend to have a higher resolution than the Antarctic cores because there is a higher snow accumulation rate in Greenland. Funny thing about the Greenland cores: They show much higher CO2 levels (330-350 ppmv) during Holocene warm periods and Pleistocene interstadials. The Dye 3 ice core shows an average CO2 level of 331 ppmv (+/-17) during the Preboreal Oscillation (~11,500 years ago). These higher CO2 levels have been explained away as being the result of in situ chemical reactions (Anklin et al., 1997).
PLANT STOMATA
Stomata are microscopic pores found in leaves and the stem epidermis of plants. They are used for gas exchange. The stomatal density in some C3 plants will vary inversely with the concentration of atmospheric CO2. Stomatal density can be empirically tested and calibrated to CO2 changes over the last 60 years in living plants. The advantage to the stomatal data is that the relationship of the Stomatal Index and atmospheric CO2 can be empirically demonstrated…

When stomata-derived CO2 (red) is compared to ice core-derived CO2 (blue), the stomata generally show much more variability in the atmospheric CO2 level and often show levels much higher than the ice cores…

Plant stomata suggest that the pre-industrial CO2 levels were commonly in the 360 to 390ppmv range.
GEOCARB
GEOCARB provides a continuous long-term record of atmospheric CO2 changes; but it is a very low-frequency record…

The lack of a long-term correlation between CO2 and temperature is very apparent when GEOCARB is compared to Veizer’s d18O-derived Phanerozoic temperature reconstruction. As can be seen in the figure above, plant stomata indicate a much greater range of CO2 variability; but are in general agreement with the lower frequency GEOCARB model.
DISCUSSION
Ice cores and GEOCARB provide continuous long-term records; while plant stomata records are discontinuous and limited to fossil stomata that can be accurately aged and calibrated to extant plant taxa. GEOCARB yields a very low frequency record, ice cores have better resolution and stomata can yield very high frequency data. Modern CO2 levels are unspectacular according to GEOCARB, unprecedented according to the ice cores and not anomalous according to plant stomata. So which method provides the most accurate reconstruction of past atmospheric CO2?
The problems with the ice core data are 1) the air-age vs. ice-age delta and 2) the effects of burial depth on gas concentrations.
The age of the layers of ice can be fairly easily and accurately determined. The age of the air trapped in the ice is not so easily or accurately determined. Currently the most common method for aging the air is through the use of “firn densification models” (FDM). Firn is more dense than snow; but less dense than ice. As the layers of snow and ice are buried, they are compressed into firn and then ice. The depth at which the pore space in the firn closes off and traps gas can vary greatly… So the delta between the age of the ice and the ago of the air can vary from as little as 30 years to more than 2,000 years.
The EPICA C core has a delta of over 2,000 years. The pores don’t close off until a depth of 99 m, where the ice is 2,424 years old. According to the firn densification model, last year’s air is trapped at that depth in ice that was deposited over 2,000 years ago.
I have a lot of doubts about the accuracy of the FDM method. I somehow doubt that the air at a depth of 99 meters is last year’s air. Gas doesn’t tend to migrate downward through sediment… Being less dense than rock and water, it migrates upward. That’s why oil and gas are almost always a lot older than the rock formations in which they are trapped. I do realize that the contemporaneous atmosphere will permeate down into the ice… But it seems to me that at depth, there would be a mixture of air permeating downward, in situ air, and older air that had migrated upward before the ice fully “lithified”.
A recent study (Van Hoof et al., 2005) demonstrated that the ice core CO2 data essentially represent a low-frequency, century to multi-century moving average of past atmospheric CO2 levels.

It appears that the ice core data represent a long-term, low-frequency moving average of the atmospheric CO2 concentration; while the stomata yield a high frequency component.
The stomata data routinely show that atmospheric CO2 levels were higher than the ice cores do. Plant stomata data from the previous interglacial (Eemian/Sangamonian) were higher than the ice cores indicate…

The GEOCARB data also suggest that ice core CO2 data are too low…

The average CO2 level of the Pleistocene ice cores is 36ppmv less than GEOCARB…

Recent satellite data (NASA AIRS) show that atmospheric CO2 levels in the polar regions are significantly less than in lower latitudes…


So… The ice core data should be yielding lower CO2 levels than the Mauna Loa Observatory and the plant stomata.
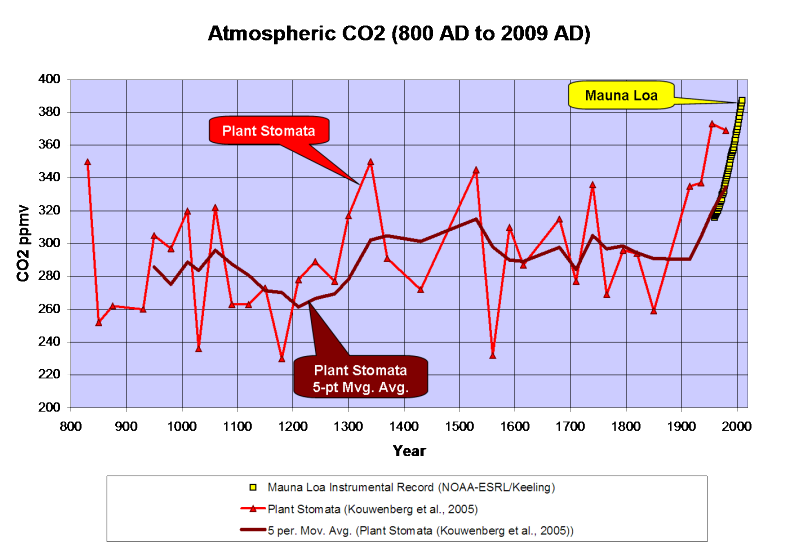
Kouwenberg et al., 2005 found that a “stomatal frequency record based on buried Tsuga heterophylla needles reveals significant centennial-scale atmospheric CO2 fluctuations during the last millennium.”
Plant stomata data show much greater variability of atmospheric CO2 over the last 1,000 years than the ice cores and that CO2 levels have often been between 300 and 340ppmv over the last millennium, including a 120ppmv rise from the late 12th Century through the mid 14th Century. The stomata data also indicate higher CO2 levels than the Mauna Loa instrumental record; but a 5-point moving average ties into the instrumental record quite nicely…

A survey of historical chemical analyses (Beck, 2007) shows even more variability in atmospheric CO2 levels than the plant stomata data since 1800…

WHAT DOES IT ALL MEAN?
The current “paradigm” says that atmospheric CO2 has risen from ~275ppmv to 388ppmv since the mid-1800’s as the result of fossil fuel combustion by humans. Increasing CO2 levels are supposedly warming the planet…

However, if we use Moberg’s (2005) non-Hockey Stick reconstruction, the correlation between CO2 and temperature changes a bit…

Moberg did a far better job in honoring the low frequency components of the climate signal. Reconstructions like these indicate a far more variable climate over the last 2,000 years than the “Hockey Sticks” do. Moberg also shows that the warm up from the Little Ice Age began in 1600, 260 years before CO2 levels started to rise.
As can be seen below, geologically consistent reconstructions like Moberg and Esper are in far better agreement with “direct” paleotemperature measurements, like Alley’s ice core reconstruction for Central Greenland…

In fairness to Dr. Mann, his 2008 reconstruction did restore the Medieval Warm Period and Little Ice Age to their proper places; but he still used Mike’s Nature Trick to slap a hockey stick blade onto the 20th century.
What happens if we use the plant stomata-derived CO2 instead of the ice core data?

We find that the ~250-year lag time is consistent. CO2 levels peaked 250 years after the Medieval Warm Period peaked and the Little Ice Age cooling began and CO2 bottomed out 240 years after the trough of the Little Ice Age. In a fashion similar to the glacial/interglacial lags in the ice cores, the plant stomata data indicate that CO2 has lagged behind temperature changes by about 250 years over the last millennium. The rise in CO2 that began in 1860 is most likely the result of warming oceans degassing.
While we don’t have a continuous stomata record over the Holocene, it does appear that a lag time was also present in the early Holocene…

Once dissolved in the deep-ocean, the residence time for carbon atoms can be more than 500 years. So, a 150- to 200-year lag time between the ~1,500-year climate cycle and oceanic CO2 degassing should come as little surprise.
CONCLUSIONS
-
Ice core data provide a low-frequency estimate of atmospheric CO2 variations of the glacial/interglacial cycles of the Pleistocene. However, the ice cores seriously underestimate the variability of interglacial CO2 levels.
-
GEOCARB shows that ice cores underestimate the long-term average Pleistocene CO2 level by 36ppmv.
-
Modern satellite data show that atmospheric CO2 levels in Antarctica are 20 to 30ppmv less than lower latitudes.
-
Plant stomata data show that ice cores do not resolve past decadal and century scale CO2 variations that were of comparable amplitude and frequency to the rise since 1860.
Thus it is concluded that:
-
CO2 levels from the Early Holocene through pre-industrial times were highly variable and not stable as the Antarctic ice cores suggest.
-
The carbon and climate cycles are coupled in a consistent manner from the Early Holocene to the present day.
-
The carbon cycle lags behind the climate cycle and thus does not drive the climate cycle.
-
The lag time is consistent with the hypothesis of a temperature-driven carbon cycle.
-
The anthropogenic contribution to the carbon cycle since 1860 is minimal and inconsequential.
Note: Unless otherwise indicated, all of the climate reconstructions used in this article are for the Northern Hemisphere.
References
Anklin, M., J. Schwander, B. Stauffer, J. Tschumi, A. Fuchs, J.M. Barnola, and D. Raynaud, CO2 record between 40 and 8 kyr BP from the GRIP ice core, Journal of Geophysical Research, 102 (C12), 26539-26545, 1997.
Wagner et al., 1999. Century-Scale Shifts in Early Holocene Atmospheric CO2 Concentration. Science 18 June 1999: Vol. 284. no. 5422, pp. 1971 – 1973.
Berner et al., 2001. GEOCARB III: A REVISED MODEL OF ATMOSPHERIC CO2 OVER PHANEROZOIC TIME. American Journal of Science, Vol. 301, February, 2001, P. 182–204.
Kouwenberg, 2004. APPLICATION OF CONIFER NEEDLES IN THE RECONSTRUCTION OF HOLOCENE CO2 LEVELS. PhD Thesis. Laboratory of Palaeobotany and Palynology, University of Utrecht.
Wagner et al., 2004. Reproducibility of Holocene atmospheric CO2 records based on stomatal frequency. Quaternary Science Reviews 23 (2004) 1947–1954.
Esper et al., 2005. Climate: past ranges and future changes. Quaternary Science Reviews 24 (2005) 2164–2166.
Kouwenberg et al., 2005. Atmospheric CO2 fluctuations during the last millennium reconstructed by stomatal frequency analysis of Tsuga heterophylla needles. GEOLOGY, January 2005.
Van Hoof et al., 2005. Atmospheric CO2 during the 13th century AD: reconciliation of data from ice core measurements and stomatal frequency analysis. Tellus (2005), 57B, 351–355.
Rundgren et al., 2005. Last interglacial atmospheric CO2 changes from stomatal index data and their relation to climate variations. Global and Planetary Change 49 (2005) 47–62.
Jessen et al., 2005. Abrupt climatic changes and an unstable transition into a late Holocene Thermal Decline: a multiproxy lacustrine record from southern Sweden. J. Quaternary Sci., Vol. 20(4) 349–362 (2005).
Beck, 2007. 180 Years of Atmospheric CO2 Gas Analysis by Chemical Methods. ENERGY & ENVIRONMENT. VOLUME 18 No. 2 2007.
Loulergue et al., 2007. New constraints on the gas age-ice age difference along the EPICA ice cores, 0–50 kyr. Clim. Past, 3, 527–540, 2007.
DATA SOURCES
CO2
Etheridge et al., 1998. Historical CO2 record derived from a spline fit (75 year cutoff) of the Law Dome DSS, DE08, and DE08-2 ice cores.
NOAA-ESRL / Keeling.
Berner, R.A. and Z. Kothavala, 2001. GEOCARB III: A Revised Model of Atmospheric CO2 over Phanerozoic Time, IGBP PAGES/World Data Center for Paleoclimatology Data Contribution Series # 2002-051. NOAA/NGDC Paleoclimatology Program, Boulder CO, USA.
Kouwenberg et al., 2005. Atmospheric CO2 fluctuations during the last millennium reconstructed by stomatal frequency analysis of Tsuga heterophylla needles. GEOLOGY, January 2005.
Lüthi, D., M. Le Floch, B. Bereiter, T. Blunier, J.-M. Barnola, U. Siegenthaler, D. Raynaud, J. Jouzel, H. Fischer, K. Kawamura, and T.F. Stocker. 2008. High-resolution carbon dioxide concentration record 650,000-800,000 years before present. Nature, Vol. 453, pp. 379-382, 15 May 2008. doi:10.1038/nature06949.
Royer, D.L. 2006. CO2-forced climate thresholds during the Phanerozoic. Geochimica et Cosmochimica Acta, Vol. 70, pp. 5665-5675. doi:10.1016/j.gca.2005.11.031.
TEMPERATURE RECONSTRUCTIONS
Moberg, A., et al. 2005. 2,000-Year Northern Hemisphere Temperature Reconstruction. IGBP PAGES/World Data Center for Paleoclimatology Data Contribution Series # 2005-019. NOAA/NGDC Paleoclimatology Program, Boulder CO, USA.
Esper, J., et al., 2003, Northern Hemisphere Extratropical Temperature Reconstruction, IGBP PAGES/World Data Center for Paleoclimatology Data Contribution Series # 2003-036. NOAA/NGDC Paleoclimatology Program, Boulder CO, USA.
Mann, M.E. and P.D. Jones, 2003, 2,000 Year Hemispheric Multi-proxy Temperature Reconstructions, IGBP PAGES/World Data Center for Paleoclimatology Data Contribution Series #2003-051. NOAA/NGDC Paleoclimatology Program, Boulder CO, USA.
Alley, R.B.. 2004. GISP2 Ice Core Temperature and Accumulation Data. IGBP PAGES/World Data Center for Paleoclimatology Data Contribution Series #2004-013. NOAA/NGDC Paleoclimatology Program, Boulder CO, USA.
VEIZER d18O% ISOTOPE DATA. 2004 Update.
With the CO2 in ice cores so uncertain what is then with the oft repeated statement that CO2 lags temperatures by 800 years? It would seem that that now is not on firm ground.
Leif Svalgaard says:
December 26, 2010 at 6:37 pm
“With the CO2 in ice cores so uncertain what is then with the oft repeated statement that CO2 lags temperatures by 800 years?”
Nobody is saying the ice core data are meaningless. But, the record is clearly a severely low pass filtered version of the truth. It records the long term behavior, but its information on shorter term variations is strongly attenuated. If the infant field of climate science had a better handle on these well established signal processing concepts, we would not have been dragged through this wasteful and degrading contretemps for the last two decades.
What a pleasure to read a detailed, logical and well researched piece of work. There are so many interesting and accurate points made in it. I hope that you can get it before some politicians who can both read and understand it to alter their obsession with the simplistic AGW agenda,
Nicholas Tesdorf
It seems to me that the stomata data is more interesting than F. Englebeen makes it out to be.
On the one hand the IPCC contends that the warming of the last century is primarily anthropogenic, with CO2 as the cause. Leif and others tell us it’s not the sun. Meanwhile nobody but nobody seems to be able to explain the MWP warmth nor the LIA coldness. CO2 was constant, according to the ice cores, yet the temp varied. Well, then, how can that be? I thought temp went up due to CO2.
OK, so let’s take the IPCC at its word. Temps went up and it’s our fault. In which case there’s no explanation re the MWP and the LIA. There either *IS* a relationship between temp and CO2 or there is not. It’s not “oh, well, back then it was other (unspecified!) stuff but THIS TIME, it’s CO2.” A relationship is a relationship. That means we ought to be able to see increased CO2 during the MWP and decreased CO2 during the LIA.
The much regarded ice cores don’t show this. OK, no relationship then.
But wait! Look closer at the stomata data, which apparently is non-scientific local conditions only stuff, and hey, guess what: there’s a relationship between CO2 and temp after all.
Seems to me that the AGW advocates ought to be all over this because if true then it establishes that the CO2-temp link did and does exist.
The anthropogenic contribution to the carbon cycle since 1860 is minimal and inconsequential.
Sorry David but this is incorrect. CO2 rising from 1860 until now is from human consumption of fossil fuels. 1 gallon of gasoline produces about 20 pounds of CO2. Humans are the reason why CO2 keeps creeping up (27 billion tons a year of CO2 released into the atmosphere).
Bart says:
Exactly! Why is it not obvious to all scientists that CO2 levels before 1959 danced around wildly before 1960, but in a very careful choreographed manner so that the level remained within about 10ppm when effectively low-pass filtered in the ice core data?
Of course, this “dancing around” magically stopped around 1960 when we started measuring it directly and it instead decided to just slowly increase in a manner that mimicks almost perfectly the rise that would be produced if a quite constant fraction of about 50% of what we were producing by burning fossil fuels remained in the atmosphere while the rest was fairly rapidly partitioned into the biosphere and ocean mixed layer.
David,
Do you have any real world, testable evidence showing that increased CO2 has caused damage? Or that it is harmful in any way?
So far, all the available evidence points to the conclusion that increased CO2 is harmless and beneficial.
Bart says:
December 26, 2010 at 7:10 pm
“With the CO2 in ice cores so uncertain what is then with the oft repeated statement that CO2 lags temperatures by 800 years?”
Nobody is saying the ice core data are meaningless. But, the record is clearly a severely low pass filtered version of the truth.
I agree and can accept this, but then we should stop claiming that the ice cores prove that there is an 800 year lag.
David says:
December 26, 2010 at 7:27 pm
“Humans are the reason why CO2 keeps creeping up (27 billion tons a year of CO2 released into the atmosphere).”
No. They aren’t. The increase in CO2 concentration bears only a superficial resemblance to the human production of CO2. The two series correlate poorly in the low frequency regime, and not to any level of significance at all in the higher frequency realm. The natural sequestering of carbon provides a negative feedback which, absent a much larger forcing than anthropogenic CO2, regulates atmospheric CO2 in a narrow band. Indeed, atmospheric concentrations have been decelerating for the last decade, even as human production has increased. Humankind has been convicted in this regard on a post hoc ergo propter hoc basis. In time, it will be exonerated.
Good work. It is about time we geos. took the discussion back from the numeric modelers and ideologist.
G.L. Alston:
“If A then B” does not logically-imply “if B then A”. Temperature changes due to changes in the radiative balance of the earth, which we call “radiative forcings”. Right now, the primary radiative forcings are the rapidly rising CO2 levels (along with other greenhouse gases and aerosol levels). However, in the past, there have been other important radiative forcings. (For the LIA and MWP, it is generally believed to be some combination of solar variations and variations in volcanic forcings…due to variations in the frequency of significant eruptions, although the fact that the global temperature changes were fairly small and the forcings are uncertain to sufficient accuracy during these times, it is hard to pin it down very precisely.) Over timescales of many thousand of years (i.e., glacial -interglacial cycles), variations in the earth’s orbit become significant; these variations do not produce a very significant forcing on a global level but they do produce significant variations in the seasonal and latitudinal distribution of solar insolation which then produce significant radiative feedbacks due the growth and decay of ice sheets and the variation in greenhouse gases in the atmosphere.
John F. Hultquist says:
December 26, 2010 at 11:33 am
Thanks, John, for your comment. Indeed, before I my comment posting, I took one graph and reversed it horizontally in order to visualize the 800 thousand years of measurements. The cycle appears to be a slow cooling and rapid temperature increase. And of course, as you state, the words are backwards which presents a smaller challenge to me than comparing separate diagrams and reversing one diagram in my mind.
I should also add that I prefer time to move from left to right on the x-axis. I would like the authors who start at the present and move into the past from left to right to go the other way.
Plant stomata data appears to me to be nearly as suspect as ice core data for a yard stick for past atmospheric data CO2. Far too many assumptions as to the validity of the science. Kind of like the science of CO2 caused run away global warming.
PNS is the science of faking the assumptions in the questions so you can get the result you want. Just like the ” science ” question in school that poses the Tree falling in the primal woods that has no listener. Is there sound? A philosophy question that is presented as science. But is mainly to prove that normal people are too stupid to really understand science.
No one has proved to me that 0.03% CO2 can cause any measurable warming and that such warming might be bad for man or animal. I do know for sure that increased CO2 results in greater plant growth and better efficiencies in the use of water and fertilizers. I further know that cooling is deadly to all life. pg
David, here’s some food for thought……
http://www.omafra.gov.on.ca/english/crops/facts/00-077.htm
“Carbon dioxide (CO2) is an essential component of photosynthesis (also called carbon assimilation). Photosynthesis is a chemical process that uses light energy to convert CO2 and water into sugars in green plants. These sugars are then used for growth within the plant, through respiration. The difference between the rate of photosynthesis and the rate of respiration is the basis for dry-matter accumulation (growth) in the plant. In greenhouse production the aim of all growers is to increase dry-matter content and economically optimize crop yield. CO2 increases productivity through improved plant growth and vigour. Some ways in which productivity is increased by CO2 include earlier flowering, higher fruit yields, reduced bud abortion in roses, improved stem strength and flower size.
Growers should regard CO2 as a nutrient.
For the majority of greenhouse crops, net photosynthesis increases as CO2 levels increase from 340–1,000 ppm (parts per million).
Most crops show that for any given level of photosynthetically active radiation (PAR), increasing the CO2 level to 1,000 ppm will increase the photosynthesis by about 50% over ambient CO2 levels.”
(my snip to a bit further down)
“To provide a guideline for CO2 addition, a theoretical calculation is given below for a glass house of 100 m2, with a growing crop, on a day with average light intensity. In this calculation, a level of 1,000 ppm CO2 will be supplemented to maintain 1,300 ppm during the day.
Normally CO2 supplementation is not required at night as no photosynthesis occurs. Actually, the CO2 concentration will tend to build up naturally as a result of plant respiration. Therefore, it is not uncommon to find elevated levels (500–600 ppm) early in the morning. Growers using high-pressure sodium lighting during the night should maintain at least 400 ppm of CO2.”
Joel Shore says:
December 26, 2010 at 12:13 pm
they tell you what you want to believe even though there is no good explanation of what could possibly cause such rapid variations in CO2 levels in the past.
I hope skeptics do not fall into the same trap the AGW proponents have, that of following beliefs and ignoring data.
One of the data ignored is that CO2 is a gas. Gas is transported by air. Air means winds. So, even though I do not know what caused the variations in CO2 levels in Becks compilations, I can treat CO2 levels as long term proxies of wind directions. This means that I would have to go where the measurements are done and verify the wind records.
Winds are persistent over decades and change over decades too. I live in Greece and though we have periodic winds called “meltemia” coming from the north in the summer, the past ten years they are mostly missing. We are getting westerly winds and southern ones. North is a great source of green, and CO2. South is the Sahara and water, west is the industrial west.
There were forest fires in Russia this year. We would have gotten lots of CO2 if the meltemia had worked, which they didn;t.I expect if we measured CO2 this decade chemically we would see large variations from the previous decade.
Then there are volcanoes , land and undersea. Their time constants are in decades, and certainly not constant over millenia.
These are hypothesis to be checked and viable until refuted but one cannot make the blanket statement “CO2 cannot change fast”.
Tim Folkerts says:
December 26, 2010 at 12:24 pm
Do your truly think that the concentrations changed that dramatically over such a short time, and if so, what might have caused this change?
see my arguments above.
Has there been any high resolution CO2 data from Vostok released? The last version I have has roughly 8-10 datapoints for the whole interglacial! Not much can be derived from that, other than a very averaged value. GISP2 is hurting too, they haven’t released complete CO2 data, only partial as the data values were too high to be considered valid (presumably dust contaminated), though the values I’ve seen were 300ppm during glacial periods, no data for the interglacial at all. If anyone has seen any high res from Vostok (during this interglacial), or anything from GISP2, I’d love to see it. Always thought it curious that they would collect high res temp, but not high res CO2.
I’d contend that they are hiding inconvenient data…re high freq resolution CO2 vs temp. Otherwise where is the GISP2 CO2 data, and why the low res Vostok data. They did pretty good with the sampling rate during the previous interglacial, but somehow the sampling rate drops for this interglacial? WUWT? I would think it would be rather important to increase the samplig rate during this interglacial…just saying…something smells.
Leif Svalgaard says:
December 26, 2010 at 7:46 pm
“I agree and can accept this, but then we should stop claiming that the ice cores prove that there is an 800 year lag.”
I agree that we do not know anything to that level of precision. I will even allow that it is possible that the CO2 rise could have preceded the temperature rise, and the 800 year gap is merely the phase delay of the effective measurement filter.
But, this is one of those subtle areas in which what people think is intuitively obvious is diametrically opposed to reality. E.g., many people assume that a lagging CO2 proves that CO2 cannot drive temperature. But, it does not prove that at all. It merely suggests that, in whatever process was going on at that time, temperature was driving CO2.
More importantly I think, in most skeptics’ minds, it simply proves Al Gore had no inkling of what he was talking about. But, that’s hardly news anymore.
However, it would actually be bad for CAGW if the CO2 were seen to have driven the temperature, because then the advocates would lose the supporting claim that what we are seeing now is unprecedented. Then, it could just be said, “look, every so often the Earth burps, and temperatures rise. It’s happened before, and it has nothing to do with us.”
Oh, snap! These pesky facts spoil the whole, wonderful theory of AGW!
Can we hide the decline, please? Thus, I would feel a lot warmer while removing the freshly fallen, foot-high blanket of wonderful, white Global Warming from my doorstep.
I want my Anthropogenic Global Warming back!
This is without a doubt one of the most readable and well thought out posts in a long time. I’m especially grateful for the readability, because I’m a layman and not a scientist.
One thing that does leap out at me, however, especially from the comments, is just how dicey it is to rely on just about anything as an accurate proxy, whether it’s ice cores, stomata, tree rings, or whatever. Is there any way to make this less problematic?
One more thing: Pamela Gray, I generally appreciate your tart and pertinent comments. However, your lapse into Malthusianism above sounds a bit like it came from the People’s Republic of Corvallis, hardly from Wallowa. To dispel those thoughts, I have just two words: Norman Borlaug. 😉 I send you greetings from Moscow on the Willamette, home of the mighty Fighting Ducks!
Kind regards to all . . . .
People should have a look at the GOSAT data too, discussehere before .
and also their more recent publication here.
There are over 30ppm variations in column averaged CO2.
What surprises me in these plots is that though we see the variation with seasons in the northern and southern hemisphere, there is continuous large input from Africa. Even the Sahara. This must mean that hot soil also exudes CO2, not just the oceans, something I have seen only in passing and not seriously considered. Thus it is not only the oceans that theoretically contribute excess CO2 as they are heated ( in these plots that effect is not measurable, oceans are mostly white). Also the colors show that the land location is more important in the level of CO2 exuded than the industrial concentrations.
It upsets the CO2 apple cart, in my opinion.
There is a correlation between the atmospheric CO2 concentration and human fossil fuel use but it seems to me, not a happy one.
The IPCC state:
“Most [over 50%] of the observed increase in global average temperatures since the mid-20th century is very likely [over 90% likelihood] due to the observed increase in anthropogenic greenhouse gas concentrations.” (AR4).
Elsewhere in AR4, they state:
“Carbon dioxide, methane, and nitrous oxide have increased markedly as a result of human activities since 1750 and now far exceed pre-industrial values” and “The primary source of the increase in carbon dioxide is fossil fuel use, but land-use changes also make a contribution”.
Emissions from fossil fuel use were an insignificant factor before c. 1945….
http://cdiac.ornl.gov/trends/emis/graphics/global_ff_1751_2006.jpg
….so their first statement is at least plausible.
But it is inconsistent to implicate human GHG emissions in the (alleged) rise from ~280 ppm. in 1750 to ~310 ppm. in 1945…..
http://i90.photobucket.com/albums/k247/dhm1353/Climate%20Change/LawDomeMLO-1.png
……likewise any global temperature rise prior to c. 1945…
http://www.global-warming-and-the-climate.com/images/Manns-hockey-stick.gif
…….(just an ugly reminder).
If we for a second step back from details and look at it logically Temp vs. CO2, just what this high correlation between the two can mean.
CO2 and Temperature seem to be highly correlated through millenia. Even more than that, they nearly match movement to eachother. There were great variations in Earth’s temperature through millenia and CO2 ALWAYS tracked it closely. That much we know for a fact afaik.
If this is not coincidence, then one of two statements is true.
1. Amount of CO2 is the only determining factor of Earth’s temperature. Sun’s activity, volcanos, cloud cover, sea currents, … have or may not have an effect, they influenced temperature at some point or other, but based on nearly perfect Temp to CO2 correlation through millenia, I conclude CO2 is the ONLY factor of all the variables that actually matter for earth’s temperature.
2. Amount of CO2 is the result of Earth’s temperature. There are countless variables that define Earth’s thermodynamics and thus temperature such as sun’s activity, volcanos, cloud cover, sea currents,… but the amount of CO2 in the air reacts to the variable of temperature and just follows it closely.
Hope i was clear in what i wanted to say. Personally i find it a bit funny if CO2 was the ONLY determining factor in what variations in the temperature of Earth will be. And i find it highly probable that CO2 simply mirrors Earth’s temperature. But that’s just me.
Regards,
Sasha
Sasha says: “There were great variations in Earth’s temperature through millenia and CO2 ALWAYS tracked it closely. That much we know for a fact afaik.”
That is not correct:
http://icecap.us/images/uploads/CO2,Temperaturesandiceages-f.pdf
And over the 20thC the r2 relationship between movements of CO2 and temperature is 0.42, less than the probability of a coin toss. This is as you would expect since temperature is almost completely stochastic, a random walk, whereas CO2 increases have been much more regular.
Excellent post!
But what is taking place with the images? I would like to unleash a Czech discussion on it. The graphs disappear irregularly in inscrutable pattern. They are like the very climate.