Guest post by David Middleton
INTRODUCTION
Anyone who has spent any amount of time reviewing climate science literature has probably seen variations of the following chart…

A record of atmospheric CO2 over the last 1,000 years constructed from Antarctic ice cores and the modern instrumental data from the Mauna Loa Observatory suggest that the pre-industrial atmospheric CO2 concentration was a relatively stable ~275ppmv up until the mid 19th Century. Since then, CO2 levels have been climbing rapidly to levels that are often described as unprecedented in the last several hundred thousand to several million years.
Ice core CO2 data are great. Ice cores can yield continuous CO2 records from as far back as 800,000 years ago right on up to the 1970’s. The ice cores also form one of the pillars of Warmista Junk Science: A stable pre-industrial atmospheric CO2 level of ~275 ppmv. The Antarctic ice core-derived CO2 estimates are inconsistent with just about every other method of measuring pre-industrial CO2 levels.
Three common ways to estimate pre-industrial atmospheric CO2 concentrations (before instrumental records began in 1959) are:
1) Measuring CO2 content in air bubbles trapped in ice cores.
2) Measuring the density of stomata in plants.
3) GEOCARB (Berner et al., 1991, 1999, 2004): A geological model for the evolution of atmospheric CO2 over the Phanerozoic Eon. This model is derived from “geological, geochemical, biological, and climatological data.” The main drivers being tectonic activity, organic matter burial and continental rock weathering.
ICE CORES
The advantage of Antarctic ice cores is that they can provide a continuous record of relative CO2 changes going back in time 800,000 years, with a resolution ranging from annual in the shallow section to multi-decadal in the deeper section. Pleistocene-age ice core records seem to indicate a strong correlation between CO2 and temperature; although the delta-CO2 lags behind the delta-T by an average of 800 years… 
Ice cores from Greenland are rarely used in CO2 reconstructions. The maximum usable Greenland record only dates as far back as ~130,000 years ago (Eemian/Sangamonian); the deeper ice has been deformed. The Greenland ice cores do tend to have a higher resolution than the Antarctic cores because there is a higher snow accumulation rate in Greenland. Funny thing about the Greenland cores: They show much higher CO2 levels (330-350 ppmv) during Holocene warm periods and Pleistocene interstadials. The Dye 3 ice core shows an average CO2 level of 331 ppmv (+/-17) during the Preboreal Oscillation (~11,500 years ago). These higher CO2 levels have been explained away as being the result of in situ chemical reactions (Anklin et al., 1997).
PLANT STOMATA
Stomata are microscopic pores found in leaves and the stem epidermis of plants. They are used for gas exchange. The stomatal density in some C3 plants will vary inversely with the concentration of atmospheric CO2. Stomatal density can be empirically tested and calibrated to CO2 changes over the last 60 years in living plants. The advantage to the stomatal data is that the relationship of the Stomatal Index and atmospheric CO2 can be empirically demonstrated…

When stomata-derived CO2 (red) is compared to ice core-derived CO2 (blue), the stomata generally show much more variability in the atmospheric CO2 level and often show levels much higher than the ice cores…

Plant stomata suggest that the pre-industrial CO2 levels were commonly in the 360 to 390ppmv range.
GEOCARB
GEOCARB provides a continuous long-term record of atmospheric CO2 changes; but it is a very low-frequency record…

The lack of a long-term correlation between CO2 and temperature is very apparent when GEOCARB is compared to Veizer’s d18O-derived Phanerozoic temperature reconstruction. As can be seen in the figure above, plant stomata indicate a much greater range of CO2 variability; but are in general agreement with the lower frequency GEOCARB model.
DISCUSSION
Ice cores and GEOCARB provide continuous long-term records; while plant stomata records are discontinuous and limited to fossil stomata that can be accurately aged and calibrated to extant plant taxa. GEOCARB yields a very low frequency record, ice cores have better resolution and stomata can yield very high frequency data. Modern CO2 levels are unspectacular according to GEOCARB, unprecedented according to the ice cores and not anomalous according to plant stomata. So which method provides the most accurate reconstruction of past atmospheric CO2?
The problems with the ice core data are 1) the air-age vs. ice-age delta and 2) the effects of burial depth on gas concentrations.
The age of the layers of ice can be fairly easily and accurately determined. The age of the air trapped in the ice is not so easily or accurately determined. Currently the most common method for aging the air is through the use of “firn densification models” (FDM). Firn is more dense than snow; but less dense than ice. As the layers of snow and ice are buried, they are compressed into firn and then ice. The depth at which the pore space in the firn closes off and traps gas can vary greatly… So the delta between the age of the ice and the ago of the air can vary from as little as 30 years to more than 2,000 years.
The EPICA C core has a delta of over 2,000 years. The pores don’t close off until a depth of 99 m, where the ice is 2,424 years old. According to the firn densification model, last year’s air is trapped at that depth in ice that was deposited over 2,000 years ago.
I have a lot of doubts about the accuracy of the FDM method. I somehow doubt that the air at a depth of 99 meters is last year’s air. Gas doesn’t tend to migrate downward through sediment… Being less dense than rock and water, it migrates upward. That’s why oil and gas are almost always a lot older than the rock formations in which they are trapped. I do realize that the contemporaneous atmosphere will permeate down into the ice… But it seems to me that at depth, there would be a mixture of air permeating downward, in situ air, and older air that had migrated upward before the ice fully “lithified”.
A recent study (Van Hoof et al., 2005) demonstrated that the ice core CO2 data essentially represent a low-frequency, century to multi-century moving average of past atmospheric CO2 levels.

It appears that the ice core data represent a long-term, low-frequency moving average of the atmospheric CO2 concentration; while the stomata yield a high frequency component.
The stomata data routinely show that atmospheric CO2 levels were higher than the ice cores do. Plant stomata data from the previous interglacial (Eemian/Sangamonian) were higher than the ice cores indicate…

The GEOCARB data also suggest that ice core CO2 data are too low…

The average CO2 level of the Pleistocene ice cores is 36ppmv less than GEOCARB…

Recent satellite data (NASA AIRS) show that atmospheric CO2 levels in the polar regions are significantly less than in lower latitudes…


So… The ice core data should be yielding lower CO2 levels than the Mauna Loa Observatory and the plant stomata.
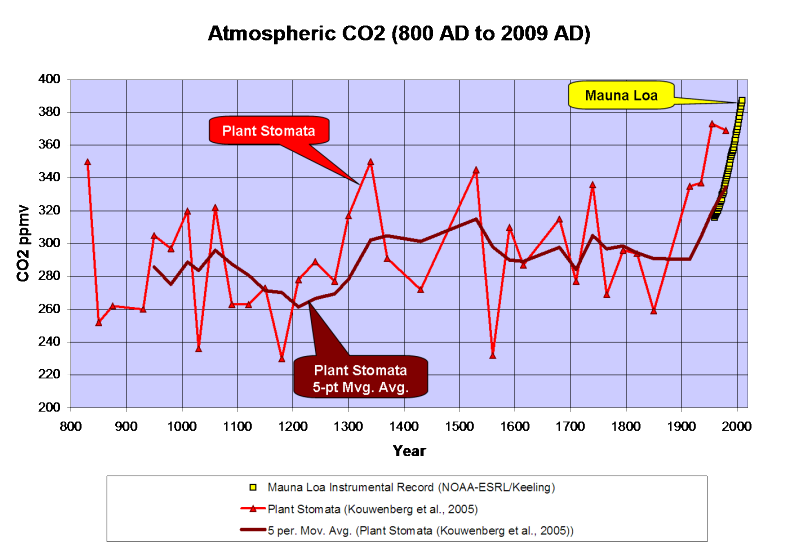
Kouwenberg et al., 2005 found that a “stomatal frequency record based on buried Tsuga heterophylla needles reveals significant centennial-scale atmospheric CO2 fluctuations during the last millennium.”
Plant stomata data show much greater variability of atmospheric CO2 over the last 1,000 years than the ice cores and that CO2 levels have often been between 300 and 340ppmv over the last millennium, including a 120ppmv rise from the late 12th Century through the mid 14th Century. The stomata data also indicate higher CO2 levels than the Mauna Loa instrumental record; but a 5-point moving average ties into the instrumental record quite nicely…

A survey of historical chemical analyses (Beck, 2007) shows even more variability in atmospheric CO2 levels than the plant stomata data since 1800…

WHAT DOES IT ALL MEAN?
The current “paradigm” says that atmospheric CO2 has risen from ~275ppmv to 388ppmv since the mid-1800’s as the result of fossil fuel combustion by humans. Increasing CO2 levels are supposedly warming the planet…

However, if we use Moberg’s (2005) non-Hockey Stick reconstruction, the correlation between CO2 and temperature changes a bit…

Moberg did a far better job in honoring the low frequency components of the climate signal. Reconstructions like these indicate a far more variable climate over the last 2,000 years than the “Hockey Sticks” do. Moberg also shows that the warm up from the Little Ice Age began in 1600, 260 years before CO2 levels started to rise.
As can be seen below, geologically consistent reconstructions like Moberg and Esper are in far better agreement with “direct” paleotemperature measurements, like Alley’s ice core reconstruction for Central Greenland…

In fairness to Dr. Mann, his 2008 reconstruction did restore the Medieval Warm Period and Little Ice Age to their proper places; but he still used Mike’s Nature Trick to slap a hockey stick blade onto the 20th century.
What happens if we use the plant stomata-derived CO2 instead of the ice core data?

We find that the ~250-year lag time is consistent. CO2 levels peaked 250 years after the Medieval Warm Period peaked and the Little Ice Age cooling began and CO2 bottomed out 240 years after the trough of the Little Ice Age. In a fashion similar to the glacial/interglacial lags in the ice cores, the plant stomata data indicate that CO2 has lagged behind temperature changes by about 250 years over the last millennium. The rise in CO2 that began in 1860 is most likely the result of warming oceans degassing.
While we don’t have a continuous stomata record over the Holocene, it does appear that a lag time was also present in the early Holocene…

Once dissolved in the deep-ocean, the residence time for carbon atoms can be more than 500 years. So, a 150- to 200-year lag time between the ~1,500-year climate cycle and oceanic CO2 degassing should come as little surprise.
CONCLUSIONS
-
Ice core data provide a low-frequency estimate of atmospheric CO2 variations of the glacial/interglacial cycles of the Pleistocene. However, the ice cores seriously underestimate the variability of interglacial CO2 levels.
-
GEOCARB shows that ice cores underestimate the long-term average Pleistocene CO2 level by 36ppmv.
-
Modern satellite data show that atmospheric CO2 levels in Antarctica are 20 to 30ppmv less than lower latitudes.
-
Plant stomata data show that ice cores do not resolve past decadal and century scale CO2 variations that were of comparable amplitude and frequency to the rise since 1860.
Thus it is concluded that:
-
CO2 levels from the Early Holocene through pre-industrial times were highly variable and not stable as the Antarctic ice cores suggest.
-
The carbon and climate cycles are coupled in a consistent manner from the Early Holocene to the present day.
-
The carbon cycle lags behind the climate cycle and thus does not drive the climate cycle.
-
The lag time is consistent with the hypothesis of a temperature-driven carbon cycle.
-
The anthropogenic contribution to the carbon cycle since 1860 is minimal and inconsequential.
Note: Unless otherwise indicated, all of the climate reconstructions used in this article are for the Northern Hemisphere.
References
Anklin, M., J. Schwander, B. Stauffer, J. Tschumi, A. Fuchs, J.M. Barnola, and D. Raynaud, CO2 record between 40 and 8 kyr BP from the GRIP ice core, Journal of Geophysical Research, 102 (C12), 26539-26545, 1997.
Wagner et al., 1999. Century-Scale Shifts in Early Holocene Atmospheric CO2 Concentration. Science 18 June 1999: Vol. 284. no. 5422, pp. 1971 – 1973.
Berner et al., 2001. GEOCARB III: A REVISED MODEL OF ATMOSPHERIC CO2 OVER PHANEROZOIC TIME. American Journal of Science, Vol. 301, February, 2001, P. 182–204.
Kouwenberg, 2004. APPLICATION OF CONIFER NEEDLES IN THE RECONSTRUCTION OF HOLOCENE CO2 LEVELS. PhD Thesis. Laboratory of Palaeobotany and Palynology, University of Utrecht.
Wagner et al., 2004. Reproducibility of Holocene atmospheric CO2 records based on stomatal frequency. Quaternary Science Reviews 23 (2004) 1947–1954.
Esper et al., 2005. Climate: past ranges and future changes. Quaternary Science Reviews 24 (2005) 2164–2166.
Kouwenberg et al., 2005. Atmospheric CO2 fluctuations during the last millennium reconstructed by stomatal frequency analysis of Tsuga heterophylla needles. GEOLOGY, January 2005.
Van Hoof et al., 2005. Atmospheric CO2 during the 13th century AD: reconciliation of data from ice core measurements and stomatal frequency analysis. Tellus (2005), 57B, 351–355.
Rundgren et al., 2005. Last interglacial atmospheric CO2 changes from stomatal index data and their relation to climate variations. Global and Planetary Change 49 (2005) 47–62.
Jessen et al., 2005. Abrupt climatic changes and an unstable transition into a late Holocene Thermal Decline: a multiproxy lacustrine record from southern Sweden. J. Quaternary Sci., Vol. 20(4) 349–362 (2005).
Beck, 2007. 180 Years of Atmospheric CO2 Gas Analysis by Chemical Methods. ENERGY & ENVIRONMENT. VOLUME 18 No. 2 2007.
Loulergue et al., 2007. New constraints on the gas age-ice age difference along the EPICA ice cores, 0–50 kyr. Clim. Past, 3, 527–540, 2007.
DATA SOURCES
CO2
Etheridge et al., 1998. Historical CO2 record derived from a spline fit (75 year cutoff) of the Law Dome DSS, DE08, and DE08-2 ice cores.
NOAA-ESRL / Keeling.
Berner, R.A. and Z. Kothavala, 2001. GEOCARB III: A Revised Model of Atmospheric CO2 over Phanerozoic Time, IGBP PAGES/World Data Center for Paleoclimatology Data Contribution Series # 2002-051. NOAA/NGDC Paleoclimatology Program, Boulder CO, USA.
Kouwenberg et al., 2005. Atmospheric CO2 fluctuations during the last millennium reconstructed by stomatal frequency analysis of Tsuga heterophylla needles. GEOLOGY, January 2005.
Lüthi, D., M. Le Floch, B. Bereiter, T. Blunier, J.-M. Barnola, U. Siegenthaler, D. Raynaud, J. Jouzel, H. Fischer, K. Kawamura, and T.F. Stocker. 2008. High-resolution carbon dioxide concentration record 650,000-800,000 years before present. Nature, Vol. 453, pp. 379-382, 15 May 2008. doi:10.1038/nature06949.
Royer, D.L. 2006. CO2-forced climate thresholds during the Phanerozoic. Geochimica et Cosmochimica Acta, Vol. 70, pp. 5665-5675. doi:10.1016/j.gca.2005.11.031.
TEMPERATURE RECONSTRUCTIONS
Moberg, A., et al. 2005. 2,000-Year Northern Hemisphere Temperature Reconstruction. IGBP PAGES/World Data Center for Paleoclimatology Data Contribution Series # 2005-019. NOAA/NGDC Paleoclimatology Program, Boulder CO, USA.
Esper, J., et al., 2003, Northern Hemisphere Extratropical Temperature Reconstruction, IGBP PAGES/World Data Center for Paleoclimatology Data Contribution Series # 2003-036. NOAA/NGDC Paleoclimatology Program, Boulder CO, USA.
Mann, M.E. and P.D. Jones, 2003, 2,000 Year Hemispheric Multi-proxy Temperature Reconstructions, IGBP PAGES/World Data Center for Paleoclimatology Data Contribution Series #2003-051. NOAA/NGDC Paleoclimatology Program, Boulder CO, USA.
Alley, R.B.. 2004. GISP2 Ice Core Temperature and Accumulation Data. IGBP PAGES/World Data Center for Paleoclimatology Data Contribution Series #2004-013. NOAA/NGDC Paleoclimatology Program, Boulder CO, USA.
VEIZER d18O% ISOTOPE DATA. 2004 Update.
Discover more from Watts Up With That?
Subscribe to get the latest posts sent to your email.
Very interesting. I did a lot of reading on Stomata a year ago and came to similar conclusions. One comment in the research was that:
The stomata react strongly to low CO2 levels, i.e. increase in number, as this is necessary for survival, but as the CO2 concentration increases, the reduction in stomata numbers drops off. The plant doesn’t need the extra stomata, but apart from efficiency, there is no adaptive need for the stomata levels to fall too far. In any case, CO2 varies by season, and diurnally, so the reaction to higher CO2 is muted.
In other words, stomata indicated high CO2 concentrations can be MUCH HIGHER than indicated by the stomata. The high concentrations in the charts are therefore the minimum possible CO2 levels, not necessarily the actual CO2 levels.
David
I have added a link to this article to the one I ran over a Tav which now contains numerous links, discussions and papers on the subject of Co2 measurements.
http://noconsensus.wordpress.com/2010/03/06/historic-variations-in-co2-measurements/#comment-43907
tonyb
Dave Springer says: “The amount of anthropogenic CO2 released into the atmosphere is one of the better known quantities in this debate…”
Okay, if it’s better known, then what is it?
“…The directly measured increase in atmospheric CO2 if (sic) only about half of the anthropogenic emissions….”
Okay, enough hand-waving. Give us the numbers, Dave S., please.
“The advantage of Antarctic ice cores is that they can provide a continuous record of relative CO2 changes going back in time 800,000 years, with a resolution ranging from annual in the shallow section to multi-decadal in the deeper section.”
That’s not true.
Here is the Historical CO2 Record from the Vostok Ice Core. As you can see the difference between Age of ice and Mean age of air in it is anywhere between 1879 and 6653 years (at depth 506.4 m and 3119.51 m respectively).
Therefore it takes several millennia for carbon dioxide to get enclosed in Antarctic ice. It means the resolution is much worse than several decades, even century scale spikes are smoothed out completely.
Temperature resolution is better, since in this case stable oxygen isotope ratio of ice itself is used as a proxy and water in ice crystals don’t move much once frozen.
If you want better resolution for carbon dioxide, you should choose a site where snow accumulation is fast (South-Eastern Greenland?). This way you’ll have shorter records with gas bubbles getting enclosed faster. Depth of firn-ice transition zone (about 90 m in Antarctica) mostly depends on pressure, so it does not vary much between sites.
But even in this case multi-decadal resolution (for CO2) is like pie in the sky.
I would also like to add my kudos , David. Your presentation was interesting and it sparked a really lively debate – which, as I understand it, is sort of what science was all about.
jorgekafkazar says:
December 26, 2010 at 1:54 pm
The emissions are based on a global inventory of fossil fuel sales (taxes!) per country:
http://www.eia.doe.gov/iea/carbon.html
Maybe somewhat underestimated, but rather accurate for the past decennia, less reliable farther back in time.
The increase in the atmosphere is measured at some 70 “background” stations all over the world, where a few near sea-level stations are averaged to give a “global” trend.
Mauna Loa many times is referenced, because it has the longest record (the South Pole started before MLO, but misses a few years). But for the trend it hardly matters which station you use.
The increase in the atmosphere is about 53% of the emissions. This is near the same percentage over a 100+ years period (data before 1958 are less reliable):
http://www.ferdinand-engelbeen.be/klimaat/klim_img/acc_co2_1900_2004.jpg
For the most recent (post-Mauna Loa) period:
http://www.ferdinand-engelbeen.be/klimaat/klim_img/dco2_em.jpg
where the year by year variability is caused by temperature variations, which influence the uptake by nature, but hardly influences the trend.
So, it seems the science was not settled after all. Good work.
Berényi Péter says:
December 26, 2010 at 1:55 pm
“The advantage of Antarctic ice cores is that they can provide a continuous record of relative CO2 changes going back in time 800,000 years, with a resolution ranging from annual in the shallow section to multi-decadal in the deeper section.”
That’s not true.
As you can see the difference between Age of ice and Mean age of air in it is anywhere between 1879 and 6653 years (at depth 506.4 m and 3119.51 m respectively).
Therefore it takes several millennia for carbon dioxide to get enclosed in Antarctic ice. It means the resolution is much worse than several decades, even century scale spikes are smoothed out completely.
There is a correlation between ice age – gas age difference and gas age smoothing (both depend of the accumulation rate), but the resolution of the gas age mainly depends on how long it takes to migrate through the pores vs. the speed of narrowing the pores. For the coastal Law Dome ice cores, the resolution is about a decade, for Vostok and Dome C about 600 and 560 years. A spike of 120 ppmv during 10 years or an increase of 2 ppmv during 600 years would be noticed in the Vostok ice core, but even a spike of 20 ppmv over one year would be measured in the Law Dome ice core.
The Greenland ice cores are not reliable for CO2, as the Icelandic volcanoes frequently added acid deposits over the sea salt (carbonate) inclusions.
@ferdinand meeus Engelbeen
‘CO2 levels are measured in “background” conditions at some 70+ places over the world + satellites.’
That’s over simplifying it to the absurd which just reinforce my general reasoning. First there wasn’t any sat a thousand years ago. We only have 30 years of readings from the latest 30 years and since the sat readings don’t correlate to the down to earth readings on a 1:1 basis, there’s discrepancies to account for, and explain, to boot, and until such time who can say with enough certainty what’s what in that department.
Take into account all the “70+” places, those doesn’t begin to cover the whole planet by even the most liberal statistical concoctions and thus can’t be seen as being representing any global average. Maybe if it were a laughing contest though . . . :p
‘Depends of the accumulation rate: ‘
Which is a problem of definition. The higher the definition the better it was supposed to get, but it didn’t did it? We can no more today with even higher definition than yesterday account for even a decades precision in any age, let alone ten years ago from today. So how can we be certain of the readings at all, really. Maybe it’s not so horribly wrong to be wrong by a few hundred years on some weathery event some thousand years ago but when a few trillions dollars hang in the balance today for what might or might not have been a thousand years ago . . .? One could say it is a travesty that we supposedly know it all what the readings been for a hundred thousand years with todays tech but can’t account for our own “climate” in our own snow and ice for the last couple of decades.
Just happen to be reading Solomon’s ‘The Deniers’ at the moment. He explains that it was only possible to get the nice splice between the Siple ice core data and the Mauna Loa data by shifting the former forward by 83 years. Did the Law Dome data have to be adjusted also?
Since the density of stomata varies with CO2 concentration, natural selection and evolution should be enough to show that CO2 varies a lot. If the CO2 level was constant, plants would evolve to produce the optimum density of stomata for that constant CO2. They might still vary the density to suit humidity and temperature, but wouldn’t have genes to vary the density according to the CO2 concentration.
To give a parallel: Scandinavian people have fair skin to let in enough light to produce vitamins. If a Scandinavian person moves to the tropics, they don’t become black. They just get sunburnt. They don’t have genes to regulate their skin colour to suit variations in sunlight, because for tens of thousands of years they’ve lived in a place without variations in sunlight.
Similarly, if plants lived in constant CO2, they wouldn’t have genes to adjust their stomata for variations in CO2.
The article mentions uncertainties with ice cores, but it doesn’t mention any of the uncertainties and problems with stomata CO2 data.
The conclusion “The rise in CO2 that began in 1860 is most likely the result of warming oceans degassing.” is based on the second to last graph. This graph doesn’t make a lot of sense. The arrows draw with lag times of 250 years seem rather arbitrarily sketched and with only two cases coincidence is quite likely. The value 250 years seem to be based on anything other than the graph itself.
The graph does not make a case for “The rise in CO2 that began in 1860 is most likely the result of warming oceans degassing.”. The temperature fall from the MWP looks to be about 0.6C and the CO2 decrease looks to be only about 30ppm. Yet CO2 has risen far more than 30ppm since then. Basically the recent CO2 rise is far greater than you’d expect even from the temperature/CO2 relationship seen in that graph.
Additionally the ocean is currently absorbing more CO2 than it emits so the cause of the ongoing rise cannot be ocean degassing.
As such the conclusion “The anthropogenic contribution to the carbon cycle since 1860 is minimal and inconsequential.” is not supported.
The anthropogenic contribution to the carbon cycle since 1860 is minimal and inconsequential.
David says
———-
Ice core data provide a low-frequency estimate of atmospheric CO2 variations of the glacial/interglacial cycles of the Pleistocene. However, the ice cores seriously underestimate the variability of interglacial CO2 levels.
————-
Not proven.
You have shown that the stomata give higher CO2 values and that you prefer these higher values.
I would think that the stomata have their own problems. For example stomata are on leaves which are in forests which show differences relative the global average.
You yourself provided evidence that the CO2 at low latitudes is slightly different to the values at high latitudes and some of this variation is due to biological activity.
You presented evidence that the ice core record is shifted in time. You did not demonstrate that the actual analysis values are an undererestimate.
In short you have only proven your own prejudices.
David, you also reran the good ole “temperature change preceded the CO2” story. I believe this has been debunked but you did not address the problems with this particular debating point.
Personally I am suspicious of the “compare the peaks of two curves” technique you use here because the relationships are not necessarily linear and noise makes the correct matching of leaks unreliable.
In addition it is widely believed that CO2 and temp are tied together in a feedback loop. This means that
1. changing the temp will change the CO2
2. Changing the CO2 will change the temp
So you have made an argument that temp affected CO2 in the past. Fine, sounds plausible. But that was then, this is now. We are dumping a whole lot of CO2 into the atmosphere NOW.
Drake reached a similar conclusion about the ice cores underestimated historical concentrations of CO2:
http://homepage.ntlworld.com/jdrake/Questioning_Climate/userfiles/Ice-core_corrections_report_2.pdf
Drake used a method based on the difference in age between the ice and the entraped gas which as Berenyi Peter notes can be considerable. Some people such as De Witt Payne say the Drake method doesn’t take into account rates of snow accumulation but the official method it seems also does not take into account compression reduction of trapped CO2 as Jaworowski identified.
I also see the old chestnut about whether ACO2 is entirely responsible for the increase in CO2; Ferdinand is always instructive in this regard but I don’t think anyone has fully appreciated the ramifications of the Knorr paper:
http://wattsupwiththat.files.wordpress.com/2009/11/knorr2009_co2_sequestration.pdf
Knorr shows that natural sinks are increasing so that the airborne fraction {AF] is constant; CO2 increase in the 20thC has been ~ 50% of the estimated increase in ACO2 so it is assumed that the increase in CO2 is entirely due to ACO2; but this is not logical; CO2 emissions can still be increasing; there is no rule which says CO2 emissions and sinks must be in natural balance; for instance about 12-15bya there was an imbalance between emissions and sinks which increased CO2 from ~200ppm to 270ppm and allowed modern agriculture to develop.
Ferdinand Engelbeen says:
December 26, 2010 at 3:10 pm
For the coastal Law Dome ice cores, the resolution is about a decade, for Vostok and Dome C about 600 and 560 years.
Would you explain if difference between mean age of air and age of ice in the same layer is more than two thousand years in the Vostok ice core, how the resolution is supposed to be as good as 600 years?
Dave:
I second and heartily endorse:
@Economic Geologist says:
December 26, 2010 at 10:21 am
“…From one geoscientist to another: nice piece of work.
Thanks for putting this together….”
It’s like an exploration program laid out for investors to weigh and plunk down their money.
I think too that humans are intrinsically more capable to survive than Dr. Malthus or Pamela Gray’s “bloom” of locusts would suggest.
Thanks for an interesting post, which has obviously taken some time to put together. I would question the statements: “Recent satellite data (NASA AIRS) show that atmospheric CO2 levels in the polar regions are significantly less than in lower latitudes…” and “Modern satellite data show that atmospheric CO2 levels in Antarctica are 20 to 30ppmv less than lower latitudes.“.
The data from various CO2 stations suggests otherwise:
http://members.westnet.com.au/jonas1/CO2AtVariousStations.jpg
Barrow is up in the Arctic, Mauna Loa is a bit tropical, South Pole is somewhere in Antarctica, and the others are dotted around the globe. They all toddle along pretty much together +- seasonal changes.
The full-sized AIRS pic:
http://www.nasa.gov/images/content/411791main_slide5-AIRS-full.jpg
shows that (a) the range of CO2 concentrations is mostly only around 4-5ppm, and (b) the date is July 2009. In July, the N Hemisphere ground-level CO2 is still near its annual high (it typically drops between July and October) and is probably at its annual high in the Troposphere because (I think) there is a bit of a time lag.
I would say the bulk of the difference between the S Pole and mid-latitudes in the AIRS pic is seasonal. In any case, it doesn’t look like a “significant” difference, and I would contend that the ice cores are not even remotely accurate enough to show the difference, as in “The ice core data should be yielding lower CO2 levels than the Mauna Loa Observatory and the plant stomata.“.
I actually suspect that the ice cores are wildly inaccurate, but of course I can’t prove that. Your post does help a bit, though, because if what I said above is correct, then the ice cores have no excuse for showing lower CO2 concentrations.
Very interesting David. Thank you.
Your mistrust of ice core CO2 analysis bears out Jaworowski’s work (he gets attacked like other competent sketpics have been) and I think Jaworowski takes your thesis further, he elaborates detail after detail of the mechanics that all render the ice CO2 record suspect.
Thank you also for putting forward evidence for the 250-odd year lag. This bears out what I have been suspecting, the slow thermohaline turnover being the cause for the still-steady rise of CO2.
http://www.greenworldtrust.org.uk/Science/Scientific/CO2-ice-HS.htm
jorgekafkazar says: “Okay, if [he amount of anthropogenic CO2 released into the atmosphere]’s better known, then what is it?”
http://cdiac.ornl.gov/ftp/trends/co2_emis/prc.dat
CO2 data is available here:
ftp://ftp.cmdl.noaa.gov/ccg/co2/trends/co2_mm_mlo.txt
Statements that the oceans are absorbing about half of human emissions are correct, but many other statements on the topic are quite wrong (eg. that the oceans are a net absorber so wouldn’t have released any CO2 in the absence of human emissions), as I suspect are most estimates of how much CO2 the oceans will continue to absorb (I expect the proportion being absorbed to rise in the near future).
Excellent analysis. We really needed this. A reference I gave on the subject was far too lightweight.
Brief stomata/ice core comments (ice core levels too low) here:
http://wattsupwiththat.com/2010/09/24/engelbeen-on-why-he-thinks-the-co2-increase-is-man-made-part-4/
Methanotroph comments (methanotrophs may convert methane to CO2 from ocean vents/clathrates) here:
http://wattsupwiththat.com/2010/09/16/engelbeen-on-why-he-thinks-the-co2-increase-is-man-made-part-3/
Engelbeen must be corrected here. The oceans contain 38000 Gt carbon and the atmosphere 700GtC. Henry’s law insists that about 1100GtC outgasses per ºC at 15ºC, which equates to over 600ppmC/ºC. Not 16ppmv/ºC as Engelbeen states. http://www.seafriends.org.nz/issues/global/acid.htm
Of course the deep ocean reacts slowly, as the 250 year delay between temperature and CO2 shows.
Lance Endersbee found a short term relationship between CO2 and temperature, at 150ppmv/ºC, still ten times higher than Engelbeen’s estimate. http://www.seafriends.org.nz/issues/global/acid2.htm
Most of the ocean’s outgassing is sequestered by terrestrial plant life, so what remains in air is just enough to speed terrestrial sequestration. http://www.seafriends.org.nz/issues/global/climate5.htm
The carbon budgets have some severe conflicts as explained in http://www.seafriends.org.nz/issues/global/climate4.htm which leads to only one conclusion: the oceans are outgassing and some of it remains in air. Human emissions play only a very small part, and that part has no whatsoever influence on temperature.
I have always suspected that the ice core data represented more of an average temperature for long time periods, than a specific, yearly temperature. Now I feel more certain it must represent an average, due to the fact I better understand how long it takes “firn” to solidify into the actual ice which imprisons the air bubbles. Over 2000 years!
If you’ve ever melted snow to make drinking water, you know how much air there is in snow. Snow is around 95% air, judging from how much water you get from a full sausepan of snow. In order for that snow to be turned into the ice of an ice core, which seems to be at most 5% air (judging very roughly, from photographs I’ve seen,) a great deal of air must be squeezed out. As this air can’t go down, it must go up, mixing with the air in the firn above. I imagine that, over the process of time, the air in the firn becomes a sort of blend, consisting of air stretching over a period of 2000 years, all being squeezed upwards.
A test of this idea would be to measure the CO2 in air in snow only a short distance down. Is it at 285 parts per million, or is it at 270 or less, indicating air from deeper down has been squeezed upwards, “contaminating” the sample?
Adding to this uncertainty is the simple fact air moves about due to the kinetic motions of its molocules. Just consider how flabby a balloon becomes, a few days after a party, and you become aware air molocules can even move through rubber, let alone firn.
Also consider the fact high pressure areas and low pressure areas are moving over the local, at times making the buried air in the snow at a higher pressure than the open air above, and at times lower, and one could suggest the snow pack would be inhaling at times, and exhaling at times.
All in all, it seems a great deal of mixing would occur. By the time the firn finally solidified to what is deemed ice, and the air is trapped, it seems it would be far from the state which is dubbed “pristine.”
Suppose the level of CO2 in the atmosphere peaked at 400 ppm, and then sank to 195 ppm, and then rose to 290. If all that air was mixed, the entrapped air would have a reading of around 250. It would be an average, not an exact figure. Furthermore, it would tend to flatten out any spikes and dips in the historical CO2 record.
My hunch is that this is exactly what has happened, and explains the flatness of the historical record.
LazyTeenager says:
“David, you also reran the good ole “temperature change preceded the CO2″ story. I believe this has been debunked…”
“I believe” is exactly the right response coming from a true believer.
It is clear that rising CO2 is the result of rising temperature, as anyone who hass ever opened a warm beer knows. CO2 follows temperature. Another chart.
This article has some good graphs.
But the central question is this: is rising CO2 harmful? We know from direct observation that more CO2 is beneficial. But we have yet to be shown any testable evidence that CO2 is harmful in any way. The onus is on the alarmist crowd to show that CO2 is a problem. So far, they have come up empty handed.
John S says:
December 26, 2010 at 9:17 am
“If a layman may ask a stupid question: Why does the Mauna Loa CO2 readings go up in such a perfectly straight line, in spite of year over year variations in fossil fuel usage, widespread deforestation, and whatever other factors contribute to the amount of CO2 in the Atmosphere.”
It’d sure be nice if the self-styled “experts” had been so bold. Then, they’d know there is no non-superficial correlation between rising CO2 levels and anthropogenic production.
Dave Springer says:
December 26, 2010 at 10:40 am
“There are a few things in the global warming controversy which are almost beyond reasoned debate.”
Yah. The science is settled. Yada, yada, yada…
Leif Svalgaard says:
December 26, 2010 at 11:14 am
“The Mauna Loa data shows there is little variation from year to year…”
You have not established any reason that CO2 behavior in the different eras should be the same, you have merely assumed it. Typically, data look less random when there is a good SNR, and we could be experiencing an upwelling of CO2 sequestered long ago giving a strong signal.
Ferdinand Engelbeen says:
December 26, 2010 at 1:00 pm
“The main problem is that stomata by definition are from leaves of growing vegetation on land…”
And, there are no problems whatsoever with the ice core data? Ferdinand, you have invested your entire set of arguments on the fidelity of the ice core data, and you seem not to realize you are walking the tightrope without a net.
Carl Chapman says:
December 26, 2010 at 3:25 pm
“Similarly, if plants lived in constant CO2, they wouldn’t have genes to adjust their stomata for variations in CO2.”
Very thought provoking. Thanks.
Onion says:
December 26, 2010 at 3:57 pm
“Additionally the ocean is currently absorbing more CO2 than it emits so the cause of the ongoing rise cannot be ocean degassing.”
Circulus in probandus. You think it is absorbing because you credit the rise in CO2 to anthropogenic sources, therefore the rise is due to anthropogenic sources because the oceans are absorbing.